Physicochemical Characterization of a Commercial Arbidol Formulation
 , Jamila Guliyeva1, Elnara Nasiyyati1, Saida Rzayeva1and Nizami Zeynalov1
Laboratory of Nanostructured Metal-Polymer Catalysts, Institute of Chemistry, PLE, Ministry of Science and Education of the Republic of Azerbaijan, Baku, Azerbaijan.
Corresponding Author E-mail: elmira.aliyeva@kqki.science.az
Download this article as:
ABSTRACT:Arbidol (umifenovir hydrochloride) is an indole-based antiviral drug with limited aqueous solubility. This study characterized a commercial Arbidol capsule formulation using SEM, XRD, FTIR, UV-Vis spectroscopy, DSC, and TGA/DTG. SEM revealed irregular particles with heterogeneous surface morphology, while XRD indicated crystalline components. FTIR showed functional-group-related absorption bands within the formulation. UV-Vis spectra exhibited medium-dependent behavior, with the highest absorbance at pH 1.2 and lower values at pH 6.8 and 7.4, where incomplete dissolution was observed before filtration. Among three nominal concentrations (30-50 µg/mL), the highest R2 values were obtained in 50% ethanol (0.99803) and pH 1.2 (0.99533), representing descriptive rather than validated quantitative relationships. DSC revealed multiple thermal events, whereas TGA/DTG demonstrated multistage mass loss. Overall, the findings provide a preliminary physicochemical profile of the commercial formulation, with observed characteristics reflecting potential contributions from both umifenovir hydrochloride and excipients.
KEYWORDS:Arbidol; Physicochemical Characterization; Solid-State Properties; Thermal analysis; UV-Vis Spectroscopy; X-ray diffraction
Introduction
Arbidol was initially developed in Russia and has been employed clinically as an antiviral therapeutic agent since the late 1980s.1,2 Currently, the drug is manufactured and commercially distributed across several countries, particularly Russia and China, where it is extensively utilized for the prevention and treatment of respiratory viral infections. Arbidol has garnered considerable scientific attention owing to its broad-spectrum antiviral potential.1,3,4 Investigations involving arbidol and its derivatives have evaluated their activity against coronaviruses, including SARS-CoV-2,5 influenza A and B viruses,1,4,6 hantavirus,4,7 herpes simplex virus type 2,8 and Zika virus.9
Its antiviral action predominantly involves the inhibition of viral membrane fusion and subsequent penetration into host cells.1,3 Investigations of resistant influenza mutants and structural characterization of its interaction with hemagglutinin have contributed to elucidating this mechanism.10,11 Its inhibitory activity toward SARS-CoV-2 has additionally been demonstrated in vitro,12 while the umifenovir scaffold has provided a foundation for the development of analogues with potentially enhanced antiviral properties.13
Chemically, umifenovir is designated as ethyl 6-bromo-4-[(dimethylamino)methyl]-5-hydroxy-1-methyl-2-[(phenylthio)methyl]-1H-indole-3-carboxylate.1,14 It is commercialized under the trade name Arbidol, and its hydrochloride and hydrochloride monohydrate forms have been documented in the literature.15 The molecule comprises an indole ring bearing hydroxyl, ester, dimethylamino, and phenylthio-containing substituents, together with a bromine atom. These structural attributes contribute to its polarity, intermolecular interactions, and crystalline organization,14-16 whereas hydrogen bonding and interactions with solvent molecules affect its dissolution behavior.16-18
Owing to its hydrophobic nature, the free-base form of arbidol exhibits poor aqueous solubility. Consequently, salt formation and inclusion complexation have been investigated to enhance its aqueous solubility and pharmaceutical performance.19-21 Solid dispersions, hydrotropic systems, and water-soluble polymer complexes have likewise been explored as alternative formulation strategies.22-24 This investigation was undertaken as a preliminary step toward incorporating the examined formulation into a hydrogel-based drug-delivery system. Characterization of the starting material establishes a baseline for subsequent comparisons with drug-loaded hydrogels, particularly concerning solid-state characteristics and thermal behavior. The UV-Vis measurements provide a preliminary assessment of the formulation’s spectral response in various media to facilitate the development of analytical procedures for future drug-release studies. Figure 1a depicts the molecular structure of umifenovir,14 whereas Figure 1b presents the commercial arbidol sample employed in the present investigation.
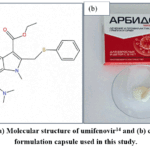 |
Figure 1: (a) Molecular structure of umifenovir14 and (b) commercial formulation capsule used in this study. Click here to View Figure |
Materials and Methods
Commercial formulation and sample preparation
Commercial formulation capsules (JSC Pharmstandard-Leksredstva, Kursk, Russia; batch No. 10425), purchased in Azerbaijan, were used in the present investigation. According to the manufacturer’s product information, each capsule contained 207 mg of umifenovir hydrochloride monohydrate, equivalent to 200 mg of umifenovir. The declared excipients included potato starch, microcrystalline cellulose, colloidal silicon dioxide (Aerosil), povidone (Kollidon 25), calcium stearate, and croscarmellose sodium. The capsule shell contained gelatin and titanium dioxide (E171). The capsules were opened, and only their powdered contents were collected for analysis; the capsule shells were excluded. The powder was examined without further grinding, sieving, drying, or purification. Solid-state and thermal analyses were therefore performed on the commercial capsule contents in their collected form. Consequently, the investigated material represented the complete commercial formulation containing both the active pharmaceutical ingredient and formulation excipients, rather than purified umifenovir hydrochloride. The same commercial capsule formulation was used throughout the entire study, and all analytical investigations, including UV-Vis spectroscopy, SEM, XRD, FTIR, DSC, and TGA, were performed using this material.
Scanning electron microscopy (SEM) analysis
Scanning electron microscopy (SEM) examination was conducted using a SIGMA scanning electron microscope (Carl Zeiss Microscopy GmbH, Jena, Germany) to characterize the surface morphology of the commercial capsule formulation. Prior to imaging, the sample was coated with a thin layer of gold. SEM micrographs were acquired in secondary electron imaging (SEI) mode at an accelerating voltage of 20 kV and working distances of 19-20 mm. Images were recorded at magnifications of ×100 and ×200, with a scale bar of 100 µm.
X-ray diffraction (XRD) analysis
X-ray diffraction (XRD) analysis was conducted using a Bruker D2 PHASER diffractometer to characterize the crystalline characteristics and solid-state features of the commercial capsule formulation. The diffraction profile was acquired over a 2θ range of approximately 5-60° using Cu Kα radiation (λ = 1.5406 Å). The resulting diffractogram was used to evaluate the presence and general characteristics of crystalline components within the analyzed formulation.
Fourier transform infrared (FTIR) analysis
Fourier transform infrared spectroscopy (FTIR) was conducted using a Nicolet iS10 FTIR spectrometer (Thermo Fisher Scientific, Madison, WI, USA) equipped with an attenuated total reflectance (ATR) accessory with a ZnSe crystal to characterize the functional groups and spectroscopic features of the commercial capsule formulation. The spectrum was acquired over the wavenumber range of 4000-400 cm-1 at a spectral resolution of 4 cm-1, with 32 scans co-added per spectrum. The resulting spectrum was evaluated to identify the principal absorption bands present in the analyzed formulation.
Preparation of arbidol solutions for UV-Vis analysis
Solutions of the commercial formulation capsule at nominal concentrations ranging from 30 to 50 µg/mL were prepared in dimethyl sulfoxide (DMSO), 50% ethanol solution, and buffer media at pH 1.2, 6.8, and 7.4 for preliminary UV-Vis spectroscopic investigation under varying solvent and pH conditions. The nominal concentrations were based on the amount of commercial capsule powder used for solution preparation and did not represent experimentally determined concentrations of umifenovir hydrochloride. For DMSO measurements, a stock solution was prepared by dispersing 5 mg of the commercial capsule powder in 8 mL of DMSO, corresponding to a nominal concentration of 625 µg/mL. Working solutions with nominal concentrations of 30, 40, and 50 µg/mL were prepared by transferring 0.48, 0.64, and 0.80 mL of the stock solution, respectively, and diluting each to a final volume of 10 mL with DMSO. For measurements in 50% ethanol, a stock solution with a nominal concentration of 500 µg/mL was prepared by dispersing 50 mg of the commercial capsule powder in 50% ethanol and adjusting the final volume to 100 mL. Working solutions with nominal concentrations of 30, 40, and 50 µg/mL were prepared by transferring 0.60, 0.80, and 1.00 mL of the stock solution, respectively, and diluting each to a final volume of 10 mL with 50% ethanol.
The pH 1.2 medium was prepared by diluting approximately 4 mL of 1 M HCl with distilled water, followed by adjustment to pH 1.2 and dilution to a final volume of 100 mL. For the pH 6.8 medium, 3.0 g of potassium hydrogen phosphate trihydrate (K2HPO4·3H2O) was dissolved in distilled water, the pH was adjusted to 6.8 using 1 M HCl, and the final volume was adjusted to 100 mL. For the pH 7.4 medium, 4.0 g of K2HPO4·3H2O was dissolved in distilled water, the pH was adjusted to 7.4 using 1 M NaOH, and the final volume was adjusted to 100 mL. The final pH values were measured at room temperature. For measurements in these media, separate stock solutions were prepared at pH 1.2, 6.8, and 7.4 by dispersing 40 mg of the commercial capsule powder in 100 mL of the corresponding medium, resulting in a nominal concentration of 400 µg/mL. Working solutions with nominal concentrations of 30, 40, and 50 µg/mL were prepared by transferring 0.75, 1.00, and 1.25 mL of the corresponding stock solution, respectively, and diluting each to a final volume of 10 mL with the same medium.
The solutions were prepared before UV-Vis analysis. UV-Vis absorption measurements were conducted using a UV-1800 spectrophotometer (Shimadzu Corporation, Kyoto, Japan) across the wavelength range of 190-800 nm in absorbance mode using quartz cuvettes with an optical path length of 10 mm (1 cm). The samples were filtered through filter paper before UV-Vis analysis. Blank correction was performed using the corresponding drug-free solvent or buffer medium for each measurement condition. Each solution was prepared once and measured three times under the same experimental conditions (n = 3).
Differential scanning calorimetry (DSC) analysis
Differential scanning calorimetry (DSC) was conducted on the commercial capsule formulation using a DSC Q2000 instrument (TA Instruments-Waters LLC, New Castle, DE, USA) fitted with a standard DSC cell and an RCS 90 cooling unit. A 2.1900 mg portion of the capsule powder was placed in a Tzero aluminum pan. The measurements were performed under a nitrogen atmosphere with a purge flow rate of 50 mL/min. The sample was cooled to -20 °C at a rate of 5 °C/min, equilibrated, and subsequently heated to 250 °C at 10 °C/min. Following equilibration at 250 °C, the sample was cooled to -10 °C at 50 °C/min, equilibrated, and then reheated to 250 °C at 10 °C/min. The resulting data were processed using TA Instruments TRIOS software, version 5.7.2.101.
Thermogravimetric analysis and derivative thermogravimetry (TGA/DTG)
Thermogravimetric analysis (TGA) was conducted on the commercial capsule formulation using a TGA 55 analyzer (TA Instruments-Waters LLC, New Castle, DE, USA). A 5.561 mg portion of the capsule powder was placed in a 100 µL platinum pan and heated to 800 °C at a rate of 20 °C/min under a nitrogen atmosphere. The derivative thermogravimetric (DTG) curve was derived from the recorded TGA data to identify the temperatures associated with the maximum rates of mass loss. The resulting data were processed using TA Instruments TRIOS software, version 5.7.2.101.
Data processing and graphical analysis
Data processing, linear regression analysis, and graphical presentation were performed using OriginPro 2019b (OriginLab Corporation, Northampton, MA, USA).
Results and Discussion
SEM analysis
Scanning electron microscopy (SEM) was employed to assess the surface morphology of the commercial capsule formulation. As illustrated in Figure 2, the analyzed capsule powder comprised irregularly shaped particles with visually varying dimensions. The particles were largely discrete and displayed heterogeneous surface characteristics, with evident variations in their morphology.
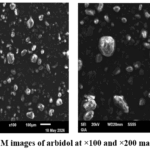 |
Figure 2: SEM images of arbidol at ×100 and ×200 magnification. |
XRD analysis
X-ray diffraction (XRD) analysis was conducted to examine the crystalline characteristics of the commercial capsule formulation. As presented in Figure 3, the diffractogram displayed several distinct diffraction peaks at approximately 2θ = 7.5°, 9.3°, 11.6°, 16.5°, 19.0°, 23.2°, 25.2°, 27.0°, 29.0°, and 32.0°. The presence of multiple relatively sharp reflections indicates the presence of crystalline components within the analyzed formulation. Some of the diffraction peaks may originate from crystalline excipients present in the formulation.¹⁴–¹⁷,²⁵
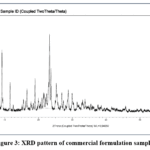 |
Figure 3: XRD pattern of commercial formulation sample. Click here to View Figure |
FTIR analysis
The FTIR spectrum of the commercial capsule formulation presented in Figure 4 displayed characteristic absorption bands associated with functional groups present in the analyzed sample. The broad and intense band detected at 3335 cm-1 was ascribed to O-H stretching vibrations.25 The absorption bands located at 3180 cm-1 and 3115 cm-1 were attributed to aromatic C-H stretching vibrations.18,20,25 Moreover, the bands at 2924 cm-1 and 2865 cm-1 were associated with CH3 and CH3 stretching vibrations.25 The weak absorption bands detected at 2724 cm-1 and 2680 cm-1 were observed in a spectral region that has been associated with protonated amine-related vibrations; however, this assignment remains tentative for the present commercial formulation.18 The prominent absorption band at 1670 cm-1 was attributed to C=O stretching vibrations.20,25 Additionally, the band at 1576 cm-1 was associated with aromatic C=C stretching vibrations.20 The absorption bands detected at 1455 cm-1 and 1373 cm-1 were tentatively associated with C-N-related and CH3 bending vibrations, respectively; however, contributions from other components of the commercial formulation cannot be excluded.18,25 The peaks located at 1164 cm-1, 1086 cm-1, and 1037 cm-1 were attributed to C-O and C-N stretching vibrations.20 The resulting FTIR spectrum demonstrated the presence of these functional-group-related absorption features within the commercial formulation.18,20,25
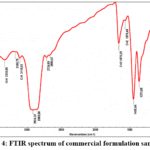 |
Figure 4: FTIR spectrum of commercial formulation sample. Click here to View Figure |
UV-Vis spectroscopic analysis
The UV-Vis spectra of solutions prepared from the commercial capsule formulation and recorded in DMSO (Figure 5a), 50% ethanol (Figure 5b), and buffer media at pH 1.2, 6.8, and 7.4 (Figures 6a-c, respectively) displayed concentration-dependent absorption behavior across the examined nominal concentration range. In all evaluated media, increasing the nominal concentration from 30 to 50 µg/mL produced a corresponding elevation in absorbance intensity without substantial alterations in the overall spectral profile. The comparative absorbance values measured at different nominal concentrations in the examined solvent systems and pH media are provided in (Table 1). The resulting spectra displayed absorption bands within the ultraviolet region that may be associated with components of the commercial formulation, including the conjugated aromatic and heterocyclic structure of umifenovir hydrochloride.14,15,26
The pH 1.2 solution produced the highest absorbance intensity and more distinct absorption peaks. The solution prepared at pH 1.2 was visually clear, with no visible precipitation observed. In contrast, incomplete dissolution and visible undissolved material were observed in the pH 6.8 and pH 7.4 media before filtration. Accordingly, the lower absorbance values recorded in these media should not be interpreted solely as differences in the intrinsic spectroscopic response of umifenovir hydrochloride. The observed differences may also reflect variations in dissolution behavior, ionization, aggregation, and matrix effects under the different pH conditions.27 DMSO and 50% ethanol media displayed comparatively well-resolved spectral profiles across the examined nominal concentration range. The maximum absorption wavelength, λmax, was observed at 265 nm in DMSO, 260 nm in 50% ethanol, 258 nm in pH 1.2 buffer, and 255 nm in both pH 6.8 and pH 7.4 buffers.26 Alongside the principal absorption band, secondary absorption regions were detected at approximately 313-315 nm in DMSO, 50% ethanol, and pH 1.2 media, whereas the secondary absorption region in pH 6.8 and pH 7.4 media appeared at approximately 275 nm and was less distinct.26,28 The maximum absorption wavelengths and linear regression parameters, including the regression equations, slopes, intercepts, and coefficients of determination (R2), are summarized in (Table 2).
The coefficient of determination (R2) (Figure 7) was employed to assess the absorbance-nominal concentration relationship for the commercial formulation in different media.29 The highest R2 values were recorded in 50% ethanol (R2 = 0.99803) and pH 1.2 buffer (R2 = 0.99533), indicating closer agreement with the fitted linear relationship over the examined nominal concentration range. DMSO likewise exhibited a high R2 value of 0.98684. Conversely, lower R2 values were recorded in pH 6.8 and pH 7.4 buffers, with corresponding values of 0.87335 and 0.88107, indicating greater deviation from linear behavior in these media.26,27 Considering the limited number of concentration levels investigated (30, 40, and 50 µg/mL), the regression analysis was used only as a descriptive assessment of the concentration-response relationship and not for validation of a quantitative calibration model. Accordingly, the nominal concentrations refer to the amounts of commercial capsule powder used for solution preparation and should not be interpreted as experimentally determined concentrations of the active pharmaceutical ingredient.
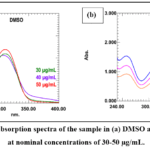 |
Figure 5: UV-Vis absorption spectra of the sample in (a) DMSO and (b) 50% ethanol at nominal concentrations of 30-50 µg/mL. Click here to View Figure |
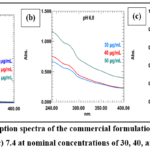 |
Figure 6: UV-Vis absorption spectra of the commercial formulation sample at pH (a) 1.2, (b) 6.8, and (c) 7.4 at nominal concentrations of 30, 40, and 50 µg/mL. Click here to View Figure |
Table 1: Comparative absorbance values of commercial formulation sample in different solvent systems and pH media at nominal concentrations of 30-50 µg/mL.
| Concentration
(µg/mL) |
DMSO | 50% EtOH | pH 1.2 | pH 6.8 | pH 7.4 |
| 30 | 1.50 | 0.90 | 1.22 | 0.64 |
0.28 |
|
40 |
1.52 | 1.20 | 1.74 | 0.72 | 0.46 |
| 50 | 1.55 | 1.55 | 2.40 | 1.11 |
0.50 |
Note: Absorbance values represent the mean of three instrumental measurements (n = 3) obtained using a 10-mm (cm-1) quartz cuvette at 265 nm (DMSO), 260 nm (50% EtOH), 258 nm (pH 1.2), and 255 nm (pH 6.8 and pH 7.4).
Table 2: Maximum absorption wavelengths, secondary absorption regions, and linear regression parameters of the commercial formulation sample in different solvent systems and pH media.
|
Parametr |
DMSO | 50% Ethanol | pH 1.2 | pH 6.8 | pH 7.4 |
| λmax (nm) | 265 | 260 | 258 | 255 |
255 |
|
Secondary absorption region (nm) |
~313 | ~315 | ~315 | ~275 | ~275 |
|
R² |
0.98684 | 0.99803 | 0.99533 | 0.87335 | 0.88107 |
| Slope | 0.0025 | 0.0325 | 0.04671 | 0.0235 |
0.011 |
|
Intercept |
1.42333 | -0.08333 | -0.06143 | -0.11667 | -0.02667 |
| Regression equation | y =1.42333 + 0.0025x | y = -0.08333 + 0.0325x | y = -0.06143 + 0.04671x | y = -0.11667 + 0.0235x |
y = -0.02667 + 0.011x |
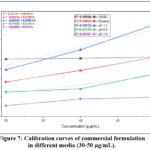 |
Figure 7: Calibration curves of commercial formulation in different media (30-50 µg/mL). Click here to View Figure |
DSC analysis
Differential scanning calorimetry was employed to characterize the thermal behavior of the commercial capsule formulation. As illustrated in Figure 8, the DSC thermogram displayed multiple thermal events. A broad endothermic transition, with an onset temperature of 86.21 °C and a peak at 100.46 °C, exhibited a normalized enthalpy of 2.0673 J/g and was ascribed to the elimination of absorbed moisture and/or crystallization water associated with the components of the commercial formulation.16,25 A weak thermal event was detected near 132.36 °C, with an onset temperature of 132.93 °C and a normalized enthalpy of 0.021529 J/g.17,25
A subsequent thermal event was detected at 182.52 °C, with an onset temperature of 183.03 °C and a normalized enthalpy of 0.026791 J/g. This temperature is close to the melting transition reported for umifenovir hydrochloride at approximately 185 °C.16,17,25 An additional event at 219.40 °C, with an onset temperature of 219.25 °C and a normalized enthalpy of 0.32093 J/g, may be associated with a subsequent high-temperature transformation involving thermal degradation and possible contributions from pharmaceutical excipients.25,30 The occurrence of multiple transitions and the complexity of the thermogram are consistent with the multicomponent nature of the examined commercial formulation.16,17,25
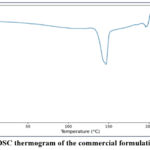 |
Figure 8: DSC thermogram of the commercial formulation sample. Click here to View Figure |
TGA/DTG analysis
Thermogravimetric analysis was conducted to assess the thermal stability and decomposition characteristics of the commercial capsule formulation. As illustrated in Figure 9, the TGA curve displayed a multistage mass-loss pattern. A minor initial mass loss occurred below approximately 150 °C and was associated with the loss of absorbed moisture and/or volatile components present in the formulation.
The principal mass-loss process occurred within the approximate temperature range of 190-350 °C. The DTG curve displayed a pronounced maximum near 200 °C, corresponding to the region of the most rapid mass loss, followed by a broader decomposition region at approximately 250-300 °C. These features indicate that the thermal decomposition of the commercial formulation occurred through multiple overlapping processes. Above approximately 350 °C, the sample exhibited a slower and more progressive mass loss. At the end of the analysis, approximately 28-30% of the initial sample mass remained at 800 °C.16,17,25
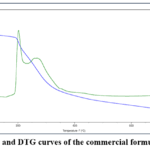 |
Figure 9: TGA and DTG curves of the commercial formulation sample. Click here to View Figure |
Conclusion
Altogether, the complementary analyses provided an integrated physicochemical profile of the examined commercial capsule formulation, including its structural, morphological, thermal, and spectroscopic characteristics. The results describe the properties of the commercial formulation under the investigated experimental conditions and may serve as baseline information for future comparative studies.
Since the examined sample originated from a commercial pharmaceutical product rather than an authenticated analytical reference material, the observed properties may reflect contributions from both umifenovir hydrochloride and formulation excipients. Further studies using authenticated umifenovir hydrochloride reference material and relevant excipients would facilitate a more specific evaluation of the physicochemical characteristics associated with the active pharmaceutical ingredient. Direct drug-loading and release studies would additionally be required before assessing its potential application in hydrogel-based drug delivery systems.
Acknowledgment
The authors gratefully acknowledge Neyroelm for assistance with the interpretation of the DSC and TGA/DTG data.
Declaration of generative AI and AI-assisted technologies
No artificial intelligence (AI) tools were used in the preparation, writing, analysis, interpretation, or revision of this manuscript. All scientific content, data analysis, and conclusions were produced solely by the authors.
Funding Sources
The author(s) received no financial support for the research, authorship, and/or publication of this article.
Conflict of Interest
The author(s) do not have any conflict of interest.
Data Availability Statement
This statement does not apply to this article.
Ethics Statement
This research did not involve human participants, animal subjects, or any material that requires ethical approval.
Author Contributions
- Elmira Aliyeva: Conceptualization, methodology, investigation, formal analysis, data curation, and writing-original draft.
- Jamila Guliyeva: Formal analysis and interpretation of UV-Vis data, data processing, and visualization using OriginPro 2019b.
- Elnara Nasiyyati: Preparation of solutions and samples. Saida Rzayeva: Acquisition of UV-Vis spectra. N
- izami Zeynalov: Supervision, validation, and writing, review, and editing. All authors reviewed and approved the final manuscript.
References
- Boriskin, Y. S.; Leneva, I. A.; Pécheur, E. I.; Polyak, S. J. Med. Chem. 2008, 15, 997–1005. https://doi.org/10.2174/092986708784049658
CrossRef - Balakin, K. V.; Filosa, R.; Lavrenov, S. N.; Mkrtchyan, A. S.; Nawrozkij, M. B.; Novakov, I. A. Chem. Rev. 2018, 87, 509–552. https://doi.org/10.1070/RCR4791
CrossRef - Teissier, E.; Zandomeneghi, G.; Loquet, A.; Lavillette, D.; Lavergne, J. P.; Montserret, R.; Cosset, F. L.; Böckmann, A.; Meier, B. H.; Penin, F.; Pécheur, E. I. PLoS ONE 2011, 6, e15874. https://doi.org/10.1371/journal.pone.0015874
CrossRef - Blaising, J.; Polyak, S. J.; Pécheur, E. I. Res. 2014, 107, 84–94. https://doi.org/10.1016/j.antiviral.2014.04.006
CrossRef - Vankadari, N. J. Antimicrob. Agents 2020, 56, 105998. https://doi.org/10.1016/j.ijantimicag.2020.105998
CrossRef - Liu, Q.; Xiong, H. R.; Lu, L.; Liu, Y. Y.; Luo, F.; Hou, W.; Yang, Z. Q. Acta Pharmacol. 2013, 34, 1075–1083. https://doi.org/10.1038/aps.2013.54
CrossRef - Xiong, H. R.; Zhang, Y. H.; Deng, K.; Liu, Q.; Liu, Y. Y.; Luo, F.; Hou, W.; Yang, Z. Q. J. Pharm. Res. 2016, 15, 1439–1445. https://doi.org/10.4314/tjpr.v15i7.12
CrossRef - Ma, N.; Shen, M.; Chen, T.; Liu, Y. Y.; Mao, Y. D.; Chen, L. J.; Xiong, H. R.; Hou, W.; Liu, D. Y.; Yang, Z. Q. Pharmacother. 2019, 118, 109359. https://doi.org/10.1016/j.biopha.2019.109359
CrossRef - Fink, S. L.; Vojtech, L.; Wagoner, J.; Slivinski, N. S. J.; Jackson, K. J.; Wang, R.; Khadka, S.; Luthra, P.; Basler, C. F.; Polyak, S. J. Rep. 2018, 8, 8989. https://doi.org/10.1038/s41598-018-27224-4
CrossRef - Leneva, I. A.; Russell, R. J.; Boriskin, Y. S.; Hay, A. J. Res. 2009, 81, 132–140. https://doi.org/10.1016/j.antiviral.2008.10.009
CrossRef - Kadam, R. U.; Wilson, I. A. Natl. Acad. Sci. U.S.A. 2017, 114, 206–214. https://doi.org/10.1073/pnas.1617020114
CrossRef - Wang, X.; Cao, R.; Zhang, H.; Liu, J.; Xu, M.; Hu, H.; Li, Y.; Zhao, L.; Li, W.; Sun, X.; Yang, X.; Shi, Z.; Deng, F.; Hu, Z.; Zhong, W.; Wang, M. Cell Discov. 2020, 6, 28. https://doi.org/10.1038/s41421-020-0169-8
CrossRef - Tanaka, H.; Miyagi, S.; Yoshida, Y.; Lamb, J. S.; Chick, C. N.; Luhata, L. P.; Shibata, M.; Tanaka, E.; Suzuki, Y.; Usuki, T. ChemistrySelect 2022, 7, e202202097. https://doi.org/10.1002/slct.202202097
CrossRef - Chernyshev, V. V.; Davlyatshin, D. I.; Shpanchenko, R. V.; Nosyrev, P. V. Kristallogr. Cryst. Mater. 2011, 226, 832–836. https://doi.org/10.1524/zkri.2011.1399
CrossRef - Orola, L.; Sarcevica, I.; Kons, A.; Actins, A.; Veidis, M. V. Mol. Struct. 2014, 1056–1057, 63–69. https://doi.org/10.1016/j.molstruc.2013.10.010
CrossRef - Manin, A. N.; Surov, A. O.; Churakov, A. V.; Perlovich, G. L. Crystals 2015, 5, 650–669. https://doi.org/10.3390/cryst5040650
CrossRef - Surov, A. O.; Manin, A. N.; Churakov, A. V.; Perlovich, G. L. Pharm. 2015, 12, 4154–4165. https://doi.org/10.1021/acs.molpharmaceut.5b00629
CrossRef - Kons, A.; Bērziņš, A.; Krūkle-Bērziņa, K.; Actiņš, A. J. Chem. 2014, 52, 28–40. https://doi.org/10.2478/ljc-2013-0003
CrossRef - Anwer, M. K.; Iqbal, M.; Ahmed, M. M.; Aldawsari, M. F.; Ansari, M. N.; Ezzeldin, E.; Khalil, N. Y.; Ali, R. Pharmaceuticals 2021, 14, 411. https://doi.org/10.3390/ph14050411
CrossRef - Li, X.; Wang, X.; Jiang, Q.; Chi, F.; Liu, Q.; Zhang, T. Drug Dev. Ind. Pharm. 2017, 43, 151–159. https://doi.org/10.1080/03639045.2016.1225755
CrossRef - Volkova, T. V.; Simonova, O. R.; Perlovich, G. L. Colloids Surf. A Physicochem. Eng. Asp. 2025, 705, 135574. https://doi.org/10.1016/j.colsurfa.2024.135574
CrossRef - Volkova, T. V.; Simonova, O. R.; Perlovich, G. L. Res. 2026, 43, 2463-2478. https://doi.org/10.1007/s11095-026-04106-3
CrossRef - Xu, L.; Li, S. M.; Sunada, H.; Wang, Q. F. Drug Deliv. Sci. Technol. 2007, 17, 145–148. https://doi.org/10.1016/S1773-2247(07)50022-5
CrossRef - Eropkin, M. Y.; Solovskii, M. V.; Smirnova, M. Y.; Bryazzhikova, T. S.; Gudkova, T. M.; Konovalova, N. I. Chem. J. 2009, 43, 563–567. https://doi.org/10.1007/s11094-010-0351-7
CrossRef - Rojek, B.; Bartyzel, A.; Sawicki, W.; Plenis, A. Molecules 2024, 29, 264. https://doi.org/10.3390/molecules29010264
CrossRef - Nalanda, R. B.; Priya, G. R.; Horan, A. Drug Deliv. Ther. 2024, 14, 74–82. https://doi.org/10.22270/jddt.v14i9.6789
CrossRef - Volkova, T. V.; Simonova, O. R.; Perlovich, G. L. Pharmaceutics 2023, 15, 422. https://doi.org/10.3390/pharmaceutics15020422
CrossRef - Volkova, T. V.; Simonova, O. R.; Perlovich, G. L. Mol. Liq. 2025, 423, 127036. https://doi.org/10.1016/j.molliq.2025.127036
CrossRef - Mali, A.; Bhilare, S.; Chaudhari, B.; Redasani, V. J. Pharm. Sci. Rev. Res. 2024, 84, 85–91. https://doi.org/10.47583/ijpsrr.2024.v84i06.014
CrossRef - Secretan, P. H.; Sadou Yayé, H.; Sogaldi, A.; Antignac, M.; Tortolano, L.; Thirion, O.; Vieillard, V.; Yagoubi, N.; Do, B. Pharm. Biomed. Anal. 2021, 196, 113934. https://doi.org/10.1016/j.jpba.2021.113934
CrossRef
Accepted on: 19 Sep 2026


ISSN Online: 2231-5039