Comparative Study of the Rheological Behavior of Normal Blood and Diabetes Mellitus Blood
 and Moez Guettari2
1University of Bucharest, Faculty of Chemistry, Department of Physical Chemistry, 4-12 Elisabeta Blvd, Bucharest, Romania
2University of Tunis. Preparatory Institute for Engineering Studies. Materials and Fluids Laboratory. Tunis. Tunisia
Corresponding Author Email: istanciu75@yahoo.com
DOI : http://dx.doi.org/10.13005/ojc/420537
Download this article as:

The aim of the present work is to study the human blood rheological properties of diabetic patients by using a rotational concentric viscometer, Contraves Low Shear 30, at 37°C. The shear-stress-,t( Pa), - shear rate, , rheogramms of non-diabetic patients of average age 55 years, were measured in the 0.0237 s-1 to 128.5 s-1 shear rate range. The obtained results show a non-Newtonian behaviour of human blood. Several empeical equations were proposed to describe the shear thinning behaviour of nomal human blood. In the second part of this work, the human blood of diabetic patients of an average age 55 years was studied in the same conditions. The obtained results show also a shear- thinning behavior. Compared to normal blood, diabetic blood exhibits higher viscosity at low shear rates, resulting in increased resistance to flow in microcirculation. At high shear rates, viscosity decreases sharply, reflecting the disruption of red blood cell aggregates and enhanced flow in larger vessels.
KEYWORDS:Comparative; Diabet melitus; Models; Rheology
Introduction
The physiology of the cardiovascular system has been studied and gradually clarified over several centuries. Already in antiquity the role of blood vessels was identified, it was realized that arteries and veins have different roles in blood circulation.
In the 17th century, Sir William Harvey carried out some “modern” cardiovascular research and observed that the movement of blood in vessels has a circulatory character. In the following century, Euler and D. Bernoulli made important contributions to the research of fluid dynamics with applications in hemodynamics.
The French physician and physiologist Poiseuille was the first, in 1844, to try to understand the dynamics of blood circulation. His results were supplemented by those of the Englishman Reynolds (1883).
Later, T. Young made fundamental contributions to research on the elastic properties of arterial tissues and on the propagation of blood pressure in the cardiovascular system. At the beginning of the 20th century, O. Frank introduced the idea of the analogy between the circulatory system and an electrical network.1,2
In the 1970s, “in vitro” and animal experiments were the main directions in cardiovascular investigations, but in recent years, advances in computational fluid dynamics together with spectacular improvements in computer performance have led to significant progress in cardiovascular research. With the help of modern non-invasive technology for data acquisition (i.e. nuclear magnetic resonance, spiral CT, etc.) as well as three-dimensional algorithms, various physical quantities, such as shear stress, can be calculated, while their measurement “in vivo” and even “in vitro” would be an extremely complicated problem.
In the last decade, the use of mathematical models supported by the use of appropriate numerical algorithms has allowed progress to be made in interpreting the functioning of the cardiovascular system both in normal physiological and pathological situations, as well as in the perspective of providing precise indications for the specific surgical approach.
Numerical simulations for the cardiovascular system can be of benefit to medicine; with their help, a surgeon can understand the effects of possible solutions in different situations in the blood circulation and can choose the most appropriate procedure for a specific patient.
This new perspective has led to the birth of a new chapter of applied mathematics and computational hemodynamics, based on mathematical models of fluid dynamics, in particular of blood, together with the computational approach. But with all the achievements, both in the field of mathematical modeling, numerical analysis, and scientific computational calculation – where a variety of new mathematical concepts and techniques have been introduced, many of the difficulties are still unsurpassed, representing a source of scientific confrontations for the years to come.
The fact that blood exhibits non-Newtonian behavior was first observed at the end of the last century2 Blood is an inhomogeneous, anisotropic fluid, composed of a suspension of many asymmetric, viscoelastic particles, carried in a fluid containing a large molecular mass and which behaves in a complicated way “under shear”.
Fournier3 analyzed blood from a rheological point of view, rheology being concerned with the flow behavior of fluids, being a science that establishes mathematical models that describe the behavior of fluids subjected to stress. He anticipated that the rheological behavior of blood is more complex than the behavior of a simple fluid such as water (for example).
In this context, Ishakawa et al.4 found that the pulsatile flow of a non-Newtonian fluid through a stenotic tube differs from the flow of a Newtonian fluid.
The non-Newtonian property enhances the wall shear stress as well as the wall pressure but also moderates the vorticity. Type 2 diabetes is a chronic condition that affects the way your body metabolizes sugar (glucose) — an important source of fuel for your body. With type 2 diabetes, your body either resists the effects of insulin — a hormone that regulates the movement of sugar into your cells — or doesn’t produce enough insulin to maintain normal glucose levels. It used to be known as adult-onset diabetes, but today more children are being diagnosed with the disorder, probably due to the rise in childhood obesity (figure 1). The main objective of this study is to examine the effect of diabet on the rheological behavior of human blood. So, the paper is devided in two part: (1) blood rheology of normal patients is studied and so several rheological models are tested, (2) blood rheology of diabetic patients is examined for diabetic patients. A comparative study is conducted to determine the diabetic effect on blood flow in venules, and capillaries.and in larger vessels.5-8
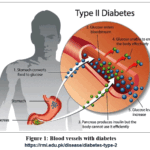 |
Figure 1: Blood vessels with diabetes Click here to View Figure |
https://rmi.edu.pk/disease/diabetes-type-2
Materials and Methods
Whole blood viscosity was measured using a rotational viscometer Contraves Low Shear 30 (Switzerland), Fig. 2, under conditions of steady blood flow at 11 shear rates from 0.0237 s-1 to 128,5 s-1 at 37 °C. The shear rates selected for this study, ranging from 0.0237 s⁻¹ to 128.5 s⁻¹, were chosen to capture the full spectrum of rheological behavior of blood in individuals with diabetes mellitus at 37 °C, reflecting physiological conditions. Low shear rates, such as 0.0237 s⁻¹, represent slow or near-stagnant flow, which occurs in microcirculation, venules, and capillaries. Evaluating blood viscosity at these shear rates is crucial because, under low-shear conditions, blood from diabetics often exhibits increased red blood cell clustering and higher yield stress, both of which lead to microvascular issues. Intermediate shear rates, approximately 1–50 s⁻¹, represent flow in medium-sized blood vessels and allow for the assessment of shear-thinning properties, which are frequently altered in diabetes due to changes in plasma composition and the deformability of erythrocytes. Elevated shear rates, reaching as high as 128.5 s⁻¹, simulate maximum arterial flow and physical activity conditions, facilitating the examination of asymptotic viscosity and flow efficiency in larger blood vessels. Assessing this entire spectrum guarantees that both detrimental effects at low shear and functional reactions at high shear are properly recorded. Maintaining the temperature at 37 °C preserves physiological relevance, as blood viscosity is significantly affected by temperature. Collectively, this range of shear rates allows for a comprehensive characterization of diabetic blood rheology, providing important information regarding vascular complications and overall hemodynamic performance.
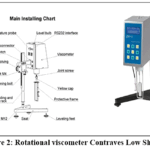 |
Figure 2: Rotational viscometer Contraves Low Shear 30 Click here to View Figure |
Results
The study included 20 patients (16 women and 4 men, mean age 57,25 ± 5,81 years) with type 2 diabetes mellitus and 10 patients with normal blood. The diagnosis of diabetes mellitus was based on clinical examination and estimation of blood glucose, insulin and HbA1C; its mean duration was 12,33 ± 5,3 years. Blood samples were collected in Li heparin tubes and rheological measurements were completed within 3 hours after blood preparation. Figure 3 presents dependence of dynamic viscosity on shear stress in normal group (n = 10) and in patients diabets (n = 20).9-14
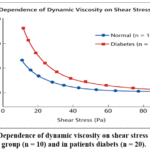 |
Figure 3: Dependence of dynamic viscosity on shear stress in normal group (n = 10) and in patients diabets (n = 20). Click here to View Figure |
Blood is a complex biological fluid that exhibits non-Newtonian rheological behavior, meaning its viscosity varies with applied shear stress. This property is primarily influenced by red blood cell (RBC) aggregation, deformability, plasma viscosity, and hematocrit. In diabetes mellitus, persistent high blood sugar causes biochemical and structural alterations in blood elements that significantly affect blood flow characteristics and encourage vascular issues.
This research investigates the correlation between dynamic viscosity and shear stress in healthy participants (n = 10) and individuals diagnosed with diabetes mellitus (n = 20). Under standardized conditions, venous blood samples were collected and analyzed at physiological temperature (37°C) using a rotational viscometer. Dynamic viscosity was assessed over various shear stresses that represent both microcirculatory and macrovascular flow.
In the control group, blood exhibited standard shear-thinning characteristics. Under low shear stress, viscosity was comparatively high because of the reversible aggregation of red blood cells (RBCs). As shear stress rose, viscosity decreased notably as RBC clusters separated and single cells oriented and altered shape with the flow direction. At elevated shear stress levels, viscosity neared a nearly stable value, signifying enhanced flow characteristics.
In contrast, blood samples from diabetic individuals showed markedly higher dynamic viscosity across all levels of shear stress. Even though shear-thinning remained noticeable, the reduction in viscosity as shear stress increased was not as marked as in the healthy group. The higher viscosity at low shear stress in diabetic blood is linked to increased RBC clustering and greater plasma viscosity, while the consistently high viscosity at higher shear stress probably indicates diminished RBC deformability caused by glycation of membrane proteins.
The results suggest that diabetes mellitus relates to modified blood rheology, marked by enhanced viscosity and disrupted shear-dependent flow characteristics. These rheological irregularities might lead to microvascular impairment and the advancement of diabetic complications. Improved insights into blood rheology in diabetes could help assess disease severity and enhance treatment strategies.
Figure 4 illustrates the relationship between dynamic viscosity and shear rate in the normal group (n = 10) and in diabetic patients (n = 20).
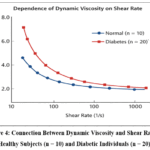 |
Figure 4: Connection Between Dynamic Viscosity and Shear Rate in Healthy Subjects (n = 10) and Diabetic Individuals (n = 20). Click here to View Figure |
Blood exhibits non-Newtonian rheological characteristics, indicating that its dynamic viscosity changes with the shear rate applied. This behavior is mainly influenced by aspects like red blood cell (RBC) clumping, cell flexibility, plasma thickness, and hematocrit values. In diabetes mellitus, persistent high blood sugar and associated metabolic issues change these factors, which affects blood flow dynamics and raises the risk of vascular complications.
This comparative study analyzed the change in dynamic viscosity concerning shear rate in a control group (n = 10) and in people with diabetes mellitus (n = 20). Venous blood samples were collected under controlled conditions and assessed at 37°C with a rotational viscometer. Measurements spanned a wide range of shear rates typical of physiological blood flow.
The results in the healthy group demonstrated significant shear-thinning behavior. At reduced shear rates, viscosity was comparatively high because of the creation of reversible RBC clusters. As shear rate increased, viscosity significantly decreased as the aggregates broke apart and red blood cells oriented and changed shape in the flow direction, enhancing circulation efficiency.
In contrast, diabetic blood exhibited higher dynamic viscosity at all shear rates. Although shear-thinning behavior was still present, the decrease in viscosity with increasing shear rate was less pronounced. This behavior is attributed to increased RBC aggregation, reduced RBC deformability, and elevated plasma.
Figure 5 presents dynamic viscosity on temperature in normal group (n = 10) and in patients diabets (n = 20).
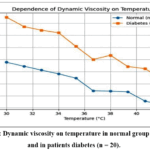 |
Figure 5: Dynamic viscosity on temperature in normal group (n = 10) and in patients diabets (n = 20). Click here to View Figure |
Figure 6 presents erythrocytes (Erythr) – a) and fibrinogen (Fib)-b) in control group (n = 10) and in patients (n = 20).
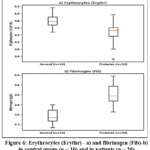 |
Figure 6: Erythrocytes (Erythr) – a) and fibrinogen (Fib)-b) in control group (n = 10) and in patients (n = 20). Click here to View Figure |
Blood rheology is strongly influenced by cellular components, particularly erythrocytes, and by plasma proteins such as fibrinogen. Erythrocyte deformability and aggregation determine flow resistance at different shear conditions, while fibrinogen plays a major role in plasma viscosity and red blood cell aggregation. This study presents a comparative analysis of the rheological behavior of erythrocytes (Erythr, graph a) and fibrinogen (Fib, graph b) in a control group (n = 10) and in patients (n = 20). In the control group, erythrocytes exhibited normal rheological behavior characterized by good deformability and moderate aggregation at low shear rates.
As shear rate rises, erythrocyte clusters disintegrate, leading to a decrease in apparent viscosity and facilitating smoother blood circulation. In the control group, fibrinogen levels minimally influenced plasma viscosity, and their effect on red blood cell aggregation stayed within normal physiological limits. Conversely, patients showed modified erythrocyte rheological characteristics, featuring reduced deformability and increased aggregation.
These irregularities resulted in increased viscosity, especially at low shear rates, as shown in graph (a). Graph (b) illustrates elevated fibrinogen-related effects in patients, indicating increased plasma viscosity and enhanced erythrocyte aggregation. Increased fibrinogen levels strengthen cell interactions, which in turn obstruct effective blood circulation. In summary, the concurrent alterations in erythrocyte mechanical properties and the heightened effect of fibrinogen significantly disrupt blood rheology in patients. These changes might lead to impaired microcirculation and an increased chance of vascular complications.
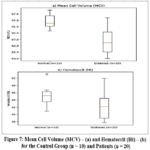 |
Figure 7: Mean Cell Volume (MCV) – (a) and Hematocrit (Ht) – (b) for the Control Group (n = 10) and Patients (n = 20). Click here to View Figure |
Blood rheology is significantly influenced by hematological factors like mean cell volume (MCV) and hematocrit (Ht), which both affect viscosity and flow resistance. This research offers a comparative assessment of rheological characteristics via graphical representations of MCV (graph a) and hematocrit (graph b) in a control group (n = 10) and a patient group (n = 20).
In the control group, MCV values remained within normal physiological ranges, reflecting stable erythrocyte size and maintained deformability. This facilitated typical rheological characteristics, allowing red blood cells to shape and align effectively under shear stress, thus preserving reduced blood viscosity. Graph (a) shows a consistent MCV distribution and positive flow attributes in individuals without health issues. Similarly, hematocrit values in the control group stayed within normal limits, as illustrated in graph (b), facilitating efficient circulation with low flow resistance.
Conversely, patients showed notable alterations in both MCV and hematocrit. Graph (a) depicts changes in MCV, indicating variations in erythrocyte dimensions that could impair deformability and elevate flow resistance. Graph (b) shows increased or abnormal hematocrit levels in patients, linked to greater blood viscosity and compromised microcirculatory blood flow.
In general, the overall changes in MCV and hematocrit in patients significantly affect blood rheology. Such variations could result in impaired circulation, higher vascular resistance, and a greater likelihood of circulatory issues compared to the control group.
Blood acts as a non-Newtonian fluid, with its rheological characteristics mainly influenced by the deformability of red blood cells, their aggregation, plasma viscosity, and hematocrit levels. While both standard and diabetic blood can be characterized by comparable rheological models, diabetes significantly alters the related parameters.
A commonly used approach is the power-law model, which outlines the decrease in apparent viscosity as the shear rate increases, signifying shear-thinning characteristics.
The consistency index is somewhat low, and viscosity decreases swiftly as shear rate increases, suggesting effective flow behavior.
In diabetes mellitus, the same model is still relevant but exhibits an increased consistency index and reduced shear-thinning characteristics. Blood from diabetics exhibits higher viscosity at all shear rates, especially at low shear, resulting from enhanced RBC aggregation, increased fibrinogen levels, and membrane rigidity from glycation. These alterations hinder blood circulation, particularly within the microvasculature.
Sophisticated models like the Casson and Carreau models highlight these differences even more. Normal blood has low yield stress and decreased zero-shear viscosity, while diabetic blood exhibits increased yield stress and higher zero-shear viscosity. This indicates a higher resistance to the initiation of flow and the continued presence of elevated viscosity even with increased shear rates.
In conclusion, comparative rheological modeling shows that diabetes mellitus alters normal blood flow properties, leading to heightened vascular resistance and the advancement of diabetic complications.
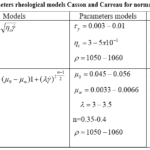 |
Table 1: Parameters rheological models Casson and Carreau for normal human blood Click here to View Table |
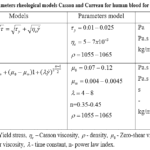 |
Table 2: Parameters rheological models Casson and Carreau for human blood for diabet melitus Click here to View Table |
Discussion
The comparative examination of rheological properties in normal blood and blood from diabetic individuals shows significant and clinically relevant differences in flow behavior between both groups. While both blood types exhibit non-Newtonian, shear-thinning characteristics, the degree of viscosity and its relation to shear conditions differ significantly due to metabolic and hematological alterations linked to diabetes.
In healthy blood, viscosity notably reduces as shear rate or shear stress rises. This trend is primarily caused by reversible red blood cell aggregation at low shear rates and their progressive separation, deformation, and alignment as shear increases. The typical flexibility of red blood cell membranes, combined with physiological levels of plasma proteins, allows for efficient adaptation to different flow situations, facilitating adequate perfusion in both major vessels and the microcirculation.
In contrast, blood from diabetics exhibits increased viscosity across all shear conditions and shows a less pronounced shear-thinning response. This altered rheological behavior stems from various mechanisms associated with diabetes. Chronic hyperglycemia leads to non-enzymatic glycation of red blood cell membrane proteins, reducing cell deformability and raising flow resistance. Additionally, increased plasma glucose and fibrinogen concentrations encourage greater erythrocyte aggregation, especially at low shear rates, leading to heightened apparent viscosity and yield stress.
The persistent increase in viscosity at elevated shear rates in diabetic blood suggests that diminished erythrocyte deformability continues to be a crucial factor, even when aggregation is not as pronounced. Elevated hematocrit and changes in mean cell volume, often seen in diabetic individuals, exacerbate blood viscosity and vascular resistance.
These rheological impairments have significant physiological implications. Increased blood viscosity can obstruct microcirculatory perfusion, restrict oxygen supply to tissues, and lead to endothelial dysfunction, thus promoting the advancement of diabetic microvascular complications like retinopathy, nephropathy, and neuropathy. In summary, the findings emphasize that abnormal blood rheology is a significant pathophysiological factor in diabetes mellitus and must be considered in clinical assessment and treatment strategies.9-18
Conclusion
This comparative study examined the rheological characteristics of normal human blood and blood from diabetic individuals through the Casson and Carreau models. The results clearly show that diabetes significantly alters blood rheology, leading to increased viscosity, higher yield stress, and more noticeable shear-thinning characteristics compared to healthy blood. These changes are primarily associated with heightened red blood cell clumping, reduced erythrocyte flexibility, and elevated plasma protein concentrations typically found in individuals with diabetes.
The Casson model, which incorporates yield stress, accurately depicts blood dynamics at low shear rates, rendering it especially pertinent for microcirculatory flow. Blood from diabetics exhibits notably higher yield stress and Casson viscosity compared to normal blood, indicating increased opposition to the start of flow. This is particularly important in capillaries and small vessels, where low shear conditions exist, and diminished perfusion is often linked to diabetic complications like retinopathy and nephropathy. However, the precision of the Casson model decreases at moderate to high shear rates, restricting its application in characterizing large-vessel hemodynamics.
Conversely, the Carreau model provides a continuous description of viscosity over a wide range of shear rates and excels in modeling arterial blood flow. In diabetic blood, parameters from the Carreau model reveal significantly elevated zero-shear viscosity, a longer time constant, and a lower power-law index, demonstrating enhanced shear-thinning relative to normal blood. These features render the Carreau model especially beneficial for computational fluid dynamics assessments of macrovascular circulation, where shear rates vary during the cardiac cycle.
In conclusion, while both models accurately represent the non-Newtonian characteristics of blood, their appropriateness differs depending on physiological circumstances. The Casson model is more appropriate for low-shear microvascular studies, whereas the Carreau model offers enhanced flexibility and numerical stability for large-scale hemodynamic simulations.
Integrating diabetes-related rheological parameters is essential for accurately forecasting blood flow patterns and shear stress distributions in both experimental and computational studies.
Funding Sources
The author(s) received no financial support for the research, authorship, and/or publication of this article.
Conflict of Interest
The author(s) do not have any conflict of interest.
Data Availability Statement
This statement does not apply to this article.
Ethics Statement
This research did not involve human participants, animal subjects, or any material that requires ethical approval.
References
- Burnier M, Fricker AF, Hayoz D, et al. 1999, Pharmacokinetic and pharmacodynamic effects of YM087, a combined V1/V2 vasopressin receptor antagonist in normal subjects. Eur J Clin Pharmacol. 55, 633–637.
CrossRef - Decaux G. 2001, Long-term treatment of patients with inappropriate secretion of antidiuretic hormone by the vasopressin receptor antagonist conivaptan, urea, or furosemide. Am J Med. 110, 582–584.
CrossRef - Fried LF, Palevsky PM. 1997, Hyponatremia and hypernatremia. Med Clin North Am. 81, 585–609.
CrossRef - Gheorghiade M, Konstam MA, Burnett JC Jr, et al; 2007, Efficacy of Vasopressin Antagonism in Heart Failure Outcome Study With Tolvaptan (EVEREST) Investigators. Short term clinical effects of tolvaptan, an oral vasopressin antagonist, in patients hospitalized for heart failure: the EVEREST Clinical Status Trials. JAMA. 297, 1332–1343.
CrossRef - Vaprisol (conivaptan HCl injection) [package insert]. DeerfieldIL: Astellas Tokai Co.; February 2006.
- Chien, S. 1970, Shear dependence of effective cell volume as a determinant of blood viscosity. Science 168(3934), 977–979.
CrossRef - Dintenfass, L. Rheology of blood in diagnostic and preventive medicine. Butterworths 1979 London.
- Schmid-Schönbein, H., Volger, E., & Klose, H. J. 1973, Microrheology and light transmission of blood. Pflügers Archiv. 333, 140–155.
CrossRef - McMillan, D. 1982, E. Plasma protein changes, blood viscosity, and diabetic microangiopathy. Diabetes. 31(2): 161–164.
CrossRef - Barnes, A. J., Locke, P., Scudder, P. R., Dormandy, T. L., Dormandy, J. A., & Slack, J. 1977, Is hyperviscosity a treatable component of diabetic microcirculatory disease? The Lancet. 310(8042), 789–791.
CrossRef - Caimi, G., Lo Presti, R., Montana, M., & Carollo, C. 1996, Hemorheological alterations in diabetes mellitus. Clinical Hemorheology. 16, 469–478.
CrossRef - Ernst, E., & Matrai, A. 1986, Altered red and white blood cell rheology in type II diabetes. Diabetes. 35(12), 1412–1415.
CrossRef - Ajmani, R. S., & Rifkind, J. M. 1999, Hemorheological changes in human diabetes mellitus. Diabetes & Metabolism. 25, 353–359.
- Baskurt, O. K., & Meiselman, H. J. 2003, Blood rheology and hemodynamics. Seminars in Thrombosis and Hemostasis. 29(5), 435–450.
CrossRef - Baskurt, O. K., Gelmont, D., & Meiselman, H. J. 1998, Red blood cell deformability in sepsis. American Journal of Respiratory and Critical Care Medicine. 157, 421–427.
CrossRef - Singh, M., Shin, S., & Ku, D. N. 2009, Effect of diabetic conditions on blood rheology. Biorheology. 46(4), 251–262.
- Gori, T., & Münzel, T. 2011, Hemorheological alterations in diabetes mellitus. European Heart Journal. 32, 2441–2443.
- Tripathi, P., & Kumar, R. 2014, Comparative study of blood viscosity in diabetic and non-diabetic subjects. International Journal of Scientific and Research Publications. 4(6), 1–4.
- Cho, Y. I., Mooney, M. P., & Cho, D. J. 2008, Hemorheological disorders in diabetes mellitus. Journal of Diabetes Science and Technology. 2(6), 1130–1138.
CrossRef - Cokelet, G. R., & Meiselman, H. J. 2007, Rheological properties of human blood and plasma. In Handbook of Hemorheology and Hemodynamics. (pp. 45–71). IOS Press.
 PlumX:
 Views: 234 Views
 PDF Downloads: 34
Accepted on: 19 Sep 2026
Second Review by: Dr. Naresh Batham
Final Approval by: Dr. Tanay Pramanik


ISSN Online: 2231-5039