Chemical and Statistical Analysis for the Mitigation of Acid Red 18 Dyes from Aqueous Systems Using Natural Adsorbent
 , Rajeev Kumar and Jyoti Chawla
Department of Applied Sciences (Chemistry), School of Engineering and Technology, Manav Rachna International Institute of Research and Studies, Faridabad, Haryana, India.
Corresponding Author E-mail:sheela990choudhary@gmail.com
Download this article as:
ABSTRACT:Statistical analysis, along with batch studies, was performed for the mitigation of AR 18 dye from water using pomegranate carpellary membrane powder (PCMP) as a sustainable, eco-friendly natural adsorbent. The analysis is supported by the chemical batch studies using various variables. Single-layer mitigation of AR 18 on PCMP was best described by the Langmuir model, having Qmax = 47.61 mg/g. Two statistical methodologies were applied to identify the optimal AR 18 mitigation conditions. The BBD model exhibited superior performance, demonstrated by a higher F-value (133.99) and R² (0.992), in contrast to CCD (F = 37.87, R² = 0.972), indicating better predictive accuracy and model significance. The optimal adsorption conditions derived from BBD resulted in equilibrium adsorption capacity (Qe) of 38.18 mg/g at 89.95 mg/L, AR 18 concentration, pH 4.19, 142.38 minutes, and 0.12 g/L PCMP dose. CCD optimization yielded a slightly lower Qe of 37.63 mg/g.
KEYWORDS:AR 18; Batch Studies; Box-Behnken Design; Isotherms modelling; Pomegranate carpellary membrane; Statistical analysis
Introduction
The unregulated disposal of industrial effluents into aquatic environments remains a significant environmental concern, leading to substantial deterioration of water quality and ecosystem disruption. Among various contaminants, synthetic dyes originating from textile, leather, paper, and plastic industries are considered particularly hazardous due to their complex aromatic structures, chemical stability, and resistance to biodegradation.1,2 Even at low concentrations, these dyes impair light penetration, disrupt photosynthetic activity in aquatic systems, and pose serious health risks, including carcinogenic and mutagenic effects.3,4 Around the world, treatment facilities discharge approximately 300,000 tons of synthetic dyes annually.5 Due to inefficient dyeing techniques, unbound azo dyes (10% to 40%) are subsequently discharged into wastewater streams, thereby intensifying environmental contamination.1. In a study conducted in Sangamner, Maharashtra, it was found that textile effluents discharged into the river raised BOD levels from 3.2 mg/L (upriver) to 12.8 mg/L (downriver), indicating severe organic pollution. Also, heavy metals (Cr and Pb) contamination were found above permissible limits, impacting agricultural productivity and aquatic life.6
New technologies, materials, and methods have been developed for wastewater treatment due to the high demand for fresh and affordable water. In this respect, continuous research is going on to reduce the cost of materials and environmentally friendly materials compared to traditional methods and materials.7,8 Traditional materials and methodologies have some limitations in terms of cost, efficiency, and toxicity. These drawbacks restrict their large-scale applicability, especially in resource-limited settings.9-11 In this context, adsorption has gained significant attention as an effective method for dye removal, owing to its operational simplicity, low cost, and ability to eliminate a wide range of dyes without generating toxic by-products. However, the use of commercial activated carbon is constrained by its high cost and regeneration challenges, prompting the search for low-cost and sustainable adsorbents.3,10
Recent research has increasingly focused on the potential of various biomass-based and industrial waste-derived adsorbents due to their abundance, biodegradability, and presence of functional groups that facilitate dye binding.12-14 Natural adsorbents used in various studies include charcoal of almond shell, sawdust, agricultural residues, leaf powders, and spent mushroom waste, mesoporous TiO2/AC materials (9,4,14,15). Pre-treated sugarcane bagasse and eggshells showed significant removal of Direct Blue-1 dye, showcasing their effectiveness as low-cost adsorbents.12 As a bio-based adsorbent, mango bark exhibited a high dye removal efficiency for a mixture of dyes, with a Qmax of 2.7 mg/g, indicating its potential for simultaneous dye removal.13 These materials possess highly active groups (hydroxyl, carboxyl, and amine), which facilitate effective interaction with dye molecules during the adsorption process. Although several biomass-based adsorbents have been investigated, many reported systems exhibit limitations such as moderate adsorption capacities, requirement of higher dosages, or effectiveness under restricted experimental conditions. Moreover, limited attention has been given to the potential application of pomegranate carpellary membrane, an agricultural waste material, for the removal of acidic dyes such as Acid Red 18.
In light of these gaps, the present study explores, for the first time, the use of pomegranate carpellary membrane powder (PCMP) as a novel, unmodified, and sustainable adsorbent for the removal of Acid Red 18 from aqueous solutions. The novelty of this work lies in the systematic evaluation of an underutilized biomass material in conjunction with statistical optimization techniques. Emphasis is based on evaluating the physicochemical properties of the PCMP adsorbent, optimizing the operational parameters affecting adsorption efficiency, and the adsorption process. BBD and CCD are popular statistical tools that have been used in this study to optimize process parameters. BBD requires fewer experiments and is efficient for quadratic models.16 CCD includes axial points, allowing a better fit for curved response surfaces.17 Both models are widely applied to enhance adsorption efficiency in pollutant removal studies18 Through this study, the potential of environmentally benign and cost-effective adsorbents for use in sustainable water treatment will be assessed.
Materials and Methods
PCMP adsorbent and solutions
For this study, fresh pomegranates were procured from a local grocery store in Faridabad, Haryana. The inner carpellary membranes located between the seeds were carefully separated manually. The collected membranes were thoroughly washed with water to remove any adhering dirt particles or impurities. After cleaning, they were oven-dried at 70oC for 24 hours to ensure consistent moisture removal and to achieve a constant weight, which is crucial for subsequent processing. The dried material was then grounded using a kitchen blender to obtain a fine powder, which was then passed through an 8-inch sieve (Mesh number 4) to ensure uniform particle size of 100-150 µm. The resulting powdered material was referred to as PCMP.
To understand its potential as an adsorbent, PCMP was subjected to FTIR analysis to identify desired active groups that helped in the mitigation of dye from aqueous solution. The surface morphology and structural characteristics of the adsorbent were analyzed using scanning electron microscopy (SEM). The specific surface area of the adsorbent was identified using BET (0.315 ± 0.008 m²/g) and Langmuir methods (0.357 ± 0.005 m²/g), indicating a modest but measurable porosity suitable for adsorption applications.
A stock solution of AR18 dye with a concentration of 100 ppm was prepared using distilled water. Working solutions of desired concentrations were prepared by appropriate dilution of the stock solution.
Batch adsorption experiments were carried out to study the effect of various adsorption parameters, including pH, time, initial AR18 concentration and amount of PCMP. The range of pH varied from 2 to 10, the concentration of dye varied from 20 to 100 mg/L, the amount of PCMP varied from 0.02 to 0.50 g/L, and the time of the batch studies varied from 20 to 120 minutes to evaluate the adsorption performance. Residual amounts of the dye in the solution before and after the mitigation process were analysed by a spectrophotometer (UV–Vis.) at 509 nm wavelength, with concentrations calculated using a standard calibration curve. The dye concentration was calculated using a pre-established calibration curve.
Response Surface Methodology
In adsorption studies, statistical modelling and optimization play an effective role in evaluating the influence of applied parameters. Among these, the BBD and CCD are widely used response surface methodology (RSM) tools that help in understanding the interactions between variables and optimizing conditions for maximum adsorption efficiency. BBD is known for its efficiency in requiring fewer experimental runs without compromising the accuracy of the model, making it ideal for quadratic response surfaces.16 On the other hand, CCD provides a more comprehensive design by incorporating axial and center points, enabling precise modeling of curvature in response surfaces.17 Both methods are extensively applied in environmental and chemical engineering research for optimizing adsorption processes involving dyes, heavy metals, and other pollutants from aqueous solutions.19,18
RSM expresses the response as a function of multiple independent variables and accounts for linear, squared (nonlinear), and interactive effects. The general form of the quadratic model used in this study is given by:

where,
Y denotes the predicted response (for example, % of AR 18 adsorbed),
α0 is the constant term (regression coefficient),
αi denotes the coefficients for individual (linear coefficient) effects of each factor,
αii are the coefficients associated with squared terms, reflecting curvature in the response (quadratic coefficient),
αij are the coefficients for the interaction effects between pairs of variables (interactive coefficient),
Xi, Xj are coded independent variables
ε accounts for experimental error or unexplained variation.
This model allows not only for the estimation of the main effects of each variable but also how they interact with each other to influence the overall adsorption performance.20
Results and Discussion
FTIR studies
Availability of active groups on PCMP was identified by FTIR analysis. Functional groups on the surface of sorbent interact with the AR 18 dye molecules to adsorb or mitigate the dye from aqueous systems. PCMP contains various active groups on the surface, confirmed by the FTIR spectrum. Sharp and broad peaks were observed in the IR spectra of PCMP before and after AR18 mitigation. A band at 3303 cm-1 is due to the hydroxide stretch of alcohols and phenols present in PCMP. A band at 2924 cm⁻¹ is observed by =C–H stretch of the alkenes or aromatics groups. A band at 2850 cm⁻¹ is observed by – C≡N, nitriles or C≡C, alkynes. A band at 1722 cm⁻¹ (sharp and strong) is observed by – C=O stretch of carbonyls. A peak at 1615 cm⁻¹ is due to – C=C stretch of aromatics, alkenes. Multiple small peaks between 1447–1150 cm⁻¹ are due to – C–H bending or the active functional group present in the membrane. Strong peaks at 1016 cm⁻¹ is due to – C–O stretch of acidic group in the membrane (Figure 1a). After adsorption of AR 18 dye from aqueous solution, there is a change in the IR spectrum of the membrane. Few new bands at 1516, 1311, 1105, and 1051 cm⁻¹ were observed due to the presence of the AR18 predominant and supporting groups on the membrane. Slight shifts in the peak positions are also observed in the spectrum after adsorption of AR 18 dye due to a change in the electronic environment of the groups (Figure 1b).14,15
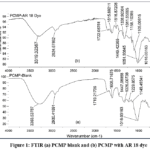 |
Figure 1: FTIR (a) PCMP blank and (b) PCMP with AR 18 dye Click here to View Figure |
SEM Studies
The electron beam utilized for imaging had an energy of 10 kV, which was appropriate for imaging fine surface features with minimal beam penetration for PCMP. To estimate the size of the detected structures, the image was magnified 3000 times at a length of 2 micrometers (µm). Surface features and topography were detected using secondary electron imaging. The particles’ asymmetrical form and sharp edges suggested a crystalline or fractured structure (Figure 2a). Presence of flaky and wrinkled particles indicated a more open and porous structure. The majority of individual particles were between 200 nm and ~1.5 µm in size, according to the 2 µm scale bar. Instead of homogeneous particles, there was polydispersity, or a range of sizes. The particles’ surfaces seemed layered and rough, which could mean a high surface area and porosity potential. The observed high apparent porosity in the image can be attributed to the interlayer spacing within the structure, which enhances its suitability for adsorption applications. The image implied that agglomeration and a rough surface may improve surface responses. The angular forms and faceted particles indicated well-defined crystal growth or grinding. A significant change was observed on PCMP due to the presence of AR18 (Figure 2b). The surface structure became irregular, granular, and compact after adsorption of AR18 dye. The structure texture was also changed and showed low visible porosity, with tightly packed particles indicating the occupation of the pores by outer particles.14,15
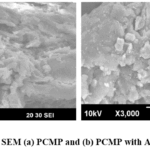 |
Figure 2: SEM (a) PCMP and (b) PCMP with AR 18 dye Click here to View Figure |
Batch study
A batch study using PCMP was conducted systematically at different variables to get the maximum removal of dye at equilibrium in the solution. Experiments were performed using different applied parameters (initial AR 18 concentration (20–100 mg/L), pH levels (ranging from 2 to 10), contact time (20 to 120 minutes), and PCMP dose (0.02–0.50 g/L). For each trial, the exact volume of AR 18 solution was treated with the specified amount of adsorbent and agitated using an orbital shaker under controlled conditions. After the adsorption process, the mixtures were filtered to isolate the solid adsorbent from the treated solution. The AR 18 concentration in the resulting filtrate was analysed by a spectrophotometer, allowing comparison of the dye levels before and after treatment.
Adsorption isotherms
Adsorption isotherms are critical tools for understanding how solute molecules interact with the surface of an adsorbent at equilibrium. These models describe the distribution of the adsorbate between the aqueous phase of AR 18 and the surface of PCMP at equilibrium and constant temperature. Among the various models, the Langmuir, Freundlich and Temkin isotherms are most commonly applied due to their ability to provide insights into surface characteristics and adsorption mechanisms.
Langmuir isotherm
The optimal experimental conditions were obtained at pH 4, with an incubation time of 120 min. and a PCMP dosage of 0.06 g/L. The Langmuir isotherm was employed to evaluate the homogeneous monolayer adsorption of AR 18 onto the PCMP surface using the following equation:
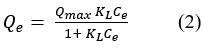
where
Qe = Amount of AR18 dye adsorbed at equilibrium
KL = Constant
Ce = Equilibrium concentration of the adsorbate
RL = Separation factor calculated as

The RL parameter provides insight into the characteristics of the adsorption process:
This parameter may have different values. Its value varies from zero to one, which decides the favourability of the process. High value indicates unfavourable adsorption, whereas low value indicates favourable adsorption. So, as KL increases (indicating stronger adsorbate-adsorbent affinity), RL decreases which suggests more favourable adsorption at a given initial concentration. The calculated RL value of 0.22, falling within the range 0 < RL < 1, indicates a favourable Langmuir isotherm model. Qmax (47.61 mg/g) of PCMP was determined from the linear graph (Ce versus Ce/qe) (Figure 3a) (7,11,15) (Table 1).
Freundlich isotherm
The heterogeneity of AR-18 dye adsorption onto PCMP was analyzed using Freundlich model. The potential for multilayer adsorption was assessed by applying the equation (4), which helps describe the adsorption behaviour more accurately under varying surface site energies using its linear form (5).
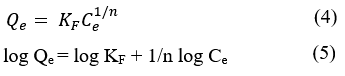
Here, Qe and Ce are AR-18 amount adsorbed at equilibrium and the equilibrium concentration of AR-18 dye, respectively.
KF = Freundlich constant.
1/n = surface heterogeneity
Value of 1/n indicates the type of adsorption of AR 18 on PCMP surface.
1/n<1 = Favourable adsorption
1/n>1 = Cooperative adsorption.
Values obtained from the graph are helpful in identifying the type of adsorption of AR 18 molecules on PCMP (Table 1) (Figure 3b). In this study, 1/n= 0.46, indicating a heterogeneous adsorption surface and a favourable adsorption process.8,14
Temkin isotherm
The Temkin isotherm model characterizes adsorption on non-uniform surfaces, assuming that the heat of adsorption diminishes as surface coverage increases. It accounts for interactions between adsorbate molecules and PCPM using equation (6).

In equation (6), B and A are constants, with A representing the equilibrium binding constant. The constant B can be calculated from the ratio R(Ideal gas constant)×T(Temperature)/b (Temkin constant).
Values obtained from the graph were helpful in identifying the type of adsorption of AR 18 on PCMP (Table 1) (Figure 3c). The value of b, 232.28 J/mol, confirmed physical adsorption of AR 18 on PCMP.7,14
Table 1: Isotherms models
|
Adsor-bent |
Models | |||||||||
| Langmuir
|
Freundlich | Temkin | ||||||||
| qmax (mg/g)
|
R2 | KL (L/g) | n | R2 | KF | A | B | R2 |
b |
|
|
PCMP |
47.61 | 0.998 | 0.058 | 2.14 | 0.958 | 5.77 | 0.511 | 10.84 | 0.994 |
232.28 |
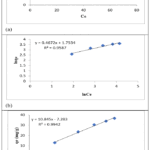 |
Figure 3: (a) Langmuir, (b) Freundlich, (c) Temkin models for mitigation of AR18 dye on PCMP. Click here to View Figure |
Statistical analysis
RSM was utilized as a statistical tool for analyzing the optimal conditions for mitigation of AR18 from the solution using PCMP adsorbent. Interaction of applied parameters in terms of output response was analysed by BBD and CCD techniques.21-23 The effects of applied parameters namely AR18 concentration, dose, pH and time, on the equilibrium concentration of the AR 18 were evaluated using RSM (Design-Expert® 7.0 (Stat-Ease Inc., Minneapolis, USA)). The output response (Y) in terms of the equilibrium concentration of the AR 18 was achieved by the interaction of pH (A), AR 18 concentration (B), contact time (C), and PCMP dose (D). The analysis of these factors, along with their interactions, was carried out using both BBD and CCD to determine the optimal adsorption conditions (Table 2). Experimental and predicted results for AR-18 adsorption are summarized in Tables 3 and 4.
Table 2: Real and coded values for optimization using BBD and CCD
|
BBD |
Factor | Variable | Unit | Min. | Mid | Max. | – |
| A | pH | – | 3 | 6 | 9 |
– |
|
|
B |
AR-18 dye concentration | mg/L | 20 | 60 | 100 | – | |
| C | Time | Minutes | 20 | 100 | 180 |
– |
|
|
D |
Dose | g/L | 0.03 | 0.075 | 0.12 | – | |
| CCD | Factor | Variable | Unit | (-alpha) | (+alpha) | (-1 level) |
(+1 level) |
|
A |
pH | – | 3 | 9 | 4.5 | 7.5 | |
| B | AR-18 dye concentration | mg/L | 10 | 130 | 40 |
100 |
|
|
C |
Time | Minutes | 10 | 130 | 40 | 100 | |
| D | Dose | g/L | 0.03 | 0.12 | 0.0525 |
0.0975 |
Table 3: Real and predicted values of Qe at various variables using BBD
|
pH |
AR-18 conc. (mg/L) | Time (minutes) | Dose (g/L) | Real Qe | Predicted Qe |
| 3 | 20 | 100 | 0.075 | 12.6 |
13.3625 |
|
9 |
20 | 100 | 0.075 | 9.9 | 8.4625 |
| 3 | 100 | 100 | 0.075 | 35.2 |
35.6125 |
|
9 |
100 | 100 | 0.075 | 33.8 | 32.0125 |
| 6 | 60 | 20 | 0.03 | 26.3 |
25.27917 |
|
6 |
60 | 180 | 0.03 | 28.4 | 28.24583 |
| 6 | 60 | 20 | 0.12 | 27.6 |
26.72917 |
|
6 |
60 | 180 | 0.12 | 32.1 | 32.09583 |
| 3 | 60 | 100 | 0.03 | 29.7 |
28.95 |
|
9 |
60 | 100 | 0.03 | 24.7 | 25.6 |
| 3 | 60 | 100 | 0.12 | 33.6 |
32.5 |
|
9 |
60 | 100 | 0.12 | 26.8 | 27.35 |
| 6 | 20 | 20 | 0.075 | 9.5 |
9.416667 |
|
6 |
100 | 20 | 0.075 | 30.2 | 30.11667 |
| 6 | 20 | 180 | 0.075 | 11.5 |
11.38333 |
|
6 |
100 | 180 | 0.075 | 36.6 | 36.48333 |
| 3 | 60 | 20 | 0.075 | 25.3 |
26.05417 |
|
9 |
60 | 20 | 0.075 | 21.4 | 22.70417 |
| 3 | 60 | 180 | 0.075 | 31.2 |
31.12083 |
|
9 |
60 | 180 | 0.075 | 25.5 | 25.97083 |
| 6 | 20 | 100 | 0.03 | 10.1 |
10.4375 |
|
6 |
100 | 100 | 0.03 | 34.2 | 34.8875 |
| 6 | 20 | 100 | 0.12 | 14.1 |
14.6375 |
|
6 |
100 | 100 | 0.12 | 35.1 | 35.9875 |
| 6 | 60 | 100 | 0.075 | 30.6 |
30.6 |
|
6 |
60 | 100 | 0.075 | 30.6 | 30.6 |
| 6 | 60 | 100 | 0.075 | 30.6 |
30.6 |
|
6 |
60 | 100 | 0.075 | 30.6 | 30.6 |
| 6 | 60 | 100 | 0.075 | 30.6 |
30.6 |
Table 4: Real and predicted values of Qe at various variables using CCD
|
pH |
AR-18 conc. (mg/L) | Time (minutes) | Dose (g/L) | Real Qe | Predicted Qe |
| 4.5 | 40 | 40 | 0.0525 | 15.3 |
16.34167 |
|
7.5 |
40 | 40 | 0.0525 | 18.8 | 17.34167 |
| 4.5 | 100 | 40 | 0.0525 | 24.1 |
25.05833 |
|
7.5 |
100 | 40 | 0.0525 | 23.6 | 23.60833 |
| 4.5 | 40 | 100 | 0.0525 | 20.2 |
22.10833 |
|
7.5 |
40 | 100 | 0.0525 | 19.4 | 20.35833 |
| 4.5 | 100 | 100 | 0.0525 | 35.1 |
35.925 |
|
7.5 |
100 | 100 | 0.0525 | 32.7 | 31.725 |
| 4.5 | 40 | 40 | 0.0975 | 17.7 |
19.69167 |
|
7.5 |
40 | 40 | 0.0975 | 21.9 | 21.69167 |
| 4.5 | 100 | 40 | 0.0975 | 28.8 |
28.45833 |
|
7.5 |
100 | 40 | 0.0975 | 28.9 | 28.00833 |
| 4.5 | 40 | 100 | 0.0975 | 23.1 |
23.70833 |
|
7.5 |
40 | 100 | 0.0975 | 22.9 | 22.95833 |
| 4.5 | 100 | 100 | 0.0975 | 35.1 |
37.575 |
|
7.5 |
100 | 100 | 0.0975 | 34.8 | 34.375 |
| 3 | 70 | 70 | 0.075 | 34.6 |
30.68333 |
|
9 |
70 | 70 | 0.075 | 26.2 | 28.48333 |
| 6 | 10 | 70 | 0.075 | 4.1 |
2.466667 |
|
6 |
130 | 70 | 0.075 | 22.6 | 22.6 |
| 6 | 70 | 10 | 0.075 | 21.5 |
21.76667 |
|
6 |
70 | 130 | 0.075 | 35.8 | 33.9 |
| 6 | 70 | 70 | 0.03 | 30.1 |
29.28333 |
|
6 |
70 | 70 | 0.12 | 36.1 | 35.28333 |
| 6 | 70 | 70 | 0.075 | 34.3 |
34.3 |
|
6 |
70 | 70 | 0.075 | 34.3 | 34.3 |
| 6 | 70 | 70 | 0.075 | 34.3 |
34.3 |
|
6 |
70 | 70 | 0.075 | 34.3 | 34.3 |
| 6 | 70 | 70 | 0.075 | 34.3 |
34.3 |
|
6 |
70 | 70 | 0.075 | 34.3 |
34.3 |
The equilibrium adsorption behaviour of AR-18 dye onto PCMP was effectively described using second-order polynomial models derived from the BBD and CCD. The mathematical expressions generated by these models quantify the influence of independent variables—pH (A), concentration of dye (B), contact time (C), and adsorbent dose (D)—on the adsorption capacity (Qe).
For the BBD model, the regression equation is:
Qe=30.6-2.125A+11.45B+2.083333C+1.325D+0.325AB-0.45AC-0.45AD+1.1BC-0.775+0.6CD-1.8125A2-6.425B2-2.325C2-0.1875D2 (7)
For the CCD model, the corresponding equation is:
Qe=34.3-0.55A+5.033333B+3.033333C+1.5D-0.6125AB-0.6875AC+0.25AD+1.275BC+0.0125BD-0.4375CD-1.17917A2-5.44167B2-1.61667C2-0.50417D2 (8)
These models elucidate how each factor and their interactions contribute to the dye removal efficiency. Model adequacy was assessed through analysis of variance (ANOVA), which revealed high F-values (133.99 for BBD and 37.87 for CCD) and low p-values (p < 0.0001), confirming the SS (statistical significance) of the models. Additional model validation metrics, including the sum of squares and sequential model summary (Tables 5 and 6), further support the robustness of these polynomial models.7,18,19,21
The goodness-of-fit was evaluated using R2, which explores the proportion of inconsistency in the response. The BBD and CCD models demonstrated strong correlations, with R2 values of 0.992 and 0.972, respectively, indicating excellent model performance. Furthermore, the R2 values (predicted) (0.957 for BBD and 0.841 for CCD) matched closely with the R2 values (adjusted) (0.985 for BBD and 0.946 for CCD), suggesting consistency between predicted and observed responses (Table 7).7,20,21
Key terms such as A, B, C, D, and their interaction and quadratic forms (e.g., AB, AC, A²) were integral to modelling the behaviour of the system using BBD and CCD frameworks. The S/N, quantified through the “Adeq Precision” metric, was well above the recommended threshold of 4.0, recording values of 37.73 for BBD and 27.15 for CCD, demonstrating that the models are sufficiently robust and suitable for reliable navigation of the design space.
Finally, the reliability and precision of the models were assessed using the coefficient of variation (CV), with values of 3.94% for BBD and 6.69% for CCD. Since both values are below the 10% threshold, the models are considered highly accurate and dependable for predicting adsorption performance.21,24,25
Table 5: ANOVA results for PCMP using BBD
|
Source |
df | SOS | MS | F value | p-value
Prob > F |
| Model | 1999.768 | 14 | 142.8406 | 133.9953 |
< 0.0001 |
|
A-pH |
54.1875 | 1 | 54.1875 | 50.83198 | < 0.0001 |
| B-Initial AR-18 Conc. | 1573.23 | 1 | 1573.23 | 1475.809 |
< 0.0001 |
|
C-Contact Time |
52.08333 | 1 | 52.08333 | 48.85812 | < 0.0001 |
| D-Adsorbent Dose | 21.0675 | 1 | 21.0675 | 19.76291 |
0.0006 |
|
AB |
0.4225 | 1 | 0.4225 | 0.396337 | 0.5391 |
| AC | 0.81 | 1 | 0.81 | 0.759841 |
0.3981 |
|
AD |
0.81 | 1 | 0.81 | 0.759841 | 0.3981 |
| BC | 4.84 | 1 | 4.84 | 4.540287 |
0.0513 |
|
BD |
2.4025 | 1 | 2.4025 | 2.253727 | 0.1555 |
| CD | 1.44 | 1 | 1.44 | 1.350829 |
0.2646 |
|
A2 |
21.30912 | 1 | 21.30912 | 19.98957 | 0.0005 |
| B2 | 267.7662 | 1 | 267.7662 | 251.185 |
< 0.0001 |
|
C2 |
35.06351 | 1 | 35.06351 | 32.89223 | < 0.0001 |
| D2 | 0.228041 | 1 | 0.228041 | 0.213919 |
0.6508 |
|
Residual |
14.92417 | 14 | 1.066012 | – | – |
| Lack of Fit | 14.92417 | 10 | 1.492417 | – |
– |
|
Cor Total |
2014.692 | 28 | – | – |
– |
Table 6: ANOVA results for PCMP using CCD
|
Source |
df | SOS | MS | F value | p-value
Prob > F |
| Model | 1773.059 | 14 | 126.647 | 37.87292 |
< 0.0001 |
|
A-pH |
7.26 | 1 | 7.26 | 2.171053 | 0.1613 |
| B-Initial AR-18 Concentration | 608.0267 | 1 | 608.0267 | 181.8262 |
< 0.0001 |
|
C-Contact Time |
220.8267 | 1 | 220.8267 | 66.03668 | < 0.0001 |
| D-Adsorbent Dose | 54 | 1 | 54 | 16.14833 |
0.0011 |
|
AB |
6.0025 | 1 | 6.0025 | 1.795006 | 0.2003 |
| AC | 7.5625 | 1 | 7.5625 | 2.261513 |
0.1534 |
|
AD |
1 | 1 | 1 | 0.299043 | 0.5925 |
| BC | 26.01 | 1 | 26.01 | 7.77811 |
0.0138 |
|
BD |
0.0025 | 1 | 0.0025 | 0.000748 | 0.9785 |
| CD | 3.0625 | 1 | 3.0625 | 0.915819 |
0.3537 |
|
A2 |
38.13762 | 1 | 38.13762 | 11.40479 | 0.0041 |
| B2 | 812.2076 | 1 | 812.2076 | 242.8851 |
< 0.0001 |
|
C2 |
71.68762 | 1 | 71.68762 | 21.43769 | 0.0003 |
| D2 | 6.971905 | 1 | 6.971905 | 2.0849 |
0.1693 |
|
Residual |
50.16 | 15 | 3.344 | – |
– |
|
Lack of Fit |
50.16 | 10 | 5.016 | – | – |
| Cor Total | 1823.219 | 29 | – | – |
– |
Table 7: Model summary statistics using BBD and CCD
|
BBD |
PCMP | |||
| Standard deviation | 1.032479 | R2 |
0.992592 |
|
| Mean | 26.15172 | R2 (Adjusted) |
0.985185 |
|
|
C.V. % |
3.948032 | R2 (Predicted) | 0.957332 | |
| PRESS | 85.9632 | Adequate Precision |
37.73579 |
|
|
CCD |
Standard deviation |
1.828661 | R2 | 0.972488 |
| Mean | 27.30667 | R2 (Adjusted) |
0.946811 |
|
|
C.V. % |
6.696756 | R2 (Predicted) | 0.841532 | |
| PRESS | 288.9216 | Adequate Precision |
27.15139 |
|
To better understand the interactive influence of operational variables on the adsorption of AR18 dye, three-dimensional (3D) surface plots were generated. These response surfaces provided a visual representation of how two independent variables simultaneously affect the adsorption capacity at other constant variables. This graphical method was particularly useful for identifying trends, assessing interactions, and pinpointing the optimal conditions for maximum dye removal.
In this study, four factors pH (A), dye conc. (B), time (C), and adsorbent dose (D) were analyzed using 3D response surface plots constructed from both the BBD and CCD experimental matrices.
Figures 4 (a–f) illustrate the BBD-based surface plots depicting the combined effects of variable pairs on AR18 adsorption onto PCMP, with the remaining variables held constant. For instance, Figure 4(a) shows the influence of pH and time on AR18 uptake, where the initial AR 18 concentration and adsorbent dose were fixed at 89.95 mg/L and 0.12 g/L, respectively. Subsequent figures 4(b) through 2(f) depict various two-factor interactions: dye concentration vs. pH, pH vs. PCMP dose, dye concentration vs. contact time, PCMP dose vs. dye concentration, and PCMP dose vs. contact time. Each plot provides insight into how the adsorption behaviour shifts in response to changes in the selected variable pair.
Similarly, Figures 5(a–f) present the CCD-based response surfaces, offering a complementary perspective on factor interactions. In Figure 3(a), the interactive effect of pH and time on dye removal is visualized, while the initial concentration (84.78 mg/L) and PCMP dose (0.07 g/L) are held constant. Figures 5(b–f) continue this analysis across different combinations of variables, allowing a comprehensive understanding of how variations in these factors influence adsorption efficiency.
These visual models not only reinforce the statistical findings but also serve as practical tools for identifying the most effective operational settings for AR18 dye removal using PCMP.
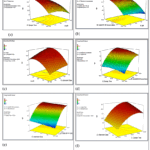 |
Figure 4: BBD, 3-dimensional response plots of adsorption of AR18 (qe) on PCMP vs various variables i.e. (a) Time & pH (b) dye concentration & pH (c) pH & PCMP dose. Click here to View Figure |
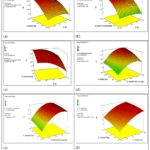 |
Figure 5: CCD, 3-dimensional response plots of adsorption of AR18 (qe) on PCMP vs various variables i.e. (a) Time & pH (b) dye concentration & pH (c) pH & PCMP dose Click here to View Figure |
Diagnostic plots were used to evaluate the statistical adequacy and predictive reliability of the developed models. Figure 6(a–b) presents the diagnostic outputs for the Box-Behnken Design (BBD), while Figure 6(c–d) corresponds to the Central Composite Design (CCD). Specifically, Figure 6(a) illustrates the normal probability graph of residuals for BBD model, and Figure 6(b) compares the predicted versus actual values for AR18 adsorption on PCMP. Similarly, Figure 6(c) and Figure 6(d) depict the same graph for CCD model.
The normal probability plots of residuals for both designs closely resemble a straight line, indicating that normality and constant variance assumptions appear to be adequately fulfilled. Additionally, the predicted versus actual plots show that the data points cluster around the 450 line, indicating strong agreement between observed and model-predicted responses and affirming the validity of the fitted models.
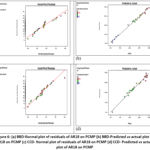 |
Figure 6: (a) BBD-Normal plot of residuals of AR18 on PCMP (b) BBD-Predicted vs actual plot of AR18 on PCMP (c) CCD- Normal plot of residuals of AR18 on PCMP (d) CCD- Predicted vs actual plot of AR18 on PCMP |
To determine the most effective adsorption conditions, a desirability function approach was applied. This multi-response optimization technique identifies the best combination of variables that yields the highest dye removal efficiency. For the BBD model, the optimal settings for maximum equilibrium AR18 adsorption (Qe=38.18 mg/g) were found at AR18 concentration of 89.95 mg/L, pH 4.19, contact time of 142.38 minutes, and PCMP dose of 0.12 g/L. In contrast, the CCD model predicted a Qe = 37.63 mg/g, at AR18 concentration of 84.78 mg/L, pH 5.14, contact time of 98.77 minutes, and an PCMP dose of 0.07 g/L (Figure 7a and 7b).
These findings confirm that both design models can effectively predict optimal conditions for AR18 dye removal using PCMP, with minor variations in the precise parameter values.21,22
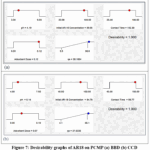 |
Figure 7: Desirability graphs of AR18 on PCMP (a) BBD (b) CCD Click here to View Figure |
In the present study, the adsorption capacity predicted by both Box–Behnken Design (BBD) and Central Composite Design (CCD) models indicates improved performance of PCMP relative to many conventional natural adsorbents. The consistency observed between the BBD and CCD models further confirms the reliability and robustness of the statistical optimization approach. The enhanced adsorption behaviour can be attributed to the presence of functional groups such as hydroxyl and carboxyl groups on the PCMP surface, which facilitate strong interactions with anionic dye molecules. Similar adsorption mechanisms involving electrostatic attraction under acidic conditions have been reported in previous studies on biomass-based adsorbents.21,24,25
Conclusion
This study establishes pomegranate carpellary membrane powder (PCMP) as an effective, low-cost, and environmentally sustainable adsorbent to mitigate AR18 dye from water. Monolayer mitigation of AR18 dyes was confirmed by Langmuir model with 47.61 mg/g maximum capacity. Optimization using statistical modelling approaches (BBD and CCD) helped in identifying the most influential parameters and their interactions, significantly improving process efficiency while minimizing chemical usage. Among the two models, BBD demonstrated superior performance with a higher F-value (133.99), stronger model fit (R² = 0.992), and greater equilibrium adsorption capacity (38.18 mg/g), validating its predictive power and robustness. These results support the viability of PCMP as a green alternative for wastewater treatment, particularly in applications targeting synthetic dye removal. Practical implications include the potential application of PCMP in small-scale and industrial wastewater treatment units, especially in regions where pomegranate waste is abundantly available, thus promoting waste valorisation. Moreover, the statistical approach adopted in this study can serve as a guideline for optimizing other bio-sorbents under varied operational conditions. Additionally, exploring surface modifications or combining PCMP with other natural or nanomaterials could further enhance its adsorption efficiency and selectivity. The regression coefficient (R2) for BBD optimization (0.992) is very closer to the experimental R2 values (0.998) with a high value of F factor (133.99) compared to CCD method (R2 = 0.972) with a low value of F factor (37.87) indicated the best optimization method for removal of AR18 dye from water using PCMP adsorbent. These optimizations will be used for the prediction of removal of AR18 and other contaminates from different real scenario conditions.
Funding Sources
The author(s) received no financial support for the research, authorship, and/or publication of this article.
Conflict of Interest
The author(s) do not have any conflict of interest.
Data Availability Statement
This statement does not apply to this article.
Ethics Statement
This research did not involve human participants, animal subjects, or any material that requires ethical approval.
References
- Al-Tohamy, R., Ali, S.S., Li, F., Okasha, K.M., Mahmoud, Y.A.G., Elsamahy, T., Jiao, H., Fu, Y. and Sun, J., 2022. A critical review on the treatment of dye-containing wastewater: Ecotoxicological and health concerns of textile dyes and possible remediation approaches for environmental safety. Ecotoxicology and environmental safety, 231, p.113160.
CrossRef - Benkhaya, S., M’rabet, S. and El Harfi, A., 2020. Classifications, properties, recent synthesis and applications of azo dyes. Heliyon, 6(1).
CrossRef - Aragaw, T.A. and Bogale, F.M., 2021. Biomass-based adsorbents for removal of dyes from wastewater: a review. Frontiers in Environmental Science, 9, p.764958.
CrossRef - Bulgariu, L., Escudero, L.B., Bello, O.S., Iqbal, M., Nisar, J., Adegoke, K.A., Alakhras, F., Kornaros, M. and Anastopoulos, I., 2019. The utilization of leaf-based adsorbents for dyes removal: A review. Journal of Molecular Liquids, 276, pp.728-747.
CrossRef - Halepoto, H., Gong, T. and Memon, H., 2022. Current status and research trends of textile wastewater treatments—A bibliometric-based study. Frontiers in Environmental Science, 10, p.1042256.
CrossRef - Deshmukh, K.K., 2013. Impact of human activities on the quality of groundwater from Sangamner area, Ahmednagar district, Maharashtra, India. International Research Journal of Environmental Sciences, 2(8), pp. 66-74.
- Nayyar, M., Kumar, R. and Chawla, J., 2022. Development and characterization of N-substituted derivative of 2-sulfanylacetamide on Phyllanthus emblica seed coat as novel adsorbent for remediation of As (III) from water. Water Practice & Technology, 17(8), pp.1742-1757.
CrossRef - Saini, S., Chawla, J., Kumar, R. and Kaur, I., 2020. Use of Pavo Cristatus (Peacock) Feather Powder as Adsorbent for removal of Cadmium Ions from Aqueous Solution. Journal of Water Chemistry and Technology, 42, pp.101-111.
CrossRef - Alhujaily, A., Yu, H., Zhang, X. and Ma, F., 2020. Adsorptive removal of anionic dyes from aqueous solutions using spent mushroom waste. Applied Water Science, 10(7), pp.1-12.
CrossRef - Chikri, R., Elhadiri, N., Benchanaa, M. and El Maguana, Y., 2020. Efficiency of sawdust as low‐cost adsorbent for dyes removal. Journal of Chemistry, 2020(1), p.8813420.
CrossRef - Saini, S., Kumar, R., Chawla, J. and Kaur, I., 2019. Adsorption of bivalent lead ions from an aqueous phase system: Equilibrium, thermodynamic, kinetics, and optimization studies. Water Environment Research, 91(12), pp.1692-1704.
CrossRef - Arslan, C., Hasnain, M. and Tariq, W., 2021. Effective Removal Of Textile Dyes Using Pre-Treated Natural Adsorbents. Environmental Contaminants Reviews (ECR), 4(1), pp.19-23.
CrossRef - Vara, D., Jha, S., Bisht, S., Shahabuddin, S., Gaur, R., Suhas and Tyagi, I., 2024. Sustainable bio-based adsorbents for simultaneous and efficient removal of hazardous dyes from aqueous solutions. Toxics, 12(4), p.266.
CrossRef - Chaleshtori, A.N., Meghadddam, F.M., Sadeghi, M., Rahimi, R., Hemati, S. and Ahmadi, A., 2017. Removal of Acid Red 18 (Azo-Dye) from aqueous solution by adsorption onto activated charcoal prepared from almond shell. Journal of Environmental Science and Management, 20(2).
CrossRef - Zhang J., Liu F., Gao J., Chen Y., Hao X. 2017. Ordered mesoporous TiO2/activated carbon for adsorption and photocatalysis of acid red 18 solution. Bioresources. 12: 9086–9102.
CrossRef - Ferreira, S.C., Bruns, R.E., Ferreira, H.S., Matos, G.D., David, J.M., Brandão, G.C., da Silva, E.P., Portugal, L.A., Dos Reis, P.S., Souza, A.S. and Dos Santos, W.N.L., 2007. Box-Behnken design: An alternative for the optimization of analytical methods. Analytica chimica acta, 597(2), pp.179-186.
CrossRef - Montgomery, D.C., 2017. Design and analysis of experiments. John wiley & sons.
- Ahmad, M.A., Afandi, N.S. and Bello, O.S., 2017. Optimization of process variables by response surface methodology for malachite green dye removal using lime peel activated carbon. Applied Water Science, 7, pp.717-727.
CrossRef - Bayuo, J., Abukari, M.A. and Pelig-Ba, K.B., 2020. Optimization using central composite design (CCD) of response surface methodology (RSM) for biosorption of hexavalent chromium from aqueous media. Applied Water Science, 10(6), pp.1-12.
CrossRef - Reji, M., & Kumar, R. 2022. Response surface methodology (RSM): An overview to analyze multivariate data. Indian J. Microbiol. Res, 9, 241-248.
CrossRef - Kumar, R., Chawla, J., and Nayyar, M., 2023. Statistical analysis for remediation of As(III) ions from water using pristine and derivatized Phyllanthus emblica seed coat. Water Practice & Technology, 18(11), pp. 2760-2774
CrossRef - El-taweel, R.M., Mohamed, N., Alrefaey, K.A., Husien, S., Abdel-Aziz, A.B., Salim, A.I., Mostafa, N.G., Said, L.A., Fahim, I.S. and Radwan, A.G., 2023. A review of coagulation explaining its definition, mechanism, coagulant types, and optimization models; RSM, and ANN. Current Research in Green and Sustainable Chemistry, pp.100358.
CrossRef - Ngabea, S.A., 2022. Impact of process strictures on the composition and sorption isotherms of Bambara nut flour using RSM. UNIZIK Journal of Engineering and Applied Sciences, 20(1), pp.775-788.
- Regti, A., Laamari, M.R., Stiriba, S.E. and El Haddad, M., 2017. Use of response factorial design for process optimization of basic dye adsorption onto activated carbon derived from Persea species. Microchemical Journal, 130, pp.129-136.
CrossRef - Foo, K. Y., and Hameed, B. H., 2010. Insights into the modeling of adsorption isotherm systems. Chemical engineering journal, 156(1), pp. 2-10.
CrossRef
Accepted on: 10 Apr 2026
Second Review by: Dr. Manisha Rathore
Final Approval by: Dr. Tawkir Sheikh


ISSN Online: 2231-5039