Assessment of Proximate Nutritional Composition and Quality Attributes of Commercial Poultry Feeds in Chattogram, Bangladesh
 , Sharmin Jamal1, Muhammad Abu Bakar3and Suman Barua1*
1Department of Applied Chemistry and Chemical Engineering, University of Chittagong, Chattogram, Bangladesh
2Agarwood Research Laboratory, Bangladesh Forest Research Institute (BFRI), Chattogram, Bangladesh
3Bangladesh Council of Scientific and Industrial Research (BCSIR) Laboratories, Chattogram, Bangladesh
Corresponding Author’s E-mail: sumanjoara@cu.ac.bd
Download this article as:
ABSTRACT:Poultry farming plays a crucial role in agriculture, impacting both nutrition and the economy of a country. Since the quality of poultry products directly affects the consumer’s health, regular assessment of commercial feeds is essential for both product safety and poultry health. Proximate analysis offers a convenient method to assess feed quality without harming poultry birds. This study examined total 15 feed samples of three categories i.e., starter, grower, and house feed available in Chattogram, Bangladesh. The sample were analyzed for moisture, ash, crude protein, crude fat, carbohydrates, metabolizable energy, minerals, and potential toxic metals such as Cr, Cd, Pb with results compared against international standards. Moisture content met recommended guidelines, not exceeding 12%, and ash content ranged from 4.20% to 10.87%. Crude protein levels varied between 8.05% and 28.18%, averaging 18.38%, with few discrepancies with international guidelines. Crude fat (2.75%–6.39%) and carbohydrates (50.08%–67.74%) were found to be satisfactory. Minerals and heavy metals were mostly within recommended levels, with one sample showing 0.52 mg/kg of Cd, while Cr and Pb were below detection limit. The results indicate the overall nutritional proficiency of commercial poultry feeds though stricter guidelines are recommended for better compliance with international regulations.
KEYWORDS:Crude protein; Heavy metals; Minerals; Poultry feed; Proximate analysis
Introduction
Poultry farming is one of the prominent sectors in agriculture. The quality of poultry products such as eggs, meats etc. heavily depends on the quality of the feed. The feed primarily consists of grains such as, corn, maze, wheat, cake meal, sunflower seed, and protein products such as, fish meal, meat and bone meal.1 In Bangladesh, raw materials for feed production are not adequate, and approximately 80% of feed ingredients are imported from other countries. Moreover, most of the feed additives including vitamins, vitamin-mineral premixes, mold inhibitors, organic acids, probiotics etc. are also imported which increase the overall production costs. As a result, feed millers in Bangladesh tend to reduce the cost either by adulterating with low standard ingredients or by subtracting important ingredients such as vitamin-mineral premix, soybean meal, maize, meat and bone meal.2
However, nutritional balance in poultry feed is a crucial factor as it is directly associated with the bird’s health. Any imbalances can possess discrepancies in overall poultry production.3 Deficiency of essential metals can retard bird’s growth, shortening and thickening of leg bones, poor feathering, anorexia, and mortality.4, 5 Feed additive residues may cause detrimental effects on consumers of poultry meat. Also, nutritional imbalances particularly in protein, energy, and mineral levels may reduce growth rate, poor feed conversion, increased fat deposition, poor egg shell quality.6, 7 The balance between energy and protein is also an important factor as birds may use protein for energy rather than growth, if the amount of energy is too low compared to protein.8 In Bangladesh, there is also a concern that feed manufacturers are using tannery trimmings as a low-cost source of meat and bone meal. Consequently, people may face health complexity due to exposure to organic and inorganic pollutants through consumption of poultry products.
To assess the feed quality proximate analysis is an important tool.9, 10 It provides ease of assessing different parameters without hurting birds’ health. The determination of crude protein, fat, carbohydrates, moisture, ash, and energy helps defining the nutritional value and safety of the feed samples.11 Thus, it is a fundamental approach to evaluate feeds, ensuring poultry birds receive adequate nutrition for optimal growth.
In addition to proximate composition, mineral content is also very crucial for feed quality evaluation. Calcium and phosphorus are essential to build poultry skeletal as well as egg shell, while sodium and potassium are required to maintain physiological pH.12 Iron, copper, manganese, and zinc are responsible for optimal growth.13 Zinc deficiency leads to low feed intake and, consequently, low growth rate of birds [14]. Moreover, three heavy metals were investigated in this study as the scenario of these metal’s concentration is still obscure in Bangladeshi poultry feeds. Cadmium can lead to kidney failure, bone damage, prostate cancer and genetic mutations.15 Additionally, chromium, nickel, and lead have detrimental effects on human health.16
Therefore, it is very crucial to have a comprehensive understanding of the nutritional quality of feeds, as it is directly associated with the animal’s health and overall feed efficiency. In this study, we have examined three types of feed namely, poultry starter feed (PSF), poultry grower feed (PGF), and poultry house feed (PHF). Poultry house feed is relatively a new commercial name given by the local feed manufacturers, and it is mainly used by local chicken vendors at consumer’s level. The proximate estimation of poultry house feeds in Bangladesh has been rarely been depicted in any study. This study gives an overview of current nutritional profiles of commercially available feeds in Chattogram, Bangladesh and compared the quality with international regulations.
Materials and Methods
Sampling Location
The study was carried out in the port city and second largest city of Bangladesh, Chattogram (previously Chittagong) in the south-eastern part of the country. Geographically, it serves as a crucial link between South and Southeast Asia. The city’s position at the intersection of land, sea, and ecological areas makes it an engrossing subject for interdisciplinary research. Feed samples were collected from five locations viz., Aturar Depo, Aman Bazar, Bara Dighir Par, Bahaddarhat, and Fotehabad shown in Figure 1. Being in the city area, these places were selected as there is a greater consumption of feeds by poultry farming.
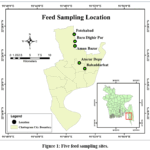 |
Figure 1: Five feed sampling sites. |
Sampling and Analysis
Three feed samples of three different types i.e., poultry starter feed, poultry grower feed, and poultry house feed were collected from each location, and there was a total of 15 samples. The feeds were labelled as PSF-01 to PSF-05 for poultry starter feed, PGF-06 to PGF-10 for poultry grower feed, and PHF-11 to PHF-15 for poultry house feed. The samples used in this study were collected directly from the dealers or retailers. They were taken in air-tight zipper bags immediately after collecting, properly labelled, and preserved in cold and moisture-free environment. The study was carried out at the laboratory in the University of Chittagong, Bangladesh and the Phytochemistry Research Division, BCSIR, Chattogram-4220. All reagents used in the study were of analytical grade, and they were used without further purification. OriginPro 2024 and ArcGIS 10.8 were used for graphical plotting and statistical analysis.
Moisture Content (MC)
Moisture content was determined by using hot air oven process [17]. About 2 g of feed was taken into a crucible and heated at 105℃ till a constant weight. The sample was weighed before and after heating. Finally, moisture content was measured using following formula,
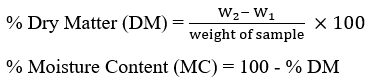
Where, W2 = Dry sample weight with crucible, and W1 = Empty crucible weight.
Ash Content (AC)
About 5 g of dried sample was taken in a crucible which was previously cleaned and weighed. After that, the crucible was subjected to muffle furnace and was heated constantly at 550℃ until white ash was obtained. Finally, the crucible was kept in a desiccator to cool and then weighed [18]. The following formula was used to calculate the percentage of ash on feed,

Where, W2 = Weight of ash and crucible, and W1 = Empty crucible weight.
Crude Protein (CP)
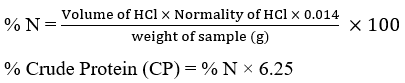
The micro Kjeldahl method was used for the determination of crude protein. First, the sample was digested using concentrated H2SO4 alongside a digestion mixture containing K2SO4 and CuSO4. After that, the mixture was made alkaline with 40% NaOH, and the ammonia released was trapped in 4% boric acid. It was then titrated against standard HCl solution for the estimation of nitrogen. The amount of nitrogen percentage was multiplied by protein conversion factor i.e., 6.25 to obtain crude protein content.
Crude Fat (CF)
Crude fat content was measured by Soxhlet extraction method given by the AOAC (2005).19 About 4 g of finely ground sample was taken in a cellulose thimble which was placed in a round bottom flask with 250 mL n-hexane. After that, the flask was connected to the Soxhlet extractor. The extraction process was continued for 6 hours to complete multiple cycles. Finally, the flask was removed from the apparatus, cooled, and weighed to calculate crude fat.

Carbohydrates (CH)
Carbohydrates of poultry feed sample was calculated by subtracting crude protein, crude fat, moisture, and ash from 100%. It was calculated using following formula.20, 21
% Carbohydrates (CH) = 100 – (% CP + % CF + % MC + % AC)
This indirect method of carbohydrates determination assumes that all the remaining mass in the feed sample after accounting for crude protein, crude fat, moisture, and ash is carbohydrates.11
Metabolizable Energy (ME)
The metabolizable energy (ME) of feed sample was calculated by crude protein, crude fat, and carbohydrates using the following equation [22].
ME (kcal/kg) = 32.959 [% CP + (% CF × 2.25) + % CH] – 29.20
Preparation of Sample for Metal Determination
Metal concentration was measured using Atomic Absorption Spectroscopy, iCE 3300, Thermo Scientific, UK. Approximately 5–10 g of the samples were first accurately weighed and taken in tared silica dish and dried in the laboratory oven at 120℃.23 The dish was then placed in a muffle furnace, and sample was ignited for at least 8 hours at 450℃. The sediment sample was digested using 50% nitric acid with mild heat. After that, the sample was filtered using Whatman No. 44 filter paper and taken in a 50 mL volumetric flask and diluted to 50 mL with distilled water. Freshly prepared standard solutions were used for plotting the calibration curves. The elemental concentrations were measured by comparing AAS reading with the corresponding standard curve. A blank experiment was also performed to verify the discrepancies in the measurement.24
Determination of Phosphorus
Phosphorus content of feed samples was determined by vanadium phosphomolybdate colorimetric method. This method is based on a reaction with the vanadate-molybdate reagent that produces a yellow-orange complex in the presence of orthophosphate, and the reaction is called Mission’s reaction.24 About 5 g of feed sample was burned in a muffle furnace. The resulting ash was then transferred to a beaker, where 20 mL of distilled water, 5 mL of concentrated HNO3 and 12 mL of concentrated HCl were added. This mixture was filtered and transferred to a 250 mL volumetric flask and the volume was made up to the mark with distilled water. Next, 25 mL of that diluted solution was transferred to a 100 mL volumetric flask and 25 mL of vanadomolybdate reagent was added. It was immediately diluted to the volume of 100 mL with distilled water. In a similar way, 25 mL of standard phosphate solution was taken into another 100 mL volumetric flask with 25 mL of the same reagent. The mixture was also diluted to 100 mL. The optical density of each solution was measured at 420 nm in 1 cm cell, 10 minutes after making the dilution. The amount of phosphorus was then estimated from the difference in extinctions between the two yellow solutions and by reference to the calibration graph.
Results and Discussions
Moisture content, ash content, crude protein, crude fat, and carbohydrates are considered as the key consideration of formulating poultry diets. The requirements for proximate compositions, minerals, and metabolizable energy largely depend on several factors including, bird’s age, genotype, types of feed, environmental temperature, feed ingredients, types of feed, types of formulation, and the presence of interacting nutrients or antinutritional factors [14, 25-27]. The results of proximate composition of all feed samples are shown in Table 1.
Table 1: Proximate composition of commercially available poultry feeds in Chattogram, Bangladesh.
| % Moisture | % Ash | % Crude Protein | % Crude Fat | % Carbohydrates | |||||||||||
| PSF | PGF | PHF | PSF | PGF | PHF | PSF | PGF | PHF | PSF | PGF | PHF | PSF | PGF |
PHF |
|
| 11.11 | 11.51 | 10.93 | 6.11 | 4.20 | 10.75 | 28.18 | 20.13 | 12.08 | 4.52 | 6.39 | 2.75 | 50.08 | 57.76 | 63.49 | |
| 11.19 | 7.02 | 11.23 | 5.46 | 5.14 | 8.49 | 26.16 | 24.15 | 12.08 | 5.05 | 4.53 | 2.92 | 52.13 | 59.17 |
65.29 |
|
| 9.14 | 11.15 | 10.77 | 6.34 | 5.47 | 6.79 | 14.09 | 20.13 | 12.08 | 3.83 | 5.16 | 5.29 | 66.61 | 58.09 | 65.08 | |
| 11.38 | 10.03 | 8.77 | 5.13 | 5.18 | 10.80 | 24.15 | 20.13 | 8.05 | 5.57 | 3.11 | 4.65 | 53.77 | 61.55 |
67.74 |
|
| 9.80 | 12.00 | 8.84 | 5.81 | 5.17 | 10.87 | 24.15 | 18.11 | 12.08 | 4.29 | 6.03 | 3.68 | 55.94 | 58.69 | 64.54 | |
| Min. | 9.14 | 7.02 | 8.77 | 5.13 | 4.20 | 6.79 | 14.09 | 18.11 | 8.05 | 3.83 | 3.11 | 2.75 | 50.08 | 57.76 |
63.49 |
|
Max. |
11.38 | 12.00 | 11.23 | 6.34 | 5.47 | 10.87 | 28.18 | 24.15 | 12.08 | 5.57 | 6.39 | 5.29 | 66.61 | 61.55 | 67.74 |
| Mean | 10.53 | 10.34 | 10.11 | 5.77 | 5.03 | 9.54 | 23.35 | 20.53 | 11.27 | 4.66 | 5.04 | 3.86 | 55.70 | 59.05 |
65.23 |
|
SEM |
0.45 | 0.89 | 0.54 | 0.22 | 0.22 | 0.82 | 2.43 | 0.99 | 0.81 | 0.30 | 0.58 | 0.49 | 2.89 | 0.67 | 0.70 |
| SD | 1.00 | 2.00 | 1.20 | 0.49 | 0.48 | 1.84 | 5.44 | 2.20 | 1.80 | 0.68 | 1.30 | 1.10 | 6.46 | 1.50 |
1.56 |
|
CV |
9.46 | 19.30 | 11.86 | 8.46 | 9.59 | 19.24 | 23.29 | 10.74 | 15.97 | 14.53 | 25.85 | 28.46 | 11.60 | 2.54 |
2.40 |
Moisture Content
The moisture content of feed samples ranged between 7.02% to 12.00% with an average of 10.33%. The average of PSF, PGF, and PHF were 10.53%, 10.34%, and 10.11% respectively. According to the Food and Agriculture Organization (FAO) and the National Research Council (NRC) the moisture content in properly stored poultry feeds should not exceed 12% for optimal quality and nutrient retention. Hossain et el. reported moisture content in both broiler and layer ranged between 9.7–11.2% in Bangladeshi feed samples.2 Higher moisture content could affect the stability and freshness of the feed for the storage over a long period of time.28 Thus, it is advisable to keep the moisture content below permissible limit.
Ash Content
Ash content in feed sample is related to the amount of inorganic minerals. The amount of ash found in each sample is shown in Table 1. Ash content was found as, 5.13–6.34% for starter feed, 4.20–5.47% for grower feed, and 6.79–10.87% for poultry house feed. House feed samples showed higher amount of ash as compared to starter and grower feeds. The higher ash content in feed affects bone and joint problems in growing poultry birds. Moreover, higher ash could lead to kidney diseases.29
Crude Protein
Crude protein (CP) is one of the most important parameters of feed samples. Table 1 shows that the starter samples varied mostly with the minimum of 14.09% and the maximum value of 28.18%. Crude protein of poultry house feeds showed lower values than starter and grower feeds. In this study, the average crude protein content was 23.35%, 20.53%, and 11.27% for starters, grower, and house feed, respectively. According to Vakili et al. starter feeds contain higher amount of crude protein compared to grower and finisher feeds because old birds need less protein.30 Hasan et al. found 14.04 ± 0.03% and 13.89 ± 0.46% CP in two poultry feed samples in Bangladesh. In another study, feeds collected from Gazipur and Mymensingh districts of Bangladesh showed 15.3–19.5% CP in layer feeds and 20–22.5% CP in broiler feeds.2 The minimum recommended CP values are 23% for 0–3 weeks meat chicken, 20% for 3–6 weeks meat chicken, 18% for 6–8 weeks meat chickens, and 15% for laying hens.31 Growth of the birds and feed utilization efficiency are increased when the total crude protein level is raised while the proper ratios of essential amino acids are maintained.32 Thus, crude protein levels should be maintained properly for the optimal growth of poultry birds.
Crude Fat
Animal fats and vegetable oils are typically incorporated into poultry diets due to their high energy density which enhances the growth of poultry birds [33]. Crude fat affects diet palatability, pellet quality, and feed dustiness. Furthermore, fat content improves the absorption of fat soluble vitamins and increases the efficiency of the consumed energy.2 In Table 1, crude fat ranged between 3.83–5.57% for PSF, 3.11–6.39% for PGF, and 2.75–5.29% for PHF. The mean crude fat was 4.66% for PSF, 5.04% for PGF, and 3.86% for PHF. According to one study in Bangladesh, Hossain et al. found 3.6–6.9% crude fat in broiler and layer feed samples [2]. A comparative study of two feed companies in Nigeria was conducted, and the crude fat content was similar in both companies ranging from 5% to 8% [11]. In Bangladesh, the recommended crude fat ranges from 5–7%; however, the majority of samples analyzed in this study exhibited lower values.34
Carbohydrates
Carbohydrates are the primary source of energy in poultry diets.35 In general, PHF contained higher amounts of carbohydrates compared to PSF and PGF. In Table 1, the mean carbohydrates in PSF, PGF, and PHF were 55.70%, 59.05%, and 65.23%, respectively. Poultry starter feeds showed the greatest variability in carbohydrate content whereas the grower samples deviated the least from the mean value. Carbohydrates possesses about 50–70% portion in total diet of poultry feeds.36 According to Ofori et al., the amount of carbohydrates was 54.34–64.44% in starter feeds, 49.82–56.82% in grower feeds, and 52.35–62.75% in layer feeds.37
Quality of Feed According to Mineral Content
The results of mineral content in poultry starters, poultry grower, and poultry house feed are shown in Figure 2. Calcium (Ca) level in poultry diets is very crucial for skeletal development of poultry birds and other functions in broilers.38 It is also vital for a wide range of functions in the body, such as blood clotting, muscle contraction, various enzyme activation, metabolic responses, protein synthesis, and maintaining acid-base balance.39 However, the excessive use of calcium and its potential anti-nutritional effects in commercial broiler diets have received significant attention [38]. In this study, calcium levels ranged between 17126.19 to 112240.57 mg/kg (1.71 to 11.22%), and the house feed showed higher calcium content than starter and grower feeds. The NRC recommended the concentration of calcium as 1.00% for starter, 0.90% for grower, and 0.80% for the finisher feed.40 According to NRC guidelines, starter and grower feeds exceed the recommended level for calcium. However, the standard was set based on the studied carried out in 1960s and 1980s.41, 42, and the modern chickens are different in terms of the growth rate, feed conversion efficiency, and bone characteristics.43, 44 Therefore, the requirements for Ca for the fast-growing chicken might be different.45 For laying hens, Ca is quantitatively the most important mineral because shell formation draws on dietary Ca, intestinal absorption, and medullary bone reserves. Additionally, the requirements for Ca also differ with stage of the production cycle [46]. In rearing pullets, low Ca-P diets can slightly reduce tibia/keel ash (i.e., fall below the level needed for maximum bone mineralization) without harming growth and later may even be associated with better shell quality in laying hen.47
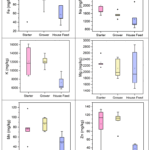 |
Figure 2: Concentration (mg/kg) of various minerals in poultry starter feed, poultry grower feed, and poultry house feed available in Chattogram, Bangladesh. |
Copper (Cu) ranged between 4.09 and 52.85 mg/kg. The average concentration of copper was 19.54 mg/kg for PSF, 18.11 mg/kg for PGF, and 5.09 mg/kg for PHF. Shahriar et al. found that the concentration of copper in poultry feeds collected from Rajshahi city ranged between 2.65 to 45.83 mg/kg.48 In another study, the concentration of copper was ranged between 72.4 to 251.5 mg/kg.49 Copper is widely used in poultry feed formulation as it acts as a critical co-factor and enzyme component for different biological processes.50 The maximum level of copper in the poultry feedstuff should be 25 mg/kg.51 and PSF-02 (52.85 mg/kg) and PGF-08 (32.03 mg/kg) exceeded the maximum permissible limit. High level of copper can have adverse effects on the performance of the birds.52 Sometimes, pharmacological levels (125–250 ppm) are fed for growth promotion and to reduce egg/meat cholesterol. However, most of the ingested Cu (>80–95%) is excreted raising toxicity and environmental concerns.53
Iron (Fe) is another important nutrient for poultry birds. The deficiency in iron can reduce commercial performance. It is also essential for animals as it is related to the synthesis of hemoglobin.54 Excess iron concentration can also be toxic and interact antagonistically with zinc at the intestinal mucosa.14 The PSF and PGF showed comparatively higher levels of Fe than PHF. The maximum Fe concentration was found in PSF-02 (126.25 mg/kg), and the minimum (33.44 mg/kg) was found in PHF-13. The average Fe content found in this study was 84.36 mg/kg. The maximum permissible level set by WHO/FAO for Fe is 180 mg/kg.48 According to this standard, no sample exceeded the WHO/FAO maximum permissible limit. On the other hand, the NRC Fe requirement of ~80 mg/kg based on bird’s growth and hematocrit. The requirement of broilers from 1 to 21 days was estimated at 97–136 mg/kg.55 The Fe levels reported by Chowdhury et al., ranged between 16.477 ± 0.001 and 108.392 ± 0.002 mg/kg which aligns with our study.56 In another study, Islam et al. found 57.3 to 121.9 mg/kg of iron in the poultry feed samples collected from Dhaka, Bangladesh.57
The levels of sodium (Na) ranged between 870.74 and 3167.59 mg/kg in all feed samples. The average Na concentration was 1619.49 mg/kg. On the other hand, potassium (K) was found as 5757.29 to 16142.68 mg/kg. The starter and grower feeds showed higher levels of potassium as compared to poultry house feeds. Na and K are important for dietary electrolytes balance in poultry birds.58 According to Mushtaq et al., the excess of Na level increases the moisture content of excreta of broilers.59
Magnesium (Mg) content ranged from 1476.98 to 2862.71 mg/kg. The average Mg content was 2301.98, 2109.46, and 2109.25 mg/kg for PSF, PGF, and PHF, respectively. Kabir et al. found 1120 to 2543 mg/kg of Mg in poultry feeds.49 The NRC recommended the maximum tolerable limit of Mg is 5000 mg/kg for growing birds and 7500 mg/kg for laying hens.60 On the other hand, the European Union (EU) has set the maximum limit as 3500 mg/kg for poultry feedstuffs and 2500 mg/kg for chicks. Most of the corn-soybean diets contain 1500–1800 mg Mg/kg. Thus, the deficiency of Mg is essentially unheard of under practical feeding, and unnecessary Mg supplementation may even be detrimental to bird’s performance, bone health, and litter quality.14, 61 Mg metabolism is linked to overall dietary electrolyte balance and production of eggs.62 Conversely, the toxicity caused by Mg can lead to skeletal lesions.63-65 Also, the elevated amount of Mg in the feeds may increase the manure and litter moisture.64
The Manganese (Mn) levels were found from 25.52 to 117.55 mg/kg. PHF showed relatively lower Mn content than PSF and PGF. According to the WHO/FAO, the maximum permissible level for Mn in food is 100 mg/kg.48 In this regard, only PSF-02 exceeded the maximum limit. On the other hand, the NRC recommended the Mn level to be 20 mg/kg and 60 mg/kg for laying and broiler birds, respectively.40 However, in practical, the dietary requirement is considered higher than the recommended values.66 Recent reviews conclude that a total dietary Mn of ~90 mg/kg is required to maintain normal development and eggshell quality in modern birds.66 The deficiency in Mn decreases egg production of laying hens and affects egg shell thickness [67]. Shahriar et al., observed the level of Mn between 22.63 and 188.85 mg/kg which aligns with this study.48
Zinc (Zn) is an important nutrient as it can improve the growth of poultry birds, increase endocrine secretion, augment immunity, and enhance antioxidant capacity.68 In this study, the concentration of Zn was found from 30.37 to 133.52 mg/kg. It showed similar trends like Fe and Mn as PHF showed lower levels of Zn compared to PSF and PGF. The average Zn level was 98.36, 106.06, and 38.04 mg/kg for PSF, PGF, and PHF, respectively. According to the NRC, the level of Zn in poultry diets should be in between 40 and 75 mg/kg [69]. Commercially, high supplement of Zn (e.g., 8000–20000 mg/kg) is exploited to induce moulting in laying hens, but it is for pharmacological purposes, not a nutritional requirement.68 The deficiency of dietary Zn may result in loss of appetite, stunted growth, and increased mortality in the flock.70 Kabir et al. showed that the level of Zn in poultry feed samples collected from Chittagong, Bangladesh was between 57.9 and 232.7 mg/kg.49 In another study, Islam et al. found that the concentration of zinc was ranged between 27.7 to 68.4 mg/kg.68
Phosphorus (P) is very crucial, especially for bone development of poultry birds.71 Deficiency in phosphorus level can lead to disruption of physiological processes such as nucleic acid synthesis and energy metabolism.72 In this study, the phosphorus content ranged from 2442.51 mg/kg (PHF-15) to 12100 mg/kg (PGF-08). The average concentration was 6063.55, 8718.53, and 5538.99 mg/kg for PSF, PGF, and PHF, respectively. According to the National Research Council (NRC, 2005) guidelines, the maximum permissible limit of total phosphorus in poultry feed is 8000–10000 mg/kg.60 The requirements of phosphorus also depend on bird’s type and age. In laying hens, available phosphorus can be reduced with age (e.g., from ~0.4% to ~0.2% in later phases) without adverse effects on production. On the other hand, in growing pullets, non-phytate phosphorus (NPP) levels around 0.15–0.2% appear adequate for bone development and growth, indicating the age dependency of phosphorus requirements.46, 47 The deficiency in P level impacts negatively on productive performance in broiler chickens [73]. Growth performance in broiler chickens was linearly reduced from 7 to 21 days of age when phosphorus contents in poultry diets dropped from 3400 to 1300 mg/kg.74 Since, overfeeding of P is costly and contributes to environmental pollution via manure, manufacturers aim to supply P close to requirement rather than with large safety margins.47
Three heavy metals chromium (Cr), cadmium (Cd), and lead (Pb) were analyzed in this study. The study revealed that only one sample (PHF-15) showed 0.52 mg/kg of cadmium and the rest were below detection limit. Imran et al. showed that the cadmium levels in all feed samples ranged between 0.11 to 1.41 mg/kg.75 In another study in Rajshahi, Bangladesh, the maximum concentration of Cd was found 1.6442 mg/kg [48]. The amount of Cd reported by Islam et al., in the branded feed samples was 1.329 ± 0.268 mg/kg, while in the non-branded samples it was 1.328 ± 0.163 mg/kg.76 According to the FAO, the permissible limit for Cd in food is 0.5 mg/kg.77 Thus, PHF-15 showed slightly elevated concentration of Cd than the reference value. Cadmium has the potential to mutate genes, and it can lead to cardiovascular, renal, hepatic, and respiratory irregularities.78, 79
Metabolizable Energy
The estimated metabolizable energy (ME) of feed samples shown in Figure 3 ranged between 2665.18 and 3052.44 kcal/kg. PHF showed lower levels of ME than PSF and PGF. The average ME for PSF, PGF, and PHF were 2921.39, 2967.73, and 2778.07 kcal/kg, respectively. Igwemmar et al. found that the ME values ranging from 3186.34–3524.85 kcal/kg, 2984.78–3523.06 kcal/kg, and 3225.32–3686.18 kcal/kg for starter, grower, and finisher feed rations, respectively [80]. In another study, the mean ME was 3419.98 kcal/kg for broiler starter feed and 3063.72 kcal/kg for grower mash feed.37, 38 The NRC recommended that the average ME for broilers in all stages of growth be 3200 kcal/kg and that for layers be 2900 kcal/kg.40 The adequate level of energy is crucial for nutrient balance and overall growth of the poultry birds. Moreover, ME affects body composition and fat deposition.81 In broiler, increasing dietary energy typically increases weight gain and improve feed conversion, although it depends closely on energy-amino acid interaction. Therefore, energy requirements must be interpreted with dietary amino acid and with production stages. Typically, starter feeds are formulated with moderate energy and high protein, whereas finisher and layer feeds use higher energy and lower protein. Energy is also associated with feed formulation such as, pelleting increases the effective energy value of feeds.26, 27 Hence, precise formulation of poultry diets with appropriate metabolizable energy levels is essential to achieve efficient growth performance and desirable carcass characteristics.
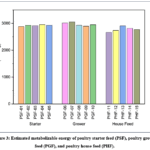 |
Figure 3: Estimated metabolizable energy of poultry starter feed (PSF), poultry grower feed (PGF), and poultry house feed (PHF). |
Pearson Correlation
Pearson correlation analysis was performed to analyze the strength and direction of linear relationships among the proximate composition and minerals of the 15 feed samples (Figure 4). Pearson’s correlation coefficient (r) and two-tailed tests were used to assess statistical significance, with p-value < 0.05 considered as statistically significant. Positive correlations are represented by red circles whereas blue circles indicate negative correlations. The circle size and the intensity of color correspond to the magnitude of the correlation coefficient. As the sample size was relatively low, the significant correlations among the feed variables interpret as statistical associations rather than evidence of nutritional synergy or mineral antagonism.
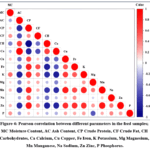 |
Figure 4: Pearson correlation between different parameters in the feed samples; MC Moisture Content, AC Ash Content, CP Crude Protein, CF Crude Fat, CH Carbohydrates,Click here to View Figure |
Moisture content showed no statistically significant relationships with the analyzed proximate or mineral variables (p > 0.05). Ash content of the feed samples observed to be in a strong positive correlation with calcium (r = 0.974, p < 0.0001), indicating the variations in ash content were closely related with calcium concentrations. Several strong and statistically significant associations were observed among the proximate and mineral compositions. Crude protein showed a very strong negative correlation with carbohydrates (r = -0.940, p < 0.0001), while ash content was strongly positively correlated with calcium (r = 0.974, p < 0.0001). Crude protein was also positively correlated with Fe (r = 0.780, p < 0.001), K (r = 0.740, p = 0.002), Mn (r = 0.762, p < 0.001), and Zn (r = 0.846, p < 0.0001), but negatively correlated with Ca (r = -0.768, p < 0.001). These associations may indicate the same formulation processes or similarities in the feed ingredients as protein meal can also contribute to several minerals.82-84 Similarly, carbohydrate content was negatively correlated with Fe (r = -0.799, p < 0.001), K (r = -0.717, p = 0.003), Mn (r = -0.675, p = 0.006), and Zn (r = -0.792, p < 0.001), while showing a positive correlation with Ca (r = 0.640, p = 0.010). The strongest inverse relationship was observed between crude protein and carbohydrates (r = -0.940, p < 0.0001). However, this association cannot be directly interpreted as the evidence of any biological interaction as carbohydrate content was estimated by using other proximate compositions including crude protein.
Among other mineral variables, Mn was strongly positively correlated with Cu (r = 0.823, p < 0.001), K (r = 0.793, p < 0.001), and Zn (r = 0.853, p < 0.0001). Zn was also positively correlated with Cu (r = 0.700, p = 0.004), Fe (r = 0.705, p = 0.003), and K (r = 0.716, p = 0.003). Conversely, Ca showed strong negative correlations with K (r = -0.816, p < 0.001), Mn (r = -0.729, p = 0.002), and Zn (r = -0.771, p < 0.001). Moreover, as Pearson correlation alone cannot establish any mechanistic relationships among the feed variables, the observed statistical associations may indicate the similarities in ingredients or common formulation practices by the poultry feed manufacturers.
Conclusion
This study reveals the proximate nutritional profiles of commercial poultry feeds in Chattogram, Bangladesh. The amount of crude protein, fat, carbohydrates, ash, and moisture provided insights about the formulation of feeds. Few discrepancies were found in nutrients as compared to the international guidelines. The level of several minerals also exhibited deviations from the recommended ranges for poultry that may influence feed efficiency, bird’s growth and overall poultry health. The study also revealed the present status of poultry feeds in terms of three heavy metals. As most of the feed samples were from well-known brands, the concentration of these metals was below detection limit. The estimation of metabolizable energy may play a crucial role in economic efficiency and feeding cost optimization. As the energy is associated with feed parameters, the accurate formulation of cost-effective feeds can be achieved without compromising bird performance. Moreover, the correlation between different parameters may help in feed formulation. The observed inconsistencies can pose challenges for the poultry farmers in Bangladesh as most of them are unaware about the quality of the feeds. Thus, the feed manufacturers should maintain the guidelines given by international organizations, and the government should impose stricter rules to monitor the quality of poultry feeds regularly.
Acknowledgement
The authors would like to extend their sincere thanks to the Department of Applied Chemistry and Chemical Engineering, University of Chittagong and the Bangladesh Council of Scientific and Industrial Research for providing laboratory facilities and instrumental supports throughout this research.
Funding Sources
This study was supported financially by the Research and Publication Cell, University of Chittagong, Bangladesh with Grant No. 241/2023-24/1st invitation/17/2023.
Conflicts of Interest
The authors declare that they have no financial or non-financial conflicts of interest related to this work. In addition, they do not have any financial or personal interests that could have biased the results or interpretation of this study.
Data Availability Statement
There are no data sets have been produced or analyzed that would benefit from being made public, so data availability is not applicable.
Ethics Statement
This study did not require ethical approval.
Author’s Contribution
- Suman Barua: Conceived and designed the study, developed the methodology, performed formal data analysis, curated the data, prepared the original manuscript draft, supervised the study, managed project administration and secured funding;
- Md Anisul Islam: Formal analysis & investigation, data curation, manuscript preparation, manuscript review, revision;
- Sharmin Jamal: Conducted formal analysis and investigation, curated data, contributed to the original draft and created visualizations;
- Muhammad Abu Bakar: Formal analysis, investigation and data curation.
References
- Bale, O.O.J., Sekoni, A.A.,Kwanas, C.N., Nigerian Journal of Animal Production, 2002. 29: p. 102-112.
CrossRef - Hossain, M.D., Haque, A., Hoque, S.a.M., Ahmed, S., Islam, M.R., Rahman, M.M., Islam, S.,Selim, A.S.M., European Journal of Applied Sciences–Vol, 2023. 11.
- Korver, D.R., animal, 2023. 17: p. 100755.
CrossRef - Puls, R., Mineral levels in animal health. Diagnostic data. 1988.
- Coleman, M.E., Elder, R.S., Basu, P.,Koppenaal, G.P., Journal of AOAC International, 1992. 75: p. 615-625.
CrossRef - Soomro, R.N., Hu, R., Qiao, Y., El-Hack, M., Abbasi, I.D., Mae, Alagawany, M., Yang, X., Yao, J.,Dhama, K., Int. J. Pharm, 2017. 13: p. 378-387.
CrossRef - Nóbrega, I.P.T.D., Reis, M.D.P., Lizana, R.R., Moura, T.F.D., Teofilo, G.F.D.S., Bittencourt, L.C.,Sakomura, N.K., Animals, 2022. 12: p. 2567.
CrossRef - Abbas, M.H. ,Mahata, M.E., International Journal of Poultry Science, 2017. 16: p. 500-505.
CrossRef - Hassan, S.M. ,Afzal, N., Lahore Garrison University Journal of Life Sciences, 2022. 6: p. 68-82.
CrossRef - Rai, J.P., Narware, J., Kumar, R., Kumar, R., Pandey, P., Prakash, N., Holkar, S.K., Akhtar, N., Bhaskar, S.S.,Kumar, S., 2024.
- Daramola, A.A. ,Omokpariola, D.O., Discover Food, 2025. 5: p. 93.
CrossRef - Muir, W., Journal of veterinary internal medicine, 2017. 31: p. 1371-1381.
CrossRef - Leeson, S., 2003.
- Bao, Y.M. ,Choct, M., Animal Production Science, 2009. 49: p. 269-282.
CrossRef - Uluozlu, O.D., Tuzen, M., Mendil, D.,Soylak, M., Journal of Hazardous Materials, 2009. 163: p. 982-987.
CrossRef - Shahriar, S.M.S., Rabby, M.F., Akhtar, M.M., Dipti, S., Kulsum, U., Hossain, M.S.,Salam, S.M.A., Journal of Scientific Research, 2025. 17: p. 273-286.
CrossRef - Aoac, H., William L., Gw, Gaithersburg, MD, USA. Methods 925.10, 65.17, 974.24, 992.16., 2000.
- White, W., Food Drug Cosm. LQ, 1946. 1: p. 442.
CrossRef - International, A., The Association of Analytical Communities, 2005.
- Akubor, P.I., Isolokwu, P.C., Ugbane, O.,Onimawo, I.A., Food Research International, 2000. 33: p. 707-712.
CrossRef - Mishra, P., Thakur, M.S.,Khan, A., The Pharma Innovation, 2023. 12: p. 1659-62.
- Lodhi, G., Singh, D.,Ichhponani, J., The Journal of Agricultural Science, 1976. 86: p. 293-303.
CrossRef - Suleiman, N., Ibitoye, E.B., Jimoh, A.A.,Sani, Z.A., Sokoto Journal of Veterinary Sciences, 2015. 13: p. 17-21.
CrossRef - Pearson, D., Laboratory techniques in food analysis. 1973: Butterworths London.
- Mushtaq, M.M.H. ,Pasha, T.N., World’s Poultry Science Journal, 2013. 69: p. 833-852.
CrossRef - Classen, H.L., Animal Feed Science and Technology, 2017. 233: p. 13-21.
CrossRef - Lopez, G. ,Leeson, S., Canadian Journal of Animal Science, 2008. 88: p. 205-212.
CrossRef - Kačániová, M., Kluz, M., Rovná, K., Petrová, J., Felsöciová, S., Pavelková, A., Kňazovická, V., Pasternakiewicz, A., Džugan, M.,Hleba, L., Journal of microbiology, biotechnology and food sciences, 2012. 2: p. 272-281.
- Guillén, J., Medina, C.L.,Denais-Laliève, D.G., Journal, 2021: p. 949-960.
CrossRef - Vakili, R., Torshizi, M.E., Yaghobzadeh, M.M.,Khadivi, H., Biological Forum, 2015. 7: p. 1098.
- Farrell, D., Poultry Development Review. Rome: Food and Agriculture Organization, 2013: p. 2-9.
- Pesti, G.M., Journal of Applied Poultry Research, 2009. 18: p. 477-486.
CrossRef - Blanch, A., Barroeta, A.C., Baucells, M.D.,Puchal, F., Poultry Science, 1995. 74: p. 1335-1340.
CrossRef - Hasan, M.S., Al Bashera, M., Jahan, F., Hossain, A., Waliullah, M.,Islam, M.B., Int. J. Biosci, 2022. 20: p. 1-8.
- Pesti, G.M. ,Choct, M., Animal Nutrition, 2023. 15: p. 71-87.
CrossRef - Sultana, F., Khatun, H.,Ali, M.A., Chemical and Biological Technologies in Agriculture, 2016. 3: p. 30.
CrossRef - Ofori, H., Amoah, F., Arah, I.,Krampah, E.K., ARPN J. Eng. Appl. Sci, 2019. 14: p. 1026-1032.
- David, L.S., Anwar, M.N., Abdollahi, M.R., Bedford, M.R.,Ravindran, V., Animals, 2023. 13: p. 1590.
CrossRef - Underwood, E.J. ,Suttle, N.F., 1999.
- Council, N.R. ,Nutrition, S.O.P., Nutrient requirements of poultry: 1994. 1994: National Academies Press.
- Twining, P.F., Lillie, R.J., Robel, E.J.,Denton, C.A., Poultry Science, 1965. 44: p. 283-296.
CrossRef - Yoshida, M. ,Hoshii, H., Japanese poultry science, 1982. 19: p. 101-109.
CrossRef - Driver, J.P., Pesti, G.M., Bakalli, R.I.,Edwards, H.M., Poultry Science, 2005. 84: p. 1629-1639.
CrossRef - Walk, C.L., Addo-Chidie, E.K., Bedford, M.R.,Adeola, O., Poultry Science, 2012. 91: p. 2255-2263.
CrossRef - Bai, S., Yang, Y., Ma, X., Liao, X., Wang, R., Zhang, L., Li, S., Luo, X.,Lu, L., Journal of Animal Science and Biotechnology, 2022. 13: p. 11.
CrossRef - Keshavarz, K. ,Nakajima, S., Poultry Science, 1993. 72: p. 144-153.
CrossRef - Dijkslag, M.A., Kwakkel, R.P., Martin-Chaves, E., Alfonso-Carrillo, C., Walvoort, C.,Navarro-Villa, A., Poultry science, 2021. 100: p. 101130.
CrossRef - Shahriar, S.M.S., Haque, N., Hasan, T., Sufal, M.T.A., Hassan, M.T., Hasan, M.S.,Salam, S.M.A., Toxicology Reports, 2025. 14: p. 101932.
CrossRef - Kabir, A., Bhuyan, M.S., Das, S.K., Morshed, A.J.,Bakar, M.A., Am-Eurasian J Toxicol Sci, 2019. 11: p. 11-20.
- Rebelo, A., Duarte, B., Freitas, A.R., Almeida, A., Azevedo, R., Pinto, E., Peixe, L., Antunes, P.,Novais, C., Science of The Total Environment, 2023. 900: p. 165769.
CrossRef - Additives, E.P.O. ,Feed, P.O.S.U.I.A., EFSA Journal, 2016. 14: p. e04563.
- Karimi, A., Sadeghi, G.,Vaziry, A., Journal of Applied Poultry Research, 2011. 20: p. 203-209.
CrossRef - Leeson, S., World’s Poultry Science Journal, 2009. 65: p. 353-366.
CrossRef - Feijo, J.C., Vieira, S.L., Maria, D.D.B., Horn, R.M., Favero, A., Altevogt, W.E.,Nicola, B.S., Poultry Science, 2024. 103: p. 103558.
CrossRef - Ma, X., Liao, X., Lu, L., Li, S., Zhang, L.,Luo, X., The Journal of Nutrition, 2016. 146: p. 2267-2273.
CrossRef - Chowdhury, M.a.Z., Abir, M., Nesha, M., Fardous, Z., Rahman, H.,Bari, M.L., Asian-Australasian Journal of Bioscience and Biotechnology, 2021. 6: p. 128-141.
CrossRef - Islam, M.D., Rahaman, A.,Jannat, F., Journal of Scientific Agriculture, 2017. 1: p. 264-268.
CrossRef - Koreleski, J., Świątkiewicz, S.,Arczewska, A., 2010.
- Mushtaq, M.M.H., Pasha, T.N., Akram, M., Mushtaq, T., Parvin, R., Farooq, U., Mehmood, S., Iqbal, K.J.,Hwangbo, J., Asian-Australasian Journal of Animal Sciences, 2013. 26: p. 1742.
CrossRef - Council, N.R., National Research Council. 2005. Mineral Tolerance of Animals: Second Revised Edition, 2005: p. 11309.
- Shastak, Y. ,Rodehutscord, M., World’s Poultry Science Journal, 2015. 71: p. 125-138.
CrossRef - Waddell, A., Board, R., Scott, V.,Tullett, S., British Poultry Science, 1991. 32: p. 853-864.
CrossRef - Lee, S., Britton, W.,Rowland, G., Poultry Science, 1980. 59: p. 2403-2411.
CrossRef - Hess, J.B. ,Britton, W.M., Poultry Science, 1997. 76: p. 703-710.
CrossRef - Guenter, W. ,Sell, J., The Journal of Nutrition, 1974. 104: p. 1446-1457.
CrossRef - Olgun, O., World’s Poultry Science Journal, 2017. 73: p. 45-56.
CrossRef - Leach, R.M. ,Gross, J.R., Poultry Science, 1983. 62: p. 499-504.
CrossRef - Naz, S., Idris, M., Khalique, M.A., Zia-Ur-Rahman, Alhidary, I., Abdelrahman, M.M., Khan, R.U., Chand, N., Farooq, U.,Ahmad, S., World’s Poultry Science Journal, 2016. 72: p. 159-167.
CrossRef - Council, N.R., Nutrient requirements of poultry. National. 1994, Academy Press, Washington, DC.
- Huang, L., Li, X., Wang, W., Yang, L.,Zhu, Y., Biological trace element research, 2019. 192: p. 308-318.
CrossRef - Park, K.W., Rhee, A.R., Um, J.S.,Paik, I.K., Journal of Applied Poultry Research, 2009. 18: p. 598-604.
CrossRef - Coudert, E., Corrales, N.L., Juanchich, A., Poujol, M., Ribeiro, B., Chalvon-Demersay, T.,Fondevila, G., Animals, 2025. 15: p. 2111.
CrossRef - Lee, C., Kim, H.W., Kwon, C.H., Han, G.P., Lee, J.H.,Kil, D.Y., Poultry Science, 2024. 103: p. 104418.
CrossRef - Wang, T., Jendza, J.A., Ader, P.,Adeola, O., Canadian Journal of Animal Science, 2020. 101: p. 263-273.
CrossRef - Imran, R.I., 2014.
CrossRef - Islam, M.K., Sachi, S., Quadir, Q.F., Sikder, M.H., Faruque, M.O., Miah, M.A., Islam, M.S., Sani, A.H., Baishya, P.,Rafiq, K., Journal of Advanced Veterinary and Animal Research, 2024. 11: p. 47.
- Joint, F., CODEX ALIMENTARIUS COMMISSION, Codex General Standard for Contaminants and Toxins in Foods, Schedule, 2001.
- Mansour, S.A., Practical food safety: contemporary issues and future directions, 2014: p. 235-255.
CrossRef - Jan, A.T., Azam, M., Siddiqui, K., Ali, A., Choi, I.,Haq, Q.M.R., International journal of molecular sciences, 2015. 16: p. 29592-29630.
CrossRef - Igwemmar, N.C., Kolawole, S.A., Omoniyi, A.O., Bwai, D.M., Fagbohun, A.A.,Falayi, O.E., Journal of Applied Sciences and Environmental Management, 2022. 26: p. 1675-1682.
CrossRef - Leeson, S., Caston, L.,Summers, J.D., Poultry Science, 1996. 75: p. 529-535.
CrossRef - Summers, J. ,Leeson, S., Canadian Journal of Animal Science, 1985. 65: p. 913-919.
CrossRef - Halpin, K.M. ,Baker, D.H., Poultry Science, 1986. 65: p. 1371-1374.
CrossRef - Ravindran, V. ,Blair, R., World’s Poultry Science Journal, 1993. 49: p. 219-235.
CrossRef
Accepted on: 20 Aug 2026
Second Review by: Dr. Shreya Shanyal
Final Approval by: Dr. Murat HATİPOĞLU


ISSN Online: 2231-5039