The Concurrent Analysis of Moxifloxacin Hydrochloride and Ketorolac Tromethamine in Ocular Drops Using Chemometrics Methodology
 , Devara Srikanth1, Shashikala Metri2, Nekkanti Subash,1 Naga Shravani Mahalakshmi Sriram 1 and Swathi Balasubramanian1.
1Department of Pharmaceutical Analysis, Gokaraju Rangaraju College of Pharmacy, Hyderabad-Telangana, India.
2Department of Pharmacognosy, Gokaraju Rangaraju College of Pharmacy, Hyderabad-Telangana, India.
Corresponding Author E-mail: nirujose2003@gmail.com
DOI : http://dx.doi.org/10.13005/ojc/420416
Download this article as:

An ocular dosage form of Moxifloxacin Hydrochloride and Ketorolac Tromethamine is available, and for the coexistent analysis, a UV-based chemometrics method is developed. An economical method that uses very few organic solvents was built based on the mean centering of the ratio spectral data values with a computer Program based on MATPLOTLIB and Python. Both drugs gave linear results across 2-10 µg/ml with good correlation coefficients. The analytical process was subjected to validation for the specified criteria concerning ICH guidelines.
KEYWORDS:Chemometrics; Moxifloxacin; Hydrochloride; Ketorolac Tromethamine; Ratio Mean Centering method
Introduction
In ocular infections, it’s a common practice to use an effective antibiotic in combination with an NSAID or steroid in order to alleviate the symptoms at a faster rate. Moxifloxacin Hydrochloride (MOX) and Ketorolac Tromethamine (KET) is such a combination of an antibiotic and an NSAID used in bacterial eye infections. MOX is chemically1-Cyclopropyl-7-[(1S,6S)-2,8diazabicyclo [4.3.0] nonan-8-yl]-6-fluoro-8-methoxy-4-oxoquinoline-3-carboxylic acid salt of a fluoroquinolone antibiotic.1 KET is chemically 2-amino-2-(hydroxymethyl) propane-1,3-dio5-benzoyl-2,3-dihydro-1H-pyorrolizine-1-carboxylic acid. It is a synthetic tromethamine salt of ketorolac, possessing analgesic, antipyretic, and anti-inflammatory activities.2 The drug structures of MOX &KET are presented in Figure. 1.
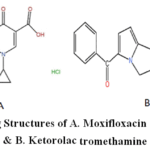 |
Figure 1: Drug Structures of A. Moxifloxacin Hydrochloride &B. Ketorolac tromethamine Click here to View Figure |
MOX blocks DNA replication in bacteria by binding to the bacterial enzymes, topoisomerase II and IV. Ketorolac blocks COX-1 and COX-2, hence it is non-selective towards the COX enzyme.3 The effects of MOX and KET alone, in fixed-dose combinations, and conjunction with other medications were investigated using various methods. Moxifloxacin has been investigated using UV spectrophotometric methods,4-10 HPLC,11-15 and HPTLC16 either alone or in combination with other medications. The combined use of MOX and KET was investigated using UV Spectrophotometry17-19 and HPLC20-23 While several analytical techniques were described for single medications as well as different combinations, there were fewer published techniques for the coexistent estimation of KET and MOX in combination. Hence, considering this, we thoughtfully planned the present investigation to develop a green method using chemometrics based on ratio mean centering (RMC) for the concurrent analysis of the drugs. Using statistical or mathematical tools, one can retrieve useful information from chemometrics methods to help with the QC analysis.
Materials and Methods
Instruments and Chemicals
Shimadzu UV-Visible spectrophotometer was employed for the spectral recording. Python and Matplotlib-based software programs assisted the ratio mean centring of the data of the ratio spectrum. MOX and KET freebies from Hetero Drugs Ltd, Hyderabad, India, were used.
Process outline
Normal spectra of MOX were divided by a KET spectrum of a suitable concentration, and to quantify KET, its spectra were divided by an appropriate concentration of MOX spectrum. The ratio spectra were mean-centred using the Program, and the standard graph was plotted with the measured amplitudes Vs concentration from the ratio mean-centred spectrum. An economical method that utilizes no organic solvent has been developed.
Method Validation
The method validation strategy is conducted as outlined below and is in accordance with ICH guidelines.24 For testing Linearity,10 mg of each medication was used to prepare stock solutions and further dilutions of MOX and KET, each separately, in a range of strengths from 2 to 10 µg/ml using 0.1 M urea. The stored UV spectrum of each drug, derived by the scanning process were divided the spectrum of the other drug; KET spectrum of ten µg/ml was the divisor for MOX spectrum, and six µg/ml of MOX spectrum was the divisor for KET spectrum.The collected data sets of the ratio spectrum were mean centeredusing the written software program, explicitly designed for this purpose. The reliability curves were developed by charting the amplitudes against the respective concentrations.25,26
The accuracy was evaluated using the standard addition technique by comparing the measured value to the actual amount. Three levels of spikes with standards (80%, 100%, and 120%) were applied to commercially available eye drops. The RMC method was verified by estimating the amount of pharmaceuticals experimentally versus the theoretical amount for each spiking. The responses noted at 284 nm and 314 nm were used to determine the amounts of MOX & KET, respectively, while the spiking and subsequent readings were duplicated three times.25,26
The precision evaluation calculates how closely test results match when a sample is read multiple times. The analysis of three standard solutions of MOX & KET of the same strength (2, 6, and 10 µg/ml) was repeated to ensure repeatability in the results on a single day and three different days for intra-day and inter-day precision, respectively.25,26 The success index criteria for accuracy and precision are to acquire a %RSD < 2.
Extension of the method to Moxicip-KT
Moxicip KT ocular Drops (MOX + KET each of 0.5 % w/v) were shifted to a 10 ml graduated flask, dissolved in 0.1 M Urea, and an aliquot was diluted further to a sample solution with 10 µg/ml each of KET and MOX. For estimating the drug content, the sample spectrum was divided by the spectrum of each standard drug. The drug content was assessed using the amplitude values and the respective KET and MOX regression equations.25,26
Results and Discussion
The divisor concentrations were crucial for obtaining a good signal in the graph of the RMC process; hence, 10 µg/ml of KET and 6 µg/ml of MOX were the divisors for MOX and KET, respectively. 1.0 nm was held constant as Δλ and found to have little effect on the measurements. Each UV spectrum of MOX was divided by a zero-order spectrum of KET-10 µg/ml; all KET spectra were divided by the MOX-6 µg/ml spectrum. The spectral division was facilitated by the UV probe software, which is associated with the UV instrument software. The ratio spectral data were then subjected to mean centering using a written software program with Python and Matplotlib, as this is not available with the built-in UV software program.25,26 The concentration (µg/ml) of MOX and KET, along with their associated amplitudes, in the RMC method was shown to be linearly related for both KET and MOX across a range of 2–10 µg/ml for each. The good correlation coefficient values (R2=0.9993for MOX and 0.9996 for KET) obtained for MOX and KET shows the smart linear relationship between concentrations and the corresponding amplitudes in the RMC spectra of MOX and KET.The RMC spectra for KET and MOX, respectively, are shown in Figures.2 and 3. Table 1 provides the RMC characteristics in full.
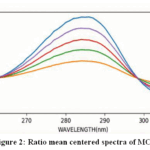 |
Figure 2: Ratio mean centered spectra of MOX Click here to View Figure |
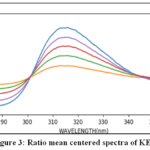 |
Figure 3: Ratio mean centered spectra of KET Click here to View Figure |
Table 1: RMC characteristics for MOX and KET
|
Drug |
λ(nm) | Linearity span (µg/mL) |
Estimating equation, R2 |
|
MOX |
284 | 2 -10 | y= 0.611x+0.106,0.9993 |
| KET | 314 | 2 -10 |
Y= 0. 167x+0.24,0.9996 |
Tables 2 and 3 presented the computed percentage recoveries and the precision data, respectively. The percentage recoveries (%) of MOX wasfound to be between 100.11% and 101.5%, and for KET, it ranged between 100.83% and 102.95%. The statistical results showed good precision. The RMC approach yielded RSD values of less than 2.0% for both accuracy and precision results. The LOD and LOQ of MOX were determined to be 0.39 and 1.194 µg/mL, respectively; for KET, LOD and LOQ were found to be 0.23 and 0.718 µg/mL, respectively.
Table 2: Recovery data
|
Spiked level (%) |
Drug | Actual conc
(µg/mL) |
Recovered conc. (µg/mL) (n=3)
(AM ± SD) |
Recovery (%)
|
RSD* (%) |
|
80 |
MOX | 7.2 | 7.25± 0.11 | 100.69 | 1.51 |
| KET | 7.2 | 7.26± 0.12 | 100.83 |
1.65 |
|
|
100 |
MOX | 8.0 | 8.12 ± 0.09 | 101.50 | 1.10 |
| KET | 8.0 | 8.18± 0.10 | 102.25 |
1.22 |
|
|
120 |
MOX | 8.8 | 8.81 ± 0.11 | 100.11 | 1.25 |
| KET | 8.8 | 9.06± 0.12 | 102.95 |
1.32 |
*Acceptance criteria= % RSD < 2
Table 3: Precision data
|
Drug |
Conc. (µg/mL) | Precision Intra-day | Precision Inter-day | ||
| Experimental strength (µg/mL) (Mean ± SD) (n=3) | RSD* (%) | Experimental strength (µg/mL) (Mean ± SD) (n=3) |
RSD* (%) |
||
|
MOX |
2 | 2.05 ± 0.04 | 0.52 | 2.03± 0.02 | 0.95 |
| 6 | 6.09 ± 0.05 | 0.44 | 6.17 ± 0.05 |
0.27 |
|
|
10 |
9.99 ± 0.10 | 0.37 | 10.10 ± 0.06 | 0..54 | |
| KET | 2 | 2.07 ± 0.05 | 0.43 | 2.10± 0.04 |
0.44 |
|
6 |
6.10 ± 0.06 | 0.54 | 5.90 ± 0.11 | 0.58 | |
| 10 | 10.02 ± 0.03 | 0.25 | 10.11 ±0.06 |
0.33 |
|
*Acceptance criteria = % RSD < 2
Analysis of Commercial Eye Drops (Assay)
To prove the utility of the developed method, we analysed the marketed Moxicip KT eyedrops. Table 4 presents the comparison between the acquired values for MOX and KET in Moxicip KT eye drops and the respective labelled amounts. The correctness of the suggested approach was demonstrated by the formulation’s assay results, which showed a % RSD of less than 2.
Table 4: Assay results of Moxicip KT
|
Label claim |
Experimental amount (mg) Mean ± SD, RSD (%) |
|
|
MOX + KET (each with 0.5% w/v in 5 mL) |
MOX | KET |
| 24.95 ± 0.15: 0.52% |
25.38 ± 0.33; 0.78% |
|
|
% Assay |
99.8% |
101.5% |
Conclusion
A chemometrics-based UV spectroscopic strategy has been developed for the concurrent analysis of MOX and KET in ocular drops. For the ratio mean centring, we employed a software program based on Python and Matplotlib. It is a simple process that does not require any skilled operation as the operation of UV instrument is very handy. Since we have used 0.1M Urea as the solvent throughout the process, the method falls in the category of green analytical method.
Acknowledgement
We acknowledge our deepest regards to GokarajuRangaraju College of Pharmacy for ensuring the essentials for completing the work.
Funding Sources
The author(s) received no financial support for the research, authorship, and/or publication of this article.
Conflict of Interest
The author(s) do not have any conflict of interest.
Data Availability Statement
This statement does not apply to this article.
Ethics Statement
This research did not involve human participants, animal subjects, or any material that requires ethical approval.
References
- National Center for Biotechnology Information. Pubchem compound summary for CID 152946, Moxifloxacin. Retrieved on March 16, 2025.
- Hooper DC. Mechanisms of action of antimicrobials: focus on fluoroquinolones. Clinical infectious diseases: an official publication of the Infectious Diseases Society of America. 2001,32Suppl 1, 9–15.
CrossRef - Motwani S.K., Chopra S., Ahmad F.J., Khar R.K., Validated spectroscopic methods for estimation of Moxifloxacin in bulk and pharmaceutical formulations, SpectrochemicalActa. Part A, 2007, 68, 250-256.
CrossRef - Pekamwar S S, Kalyankar T M, Tambe B. V, Wadher S J. “Validated UV-Visible Spectrophotometric method for simultaneous estimation of Cefixime and Moxifloxacin in pharmaceutical dosage form. J App Pharm Sci. 2015,5(01), 037-041.
- TarkaseKailash N., Admane Swati S., Sonkhede Neha G. and ShejwalSeema R: Development and Validation of UV Spectrophotometric Methods for Determination of MoxifloxacinHCl in Bulk and Pharmaceutical Formulations. Der PharmaChemica. 2012, 4(3),1180-1185.
- Vyas PJ, Dave JB, Patel CN: Simultaneous estimation of moxifloxacinHCl and Bromfenac sodium in eye-drops by spectroscopy methods. International Journal of Pharmaceutical science and research.2012,7, 2137-2142.
- Mohan Bonthu: Method development and validation of UV spectrophotometric and stability indicating RP-HPLC methods for simultaneous estimation of moxifloxacin hydrochloride and ketorolac tromethamine in bulk and ophthalmic dosage forms. Indian Drugs.2017, 54, 38-46.
CrossRef - KailashTarkase N., Swati Admane S., Neha Sonkhede G. and SeemaShejwal R. Development and Validation of UV-Spectrophotometric Methods for Determination of Moxifloxacin HCL in Bulk and Pharmaceutical Formulations. Scholars Research Library Der PharmaChemica. 2012, 4(3),1180-1185.
- Dinesh M. Dhumal, Atul A. Shirkhedkar and Sanjay J. Surana. Quantitative determination of Moxifloxacin hydrochloride in bulk and ophthalmic solution by UV-spectrophotometry and first order derivative using area under curve. Scholars Research Library Der Pharmacia Letter. 2011, 3(3),453-456.
- Hammad, S.F, Rady, M.M. & El-Malla, S.F. UV spectrophotometric methods for simultaneous determination of ketorolac tromethamine and olopatadine hydrochloride: Application of multiple standard addition for assay of ophthalmic solution. Sci Rep. 2023,13,18143
CrossRef - Kumudhavalli MV, Chidambaram S., Subbaiah R., Balasundaram J., Method development and validation for estimation of Moxifloxacin Hydrochloride in tablet dosage form by RP-HPLC method. International Research Journal of Pharmacy, 2010,1(1):333-336.
- Parimi H, Bolla C, Gandhi B. M, Vatchavai B. R., Kamatham S. S. and Kolli S. Method development and validation of UV spectrophotometric and stability indicating RP-HPLC methods for simultaneous estimation of moxifloxacin hydrochloride and ketorolac tromethamine in bulk and ophthalmic dosage forms. Indian drugs. 2017;54,38-46.
CrossRef - Gujapeneni S, Jaya Chandra Reddy P: Analytical Method Development and Validation of simultaneous Estimation of Ketorolac and Phenylephrine by RP-HPLC Method in Bulk. International Journal of Chemical and Natural Science, 2015; 3,258-3263.
- Sunil G, M. Jambulingam, AnandaThangadurai S, Kamalakannan D, Sundaraganapathy R, Jothimanivannan C, Development and validation of Ketorolac Tromethamine in eye drop formulation by RP-HPLC. Arabian Journal of Chemistry.2014, http://dx.doi.org/10.1016/j.arabjc.2012.12.031
CrossRef - Hari Babu B: Development and Validation of Liquid Chromatographic Method for the Simultaneous Estimation of Ofloxacin and Ketorolac TromethamineIn Combined Dosage Form. American Journal of PharmTech Research. 2014, 4(2), 281-290.
- Fawzy A. El Yazbi, Ekram M. Hassan, Essam F. Khamis, Marwa A.A. Ragab, Mohamed M.A. Hamdy, Development and Validation of a High-Performance Thin-Layer Chromatographic Method for the Simultaneous Determination of Two Binary Mixtures Containing Ketorolac Tromethamine with Phenylephrine Hydrochloride and with Febuxostat, Journal of Chromatographic Scince. 2016, 54(5),819–828.
CrossRef - Gandhi LR, Dewani AP, Bakal RL, Shiradkar MR, Chandewar AV. Absorption ratio method for the estimation of moxifloxacinhcl& ketorolac tromethamine in their combined dosage form by uv visible spectroscopy. International Journal Pharmaceutical Medicine.2011,3(7),21-26.
- Chintawar PP, Pawar PN, Harde MT, Joshi SV, Chaudhari PD. Spectrophotometric methods for simultaneous estimation of moxifloxacinHCl and ketorolac tromethamine. Asian Journal of Research in Chemistry. 2010,3(3),767-771.
- Srinivasa U, Nayak SN, Kamath SS, Shabaraya AR. Zero order and First order derivative spectroscopic method for simultaneous estimation of Moxifloxacin hydrochloride and Ketorolac tromethamine in simulated tear fluid. PharmaTutor. 2016,4(4),43-47.
- Raghavi R, Saravanan D, Maheswaran A. Analytical method development and validation for simultaneous estimation of moxifloxacin hydrochloride and ketorolac tromethamine by using RP-HPLC. International Journal of Research in Pharmaceutical Sciences and Technology. 2020,12(1),25-31.
- Patel D, Patel M, Patel K. Simultaneous RP-HPLC estimation of Moxifloxacin hydrochloride and Ketorolac tromethamine in ophthalmic dosage forms. Asian Journal of Research In Chemistry. 2012,5(5),697-700.
- Razzaq SN, Khan IU, Ashfaq M, Mariam I. Stability indicating HPLC method for simultaneous determination of moxifloxacin hydrochloride and ketorolac tromethamine in pharmaceutical formulations. Química Nova. 2012,35,1216-1221.
CrossRef - Raju B, Ramesh M, Borkar RM, Padiya R, Banerjee SK, Srinivas R. Development and validation of liquid chromatography–mass spectrometric method for simultaneous determination of moxifloxacin and ketorolac in rat plasma: application to pharmacokinetic study. Biomedical chromatography. 2012,26(11),1341-1347.
CrossRef - ICH, Q2B, Validation of Analytical Procedures: Methodology. International Conference on Harmonization, Geneva, pp. 1-5 (1996).
- Ceema Mathew,Sushmitha Sri Reddy, ShashikalaMetri, Shebina P Rasheed, SoujanyaChaganti. Green analytical methods in practice: chemometrics driven methods for the simultaneous estimation of darunavir and ritonavir. Eur. Chem. Bull. 2023, 12 (Special Issue 8), 414-425.
- Ceema Mathew. Chemometrics Methods Using RMC and DBADP for the Simultaneous Estimation of Cefixime and Ofloxacin. International Journal of Research and Analytical Reviews. 2024,11(1),897-902.
 PlumX:
  Views: 474 Views
  PDF Downloads: 73
 Accepted on: 19 Jan 2026
Second Review by: Dr. Roohi Khan
Final Approval by: Dr. Naeem Uddin Siddiqui


ISSN Online: 2231-5039