Structural and Morphological Analysis of Carbon Dots Derived from Caesalpinia crista L. Leaves
 , Anil Athare*and Sushama Takate
Department of Chemistry, New Arts, Commerce and Science College, Shevgaon Dist. Ahmednagar, Maharashtra, India.
Corresponding Author E-mail: ltanilathare@gmail.com
DOI : http://dx.doi.org/10.13005/ojc/420411
Download this article as:

Plant-derived carbon dots (CDs) are attracting significant interest of researchers due to their potential uses in sensing, medicine etc. This study represents the first structural and morphological characterization report of CDs derived from Caesalpinia crista L. (CCL) leaves utilizing a simple hydrothermal method. Two absorption bands at 227.7 and 379.4 nm were detected using UV-Vis spectroscopy. FTIR analysis revealed four stretching bands at 3380.12, 2933.33, 1733.15, and 1003.33 cm⁻¹, while Raman spectroscopy showed D and G bands at 1354 and 1594 cm⁻¹. XRD displayed peaks at 28.3° and 40.5°. Amorphous, quasi-spherical CDs with an average size of 7.9 nm were validated through HR-TEM and SAED. Elemental analysis found carbon as the most prominent component, followed by oxygen, hydrogen, and nitrogen. Like CCL leaves, other plant parts may be sustainable precursors for CDs synthesis, according to these studies. Furthermore, UV-Vis, FT-IR, Raman, XRD, HR-TEM, and elemental analysis might thoroughly analyze CDs.
KEYWORDS:Caesalpinia crista L.; Carbon dots; Hydrothermal method; Structural and morphological analysis
Introduction
The conversion of renewable biological resources into biomaterials is crucial, because these materials are non-toxic and biodegradable. Additionally, they play a significant role in preserving ecological balance and enhancing environmental sustainability. In recent years, nanoscale biomaterials known as CDs, derived from natural resources, have emerged as a prominent category of biomaterials. These CDs have outstanding characteristics including superior photoluminescence, remarkable biocompatibility, chemical stability, low toxicity and cost-effective production. These advantages contribute to an upward trend in their utilization by scholars for diverse purposes. These carbon-based CDs, typically smaller than 10 nm, have been synthesized by numerous researchers using natural precursors such as biomass, plant parts, industrial waste, byproducts and other carbon-rich materials and this synthesis process is still ongoing1. Various approaches have been employed for the synthesis of CDs, each providing unique benefits according to the specifications needed and applications. The techniques includes arc discharge, laser ablation, chemical oxidation, microwave-assisted synthesis, electrochemical procedures and hydrothermal or solvothermal approaches. Among these, hydrothermal techniques are the most common and simple approach utilized by the majority of researchers in the past for the synthesis of CDs. These synthesized CDs have been evaluated for their prospective uses in diverse domains, including photocatalysis, bioimaging, drug delivery, sensing, and optoelectronics2.
Nowadays, carbon-based CDs are in high demand, particularly in the medical sector, where they are essential for applications like as bioimaging and the real-time monitoring of biological processes. Additionally, due to their functionalizable surfaces, CDs are used in drug delivery systems to enhance therapeutic efficiency, improve drug transportation within the body and enable monitored drug release. In fact, CDs are utilized in cancer treatment through photodynamic and photothermal therapies and this offers a novel methods for the elimination of targeted cancer cells3,4. In the field of sensing, CDs are used as biosensors for the identification of environmental pollutants in biological fluids like urine and blood. They are also employed to identify heavy metals, pesticides and other contaminants in water that affect the health of living organisms, contributing in environmental monitoring and conservation initiatives. CDs have this utility due to their sensitivity to temperature, pH and specific ions5. Furthermore, CDs are attracting significant attention for their applications in optoelectronics and energy storage6. Colloidal CDs are especially useful in light-emitting diodes, where their tunable fluorescence properties enable the development of lighting systems which are stable, excellent and cost-effective. Furthermore, CDs improve the efficiency of electrical power conversion and storage, making them significant for improving the performance of solar cells and supercapacitors, thus enabling enhanced sustainable energy solutions. These CDs function as photocatalysts, significantly contributing to hydrogen production through water splitting and are also effective in removing pollutants from water. In agriculture, CDs act as nanofertilizers that boost plant development and increase yields of crops7.
In recent years, the hydrothermal synthesis of plant-derived CDs has become widely used due to the simplicity of the method and the abundance of phytochemicals in plant materials. In 2019, M. Shahshahanipour et al. derived CDs from the Lawsonia inermis (henna) plant and tested their applications as antibacterial agents and as probes for sensing anticancer drugs8. In light of the widespread importance of CDs in medical, sensing and other fields, the present study uses CCL leaves as a natural precursor for their synthesis, as these leaves have traditionally been employed to treat numerous human health issues9. Multiple prior research have empirically validated the efficacy of CCL leaves in addressing numerous illnesses, including their hepatoprotective10, anthelmintic11, antibacterial, and antioxidant characteristics12,13, along with its potential applicability in the management of Alzheimer’s disease. Furthermore, CCL leaves-derived CDs were analyzed using sophisticated techniques such as FT-IR, UV-Vis spectroscopy, TEM, XRD, Raman spectroscopy and elemental analysis. The data obtained from these analyses reveal essential insights into the structural characteristics, morphology and size of the synthesized CDs14.
Material and Methods
Plant collection and identification
Fresh leaves of CCL were collected from the hilly area of Nandurbar district, Maharashtra, India in August 2024. The plant specimen (specimen no. RUVCC-1) was authenticated by Prof. Dinesh L. Shirodkar, a botanist at the Botanical Survey of India in Pune (Certification No. BSI/WRC/Ide.cer./2023/2006230000881, dated on 13/07/2023).
Processing of plant material
The collected leaves were dried in the shade at ambient temperature and subsequently pulverized into a fine powder utilizing a mixer. Then powdered plant material was weighed and kept in a sealed container in a dry and cool place for further analysis.
Hydrothermal synthesis of CDs
The hydrothermal method was employed to synthesize producing CDs15,16. In this method, 1 g of powdered CCL leaves was mixed with 80 mL of double-distilled water and stirred on a magnetic stirrer for 3 hours. The resulting solution was placed in a 100 mL Teflon-lined stainless-steel autoclave and subjected to heating at 160°C for 8 hours in a muffle furnace (Bio-Technics India, Model-BTI-36). Subsequently, the autoclave was permitted to cool to room temperature. The resulting solution was then filtrated using Whatman Filter paper grade 41 and centrifugation (Remi R-4C DX) at 3000 rpm for 30 minutes to eliminate larger molecules, followed by filtration through a 0.22 μm membrane to remove any residual larger particles. The resultant pure solution was stored for future use at 4°C.
Optical instruments used for the characterization of CDs
The FT-IR spectrum was recorded with a Perkin-Elmer spectrophotometer fitted with an ATR diamond (Spectrum 2) which operates in the frequency range of 4000 to 400 cm⁻¹. The absorption of CDs was recorded using a UV-Vis spectrophotometer (LABINDIA, UV-3092). An FEI Tecnai G2 F30 operating at 300 kV was used to acquire TEM images. A Bruker D8 Advance powder X-ray diffractometer was used for XRD measurements. A CHNS (O) analyzer (Thermo Fisher Scientific, Flash SmartV CHNS/O) was used to perform elemental analysis. A Raman microscope (Invia Reflex) with a wavenumber range of 50 to 4000 cm⁻¹ was used to record the Raman spectra17,18. The spectrum were plotted using Origin 6.0 software.
Result and Discussion
UV-Vis analysis
The UV-Vis spectrum of the CDs displays two absorption maxima at wavelengths of 227.7 nm and 379.4 nm, which correspond to the π–π* and n–π* transitions, as depicted in Figure 2A. These transitions indicate the presence of aromatic or conjugated systems (C=C) and carbonyl groups (C=O) in the synthesized CDs. These absorption peaks are also provides significant information regarding CDs including their optical properties, electronic transitions and surface functionalities19.
FT-IR analysis
FT-IR spectroscopy assists in improving understanding of the surface functional groups and chemical bonding of CDs20. Herein, a broad band detected at 3380.12 cm⁻¹ in the IR spectrum of CDs as illustrated in Figure 2B, could be due to –NH (amine) or –OH (alcohol) stretching vibrations. Additionally, strong band at 2933.33, weak bands at 1733.15 cm⁻¹, and 1003.33 cm⁻¹ could be linked to the =C-H (alkene) or –C-H (alkane), C=O (carbonyl), and C–O–C (ether) functional groups, respectively. The presence of these functional groups in CDs may be important for determining how efficient they are in various areas. Additionally, the amine and alcohol functional groups found in CDs may have excellent aqueous solubility. The observed C=O (carbonyl), C=C (alkene) and C–O–C (ether) in CDs also indicates the possibility for group derivatization which could improve their efficiency in various future applications.
Raman spectroscopic analysis
The hybridization of carbon in CDs can be understood from Raman bands. Herein, the D band at 1354 cm⁻¹ and the G band at 1594 cm⁻¹ are the two main bands are seen in the Raman spectrum of synthesized CDs as shown in Figure 2C. The D band signifies the vibrations of carbon atoms (SP3 hybridization) in distorted graphite, suggesting structural defects or instability within the carbon framework. The G band links to the vibrations of sp² carbon atoms arranged in a two-dimensional hexagonal lattice, signifying the extent of graphitization in the carbon dots. The Raman intensity ratio of the D and G bands (ID/IG) was calculated to evaluate the degree of disorder and the ratio of sp³ to sp² carbon in carbon dots (CDs). The final value was 0.84, indicating that amorphous carbon is the primary component of the CDs21.
XRD analysis
When examining the diffraction patterns of graphitic and amorphous carbon structures in CDs, XRD is an essential technique. The XRD pattern shown in Figure 2D of the CDs displays broad reflections cantered at 28.3° and 40.5° corresponding to the graphite 002 and 001 interlayer lattice spacing. This suggests the presence of graphitic amorphous carbon. The Bragg’s equation, nλ = 2d sin θ, is used to determine the interlayer distance (d-spacing) of the CDs. Where λ represents the wavelength of the X-rays, d represents the interlayer spacing, and θ represents the diffraction angle.
HR-TEM analysis
The size and shape of the synthesized CDs can be determined using TEM analysis, which indicates that the majority of the CDs have a spherical shape22. The TEM image as shown in Figure 2E along with the particle size distribution histogram in Figure 2F of CDs, reveals that the hydrothermal treatment produces quasi-spherical, well-dispersed particles with an average diameter of approximately 7.9 nm. Additionally, the broad circular ring observed in the SAED micrograph pattern signifies the amorphous nature of the synthesized CDs as shown in Figure 2I.
Elemental analysis
An elemental analysis was performed to determine the composition and elemental abundance of the CDs. Figure 2J shows the composition of the CDs, containing 33.873% carbon, 32.555% oxygen, 7.059% hydrogen, and 3.194% nitrogen. According to the results, the synthesized CDs may contain amorphous nanocrystalline carbon23.
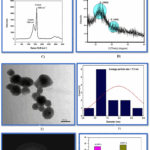 |
Figure 1: A) UV-Vis spectrum of CDs B) FT-IR spectrum of CDs C) Raman spectrum of CDs D) XRD pattern of spectrum E) TEM image of CDs F) Particle size distribution histogram of CDs. |
Conclusion
CCL leaves were used in this study as a green resource to synthesize CDs, which have an average particle size of 7.9 nm. Likewise, other plant-derived biomaterials can be synthesized in the future with various particle sizes, providing chances to expand their applications across multiple fields. The hydrothermal process was used as an easy and efficient method to synthesize CDs. Analytical techniques like UV-Vis spectroscopy, FT-IR, Raman spectroscopy, XRD, TEM and elemental analysis were used to complete characterization the CDs. These techniques are essential and important for this purpose.
Acknowledgement
The authors express their gratitude to the management of New Arts, Commerce, and Science College, Shevgaon and SAIF-IIT Bombay for providing the necessary facilities and access to advanced analytical equipment. The authors are also thankful to the botanist Shri. D. L. Shirodkar, Botanical Survey of India for identification and authentication of plant species.
Funding Sources
The author(s) received no financial support for the research, authorship, and/or publication of this article.
Conflict of Interest
The author(s) do not have any conflict of interest.
Data Availability Statement
This statement does not apply to this article.
Ethics Statement
This research did not involve human participants, animal subjects, or any material that requires ethical approval.
References
- Huang Z & Ren L, Large Scale Synthesis of Carbon Dots and Their Applications: A Review, Molecules, 30 (4) 2025.
CrossRef - Marvi PK, Das P, Jafari A, Hassan S, Savoji H, et al., Multifunctional Carbon Dots In Situ Confined Hydrogel for Optical Communication, Drug Delivery, pH Sensing, Nanozymatic Activity, and UV Shielding Applications, Adv Healthc Mater, 2403876 2025 1–16.
CrossRef - Hola K, Zhang Y, Wang Y, Giannelis EP, Zboril R, et al., Carbon dots – Emerging light emitters for bioimaging, cancer therapy and optoelectronics, Nano Today, 9 (5) 2014 590–603.
CrossRef - Bhattacharya T, Shin GH, & Kim JT, Carbon Dots: Opportunities and Challenges in Cancer Therapy, Pharmaceutics, 15 (3) 2023 1–22.
CrossRef - Jing HH, Bardakci F, Akgöl S, Kusat K, Adnan M, et al., Quantium Dot 5.Pdf, 2023.
- Zhiwei ZhangCaijuan WuJuan HuChen LiYingliang LiuBingfu Lei*Mingtao Zheng*, Carbon dots based on natural resources: Synthesis and applications in sensors, ACS Appl Bio Mater, 8 (2) 2025 935–961.
CrossRef - Ren J, Opoku H, Tang S, Edman L, & Wang J, Carbon Dots: A Review with Focus on Sustainability, Adv Sci, 2405472 2024 1–20.
CrossRef - Nocito G, Calabrese G, Forte S, Petralia S, Puglisi C, et al., Carbon dots as promising tools for cancer diagnosis and therapy, Cancers (Basel), 13 (9) 2021 1–14.
CrossRef - Upadhyay P, Joshi BC, Sundriyal A, & Uniyal S, Caesalpinia crista L.: A review on traditional uses, phytochemistry and pharmacological properties, Curr Med Drug Res, 3 (01) 2019 1–6.
CrossRef - Sarkar R, Hazra B, & Mandal N, Hepatoprotective potential of Caesalpinia crista against iron-overload-induced liver toxicity in mice, Evidence-based Complement Altern Med, 2012 2012.
CrossRef - Ramesh BN, Indi SS, & Rao KSJ, Anti-amyloidogenic property of leaf aqueous extract of Caesalpinia crista, Neurosci Lett, 475 (2) 2010 110–114.
CrossRef - Sembiring EN, Elya B, & Sauriasari R, Phytochemical screening, total flavonoid and total phenolic content and antioxidant activity of different parts of Caesalpinia bonduc (L.) Roxb, Pharmacogn J, 10 (1) 2018 123–127.
CrossRef - Chethana K, Sasidhar B, Naika M, & Keri R, Phytochemical composition of Caesalpinia crista extract as potential source for inhibiting cholinesterase and β-amyloid aggregation: Significance to Alzheimer’s disease, Asian Pac J Trop Biomed, 8 (10) 2018 500–512.
CrossRef - González-González RB, González LT, Madou M, Leyva-Porras C, Martinez-Chapa SO, et al., Synthesis, Purification, and Characterization of Carbon Dots from Non-Activated and Activated Pyrolytic Carbon Black, Nanomaterials, 12 (3) 2022.
CrossRef - Pudza MY, Abidin ZZ, Abdul-Rashid S, Yassin FM, Noor ASM, et al., Synthesis and Characterization of Fluorescent Carbon Dots from Tapioca, ChemistrySelect, 4 (14) 2019 4140–4146.
CrossRef - Sharma A & Das J, Small molecules derived carbon dots: Synthesis and applications in sensing, catalysis, imaging, and biomedicine, J Nanobiotechnology, 17 (1) 2019 1–24.
CrossRef - Ghann W, Sharma V, Kang H, Karim F, Richards B, et al., The synthesis and characterization of carbon dots and their application in dye sensitized solar cell, Int J Hydrogen Energy, 44 (29) 2019 14580–14587.
CrossRef - Li X, Yu L, He M, Chen C, Yu Z, et al., Review on carbon dots: Synthesis and application in biology field, BMEMat, 1 (4) 2023.
CrossRef - Xia C, Zhu S, Feng T, Yang M, & Yang B, Evolution and Synthesis of Carbon Dots: From Carbon Dots to Carbonized Polymer Dots, Adv Sci, 6 (23) 2019.
CrossRef - Wang L & Zhou HS, Green synthesis of luminescent nitrogen-doped carbon dots from milk and its imaging application, Anal Chem, 86 (18) 2014 8902–8905.
CrossRef - Khairol Anuar NK, Tan HL, Lim YP, So’aib MS, & Abu Bakar NF, A Review on Multifunctional Carbon-Dots Synthesized From Biomass Waste: Design/ Fabrication, Characterization and Applications, Front Energy Res, 9 (April) 2021 1–22.
CrossRef - Kaviyarasu K, Manikandan E, & Maaza M, Synthesis of CdS flower-like hierarchical microspheres as electrode material for electrochemical performance, J Alloys Compd, 648 2015 559–563.
CrossRef - Pytlakowska K, Kita A, Janoska P, Połowniak M, & Kozik V, Multi-element analysis of mineral and trace elements in medicinal herbs and their infusions, Food Chem, 135 (2) 2012 494–501.
CrossRef
 PlumX:
  Views: 542 Views
  PDF Downloads: 109
 Accepted on: 21 Nov 2025
Second Review by: Dr. Mukhan Wati
Final Approval by: Dr. Tawkir Sheikh


ISSN Online: 2231-5039