Structural and Dissolution Behaviour of Phosphate-Silicate Glass Fertilizer Containing Calcined Red Gypsum for Controlled Nutrient Release
 ,Mohd Faiz bin Hassan 1,2, Mazidah binti Mamat1,2and Mohd Al Amin bin Muhamad Nor1,2*
1Faculty of Science and Marine Environment, Universiti Malaysia Terengganu, 21030 Kuala Nerus, Terengganu, Malaysia
2Advanced Nano Materials Research Interest Group (ANOMA), Faculty of Science and Marine Environment, Universiti Malaysia Terengganu, Kuala Nerus, Terengganu, Malaysia.
Corresponding Author E-mail: al_amin@umt.edu.my
DOI : http://dx.doi.org/10.13005/ojc/420421
Download this article as:

Malaysia produced approximately 400,000 tons of red gypsum (RG) annually as a byproduct from titanium dioxide. RG is rich in iron content and can cause environmental challenges due to large-scale disposal. This study investigates phosphate-silicate glass fertilizer with the addition of calcined red gypsum (CRG) replacing calcium oxide at 0 to 20 wt.%. Glass fertilizer is synthesized using a conventional glass melting process with slow cooling and characterized with multi-techniques. The addition of CRG into the glass matrix shows a progressive increase of bulk density from 0.93 to 1.73 g/cm3 and reduced apparent porosity from 37.4% to 20.7%. The formation of β-tricalcium and calcium silicate glass-ceramic phases is identified by XRD analysis with sharp peaks and crystalline phases. After 13-week dissolution testing, glass fertilizer with a low addition of CRG content (0 to 5 wt.%) released nutrients rapidly, while glass fertilizer containing 10 to 20 wt.% CRG showed slower and more controlled release fertilizer. Despite all samples of glass fertilizer, the 10 wt.% CRG formulation showed the best overall analysis because of controlled K+ release while Fe3+ and Al3+ sustained release within safe limits. These indicate that CRGs can effectively be added into phosphate-silicate glass fertilizer to achieve structural stability and valorize RGs as a byproduct that is suitable for agricultural use.
KEYWORDS:Calcined Red Gypsum; Controlled-Release Fertilizer; Dissolution Behaviour; Glass Fertilizer; Industrial Waste Valorization
Introduction
Fertilizers are important to agriculture for sustaining high crop yields compared to conventional soluble fertilizers, which often have more negative effects. Leaching, runoff, and volatilization cause a significant amount of fertilizer loss due to the rapid dissolution of nutrients. Besides wasting money, this practice also causes major environmental issues, such as soil deterioration and eutrophication.1 Controlled-release fertilizers (CRFs) are an innovation to prevent this problem and also can release nutrients gradually in accordance with plant needs.2
One potential kind of CRF is glass fertilizer. Essential macronutrients (K, P, Mg, S, Ca) and micronutrients (B, Fe, Mo, Cu, Zn, Mn) are incorporated into a silicate-based matrix. The beauty of glass fertilizers is that we can adjust the rate at which the nutrients are released by simply altering the composition of the glass, such as K2O,3 Na2O and K2O4 and Fe2O3 .5A layer of hydrated gel develops on the surface of the glass when it comes into contact with moisture. Next, nutrients are released by network dissolution and ion exchange, which is influenced by soil conditions, pH, and temperature.6 Furthermore, high silica content may enhance the stress tolerance of plants and strengthen plant cell walls.7
There is increasing interest in incorporating industrial byproducts into glass fertilizer production as part of circular economy principles. One such material is red gypsum (RG), an iron-rich byproduct of the sulfuric acid digestion of ilmenite during the production of titanium dioxide. Venator Asia Sdn. Bhd. produced approximately 400,000 tons of RG in Kemaman, Terengganu, Malaysia.7 RG mainly consists of calcium sulphate (~70 wt.%) and iron oxide (~30 wt.%), and it is classified as scheduled waste (SW205) due to huge-scale stockpiling, and this raises concerns for sulphate leaching, soil acidification, heavy metal pollution, and health risks related to dust.8
Calcining RG at 900℃ is to remove water bound and turn hydrated calcium sulphate into anhydrous anhydrite to reduce leachability is a treatment for RG before use as a secondary material in glass fertilizer. The addition of calcined red gypsum (CRG) in a phosphate-silicate glass matrix makes the vitrification process prevent contaminants. The calcination process transformed RG into a valuable new product and addresses the waste problem.
RG has been explored in several studies by researchers, such as applications in cement production,9 soil amendment.10 CO2 capture,11 and catalysis, 12 but RG incorporation in glass fertilizer systems remains unexplored by researchers. Therefore, the objectives of this study are to replace CaO with CRG at 0 to 20 wt.% in a phosphate-silicate glass fertilizer system and to study how these substitutions affect glass structure, physical properties, and the kinetics of ion release. To the best of our knowledge, this is the first study to examine the purpose of CRG in phosphate-silicate glass fertilizer structure and dissolution testing for 13 weeks and as a potential for industrial byproduct valorization and designing controlled-release fertilizers.
Materials and Method
Red Gypsum Sampling and Preparation
RG was supplied from Venator Asia Sdn Bhd, Teluk Kalong, Kemaman, Terengganu, Malaysia. The RG sample was air-dried for 3 days and dried in an oven at 80℃ overnight to eliminate moisture. Then, RG was ground in a Planetary Ball Mill (PM100, Retsch GmbH, Germany) using a 10:1 ball-to-powder weight ratio at 250 rpm for one hour to obtain homogeneous particle sizes of ≤63 µm. 50 g of ground RG was placed in an alumina (Al2O3) crucible and calcined at 900℃ with a heating rate of 5℃/min and a two-hour holding period to complete phase transformation to anhydrous CaSO4. The calcined red gypsum (CRG) was cooled to room temperature and immediately covered to prevent rehydration and contamination.
Preparation of Calcined Red Gypsum Glass Fertilizer (CRG-GF)
CRG-GF samples were synthesized using a conventional melt-derived glass technique, in which batches of sample were melted at 1300°C for one hour holding period, and subsequently cooled to room temperature to minimize residual thermal stress and promote homogeneous glass formation. A phosphate-silicate glass system with the general formula Na2O-K2O-(20- )CaO- CRG-Al2O3-SiO2-P2O5 was developed, where represents the weight percentage of CRG substituting CaO at 0, 5, 10, 15, and 20 wt.%. The baseline composition (0% CRG) was adopted from Ersundu et al. (2022) as the control. Batch compositions were homogeneously mixed andcharged into alumina crucibles before melting. The chemical compositions of all CRG-GF samples are presented in Table 1.
Table 1: Chemical composition (wt.%) of CRG-GF samples with varying calcined red gypsum (CRG) substituted with CaO
|
Sample |
Na2O | K2O | CaO | CRG | Al2O3 | SiO2 |
P2O5 |
|
0% CRG |
12.5 | 12.5 | 20 | 0 | 5 | 5 |
45 |
|
5% CRG |
12.5 | 12.5 | 15 | 5 | 5 | 5 |
45 |
|
10% CRG |
12.5 | 12.5 | 10 | 10 | 5 | 5 |
45 |
|
15% CRG |
12.5 | 12.5 | 5 | 15 | 5 | 5 |
45 |
|
20% CRG |
12.5 | 12.5 | 0 | 20 | 5 | 5 |
45 |
Note: CRG=calcined red gypsum; all values are in wt.%
Density and Porosity Measurements
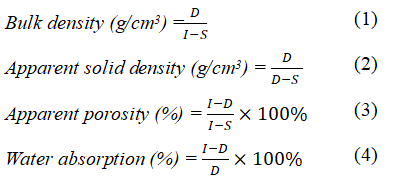
Bulk density, apparent solid density, apparent porosity, and water absorption of CRG-GF samples were determined by Archimedes’ principle in accordance with ASTM C373-14 .13 Each sample was vacuum-dried for 30 minutes, weighed dry (D), fully saturated in distilled water for 24 hours, and then weighed suspended in water (S) and in saturated surface-dry condition (I). Equations (1) to (4) define the physical properties determined:
Characterization of CRG-GF
Fourier Transform Infrared Spectroscopy (FTIR)
Functional groups in CRG-GF samples were identified by ATR-FTIR spectroscopy using a Bruker Tensor 27 spectrometer equipped with a diamond ATR crystal. Spectra were collected over the wavenumber range 400-4000 cm-1 at a resolution of 4 cm-1 with 32 scans per spectrum.
X-ray Diffraction (XRD)
Phase composition was determined using a Rigaku Smart Lab X-ray diffractometer operated at 40 kV and 30 mA. Finely ground CRG-GF powders were scanned over 2θ = 10°–80° at a scan rate of 2°/min with Cu Kα radiation. Phase identification was conducted using the ICDD PDF-2 database.
Scanning Electron Microscopy (SEM)
The surface and cross-sectional morphology of CRG-GF samples were examined using a Tescan Vega SEM operated at 15 kV. Samples were oven-dried at 60°C, mounted on aluminium stubs with carbon adhesive tape, and sputter-coated with gold to minimize charging effects. Imaging was performed at magnifications of 2000× to evaluate the microstructural evolution, pore distribution, and crystalline morphology as a function of CRG content in glass fertilizer structure.
Dissolution Study
Dissolution behaviour of CRG-GF was tested using static immersion, following the methodology described in previous studies of phosphate glass dissolution,3-5,14 19.0 g of glass fertilizer sample (1 mm of particle size) immersed in 190 mL of deionized water using a solid-to-liquid ratio of 1:10 w/v for 13 weeks at 25 ± 2℃ under static conditions. At predetermined intervals (24 hour and weekly thereafter), the pH solution, electrical conductivity (EC), and total dissolved solids (TDS) were measured using a calibrated Hanna Combo meter (HI 98129). Before each measurement, the bottles were gently shaken to ensure the homogeneous solution.
ICP-OES Elemental Analysis
Potassium ion (K+), aluminium ion (Al3+), and iron ion (Fe3+) concentrations in leachates were measured using Inductively Coupled Plasma Optical Emission Spectrometry (ICP-OES), PerkinElmer Avio 200. 0.45 µm syringe filters were used to filter aliquots (10 mL) and diluted as needed before analysis. A 100 mg/L multi-element ICP standard solution (Merck CertiPUR®, Cat No. 1.09492.0100) was used for instrument calibration before sample analysis. Every ICP-OES analysis was carried out in triplicate.
Results and Discussion
Physical Observation of CRG-GF
Figure 1 shows the visual analysis of CRG-GF outer surfaces. The 0% CRG control showed a smooth, compact surface with few visible pores. Samples gradually showed more surface roughness and heterogeneity as the CRG level increased. The 20% CRG sample had a noticeably rough, porous, and darker texture that was consistent with a higher Fe2O3 content. Higher CRG levels resulted in progressively open, sponge-like microstructures with interconnected voids, whereas internal cross-sections shown in Figure 2 verified that the control was packed with few voids. A highly porous interior structure was seen at 20% CRG, which was explained by the evolution of SO3 gas during melting as sulphate broke down at high temperatures.
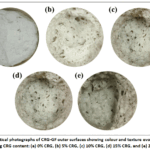 |
Figure 1: Optical photographs of CRG-GF outer surfaces showing colour and texture evolution with increasing CRG content: (a) 0% CRG, (b) 5% CRG, (c) 10% CRG, (d) 15% CRG, and (e) 20% CRG |
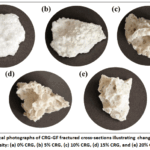 |
Figure 2: Optical photographs of CRG-GF fractured cross-sections illustrating changes in internal porosity: (a) 0% CRG, (b) 5% CRG, (c) 10% CRG, (d) 15% CRG, and (e) 20% CRG Click here to View Figure |
Density and Porosity of CRG-GF
The physical characteristics of every CRG-GF composition are shown in Table 2. Bulk density increased progressively from 0.93 g/cm3 (0% CRG) to 1.73 g/cm3 (20% CRG), whereas apparent porosity dropped from 37.4% to 20.7%, and water absorption correspondingly diminished. These patterns signify progressive structural densification resulting from the integration of CaO and Fe2O3 from CRG, which improves network cross-linking and glass-phase stability during the melting and cooling process.15 producing denser matrices with fewer linked voids. This densification trend is consistent with a previous study that showing Fe2O3, Al2 O3, and CaO act as network stabilizers in phosphate glasses to improve chemical durability.16 The trend of densification corresponds with the microstructural features identified in the SEM analysis.
Table 2: Physical Properties of CRG-GF Samples including Bulk Density, Apparent Density, Apparent Porosity, and Water Absorption
|
Sample Code |
Bulk Density (g/cm3) | Apparent Solid Density (g/cm3) | Apparent Porosity (%) |
Water Absorption (%) |
|
0% CRG |
0.9314 | 1.4883 | 37.4226 | 40.1802 |
| 5% CRG | 1.2082 | 1.7910 | 32.5413 |
26.9334 |
|
10% CRG |
1.2198 | 1.6865 | 27.6738 | 22.6880 |
| 15% CRG | 1.3636 | 1.8164 | 24.9306 |
18.2833 |
|
20% CRG |
1.7262 | 2.1779 | 20.7421 |
12.0159 |
Microstructural and Morphological Observation by SEM analysis
Figure 3 shows SEM analysis at 2000× magnification for 5 sample of CRG-GF. Control sample (0% CRG) showed glassy fracture with small porosity, while 10% CRG sample showed features with crystalline structure. High-CRG compositions (15-20%) showed dense crystallinity with a few empty areas, indicating of glass-ceramic structure.
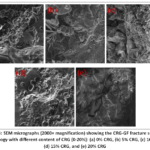 |
Figure 3: SEM micrographs (2000× magnification) showing the CRG-GF fracture surfaces morphology with different content of CRG (0-20%): (a) 0% CRG, (b) 5% CRG, (c) 10% CRG, (d) 15% CRG, and (e) 20% CRG. |
The trend of densification corresponds with the microstructural features identified in the SEM analysis. The microstructural evolution observed in SEM shows the interconnected pores in the control (0% CRG), which allowed rapid ion release, and the isolated void (20% CRG) easy to trap nutrients. Therefore, 10% CRG shows the ideal balance with enabling slow, steady nutrient release over time, which is an attribute of controlled-release fertilizer.14
Fourier Transform Infrared Spectroscopy (FTIR) Analysis
Figure 4 shows FTIR spectra of CRG-GF samples with varying CRG content (0-20%). All spectra revealed absorption bands of the phosphate-silicate glass network. Table 3 shows the assignment of seven absorption regions (A-G) identified in CRG samples.
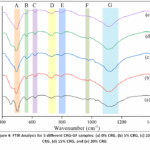 |
Figure 4: FTIR Analysis for 5 different CRG-GF samples: (a) 0% CRG, (b) 5% CRG, (c) 10% CRG, (d) 15% CRG, and (e) 20% CRG Click here to View Figure |
Table 3: Assignment of FTIR absorption bands identified in CRG-GF samples
|
Label |
Wavenumber (cm-1) | Functional Group | Probable Compound |
References |
|
A |
496.92 | Si-O-Si bending vibration | Silicate network deformation |
[6], [14] |
|
B |
564.38 | P-O-P symmetric bending/ Ca-O stretching | Calcium phosphate units (Ca3(PO4)2) |
[17] |
|
C |
620.11 | Al-O stretching/ SO42- bending vibration | Aluminosilicate and sulphate groups from red gypsum (CaSO4) |
[18] |
|
D |
730.99 | O-P-O bending vibration | Phosphate tetrahedra linkage |
[19] |
|
E |
793.63 | Non-bridging oxygen (NBO) Si-O- stretching | Network modifier (Na+, K+, Ca2+) disrupting Si-O-Si |
[20] |
|
F |
974.04 | Symmetric stretching of P-O and Si-O bonds | Phosphate and silicate structural units |
[21] |
|
G |
1124.27 | Asymmetric stretching of Si-O-Si and P-O bonds | Silicate and phosphate network ((SiO4)4-, (PO4)3- tetrahedra) |
[14], [22] |
XRD Analysis
Figure 5 shows XRD analysis for CRG-GF with a crystalline peak trend with increasing CRG content. All samples exhibited sharp diffraction peaks at 2θ = 22.6° (111), 27° (003/201), 32° (112), and 37° (202), corresponding to β-tricalcium phosphate (β-Ca3(PO4)2) and calcium silicate (CaSiO3) phases.9,23
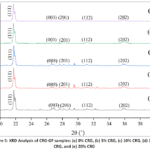 |
Figure 5: XRD Analysis of CRG-GF samples: (a) 0% CRG, (b) 5% CRG, (c) 10% CRG, (d) 15% CRG, and (e) 20% CRG Click here to View Figure |
XRD analysis confirmed the formation of glass-ceramic (β-tricalcium phosphate and calcium silicate) phases in all CRG-GF samples. This behaviour is assigned to the controlled slow-cooling process, which indicates nucleation and crystal growth from the CaO-SiO2-P2O5 system with the addition of network modifier content.14,18 As CRG increases, XRD peaks become sharper because of the higher CaO and Fe2O3 content, and this reduces the melt viscosity and structural rearrangement after the cooling process [24], resulting in glass fertilizer dissolved into the glass structure and becoming glass-ceramic. The crystallization behaviour similar that reported for other CaO-SiO2-P2O5-based glass systems, such as whitlockite, wollastonite, and related calcium silicate and calcium phosphate phases that crystallize on slow cooling, yielding a porous, fine, and glass-ceramic microstructure.25
pH, Electrical Conductivity (EC), and Total Dissolved Solids (TDS) of immersion CRG-GF Samples after 13-week Dissolution
Figure 6 shows the pH value of CRG-GF samples for dissolution at 13 weeks. In early weeks, weeks 1-3, all samples show a pH value decrease, indicating that ion reactions are leached from the glass matrix from the solution [10]. After initial phases, the pH value became stable. However, CRG-GF samples with higher CRG content (10-20%) stabilized at low pH values, and this indicates that the addition of CRG alters the dissolution behaviour toward higher acidity.
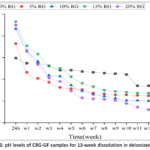 |
Figure 6: pH levels of CRG-GF samples for 13-week dissolution in deionized water Click here to View Figure |
Figure 7 shows the value of electrical conductivity (EC) of CRG-GF samples for 13 weeks. All samples show a gradual increase in EC value, which indicates nutrient release. Samples with low CRG (0-5%) show maximum EC response with the control (0% CRG) exceeding 17,000 µS/cm and 5% CRG exceeding 15,000 µS/cm at week 13. The 10% CRG sample shows 12,000 µS/cm showing a linear and controlled release compared to lower CRG samples. High CRG samples (15-20%) show sharply decreased EC value.
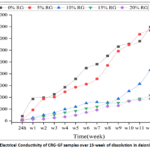 |
Figure 7: Electrical Conductivity of CRG-GF samples over 13-week of dissolution in deionized water Click here to View Figure |
Figure 8 shows the total dissolved solids (TDS) value, which mirrors the pattern of the EC graph. The control (0% CRG) showed over 8,000 ppm, while 5% CRG showed almost 7,500 ppm at week 13. The 10% CRG shows a moderate value of TDS 5,500 ppm which indicates a balance of dissolution rate of nutrient release without over-leaching. High CRG samples (15-20% CRG) show the lowest TDS values, with 20% CRG showing almost 4,200 ppm.
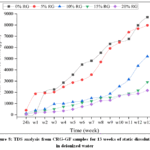 |
Figure 8: TDS analysis from CRG-GF samples for 13 weeks of static dissolution in deionized water Click here to View Figure |
Dissolution studies for 13 weeks in deionized water show the pattern of the graph is composition-dependent for pH, EC, and TDS values. The control (0% CRG) shows rapid ion release, while higher content of CRG (15-20%) shows slow and restricted release. 10% CRG demonstrated good performance, with moderate values of EC and TDS. Glass dissolution started in initial phases in which alkali ions are leached from the glass matrix and substituted with ion H+ from the solution, showing the fast reaction of ion-exchange. Next, the reaction of ion-exchange turns into diffusion-controlled dissolution from the formation of a gel layer.7 Calcium oxide (CaO) has calcium ions (Ca2+) that neutralize hydrogen ions (H+). This process showed that the addition of CRG gives impact to the dissolution testing. These two phases of the dissolution process happen because of how the glass is built, which at first, ions burst quickly. Then, the nutrients show slower diffusion and indicate controlled-release which is consistent with the mechanism described for silicate-phosphate glass for agriculture. The release is controlled by the concentration of protonated species in solution and by the degree of network connectivity in the glass.26
Elemental Analysis by ICP-OES
Potassium Ion (K+) Release
Figure 9 shows the potassium ion (K+) release for a duration of 13 weeks. The control sample (0% CRG) shows the rapid release of K+, while the 5% CRG sample shows moderate release (~1,200 ppm) at week 13. Higher CRG content (10-20%) demonstrated values of 700 ppm, 360 ppm, and 480 ppm. For K+ release in the control sample (0% CRG) shows rapid release because of open porous glass and dissolves easily in deionized water, the same as conventional soluble fertilizer.27 For 10% CRG, show optimal K+ release for 13 weeks, and this matches plant growth perfectly, which prevents the potassium from wasting in the soil but still manages the crops to get enough nutrients for the entire growing season.28 The graph of potassium release mirrors the trend observed in other phosphate glass fertilizers, where increasing the ratio of network-modifying oxides to alkali content makes the dissolution rate slower by reducing depolymerization of the structure of the phosphate chain.29
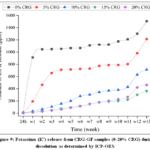 |
Figure 9: Potassium (K+) release from CRG-GF samples (0-20% CRG) during dissolution as determined by ICP-OES Click here to View Figure |
Aluminium ion (Al3+) release
All samples exhibited comparatively low Al3+ concentrations (<120 ppm at week 13), as shown in Figure 10. The control (0% CRG) had the lowest Al emission, approximately 70 ppm at week 13. Intermediate CRG levels (5-15%) exhibited a marginal increase in Al3+ release, due to the partial breakdown of the aluminosilicate network caused by Fe3+ incorporation. The 20% CRG sample exhibited a significant late-stage increase post-week 9, indicating progressive degradation of the iron-aluminium crystalline phases and implying a two-phase dissolution process. For Al3+, aluminium’s role is acting as a network former that forms strong Al-O-Si and Al-O-P bonds.30 From an agricultural perspective, the observed Al3+ release rates are formulated to be plant safe. In acidic soil, regulated Al3+ release may potentially stabilize phosphate and regulate pH.31
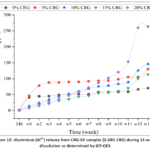 |
Figure 10: Aluminium (Al3+) release from CRG-GF samples (0-20% CRG) during 13-week dissolution as determined by ICP-OES Click here to View Figure |
Iron ion (Fe3+) release
Figure 11 shows the iron ion (Fe3+) release for 13-week dissolution testing and analysis using ICP-OES. The control sample (0% CRG) exhibited minimal Fe3+ leakage (~70 ppm) probably due to trace iron impurities. The 5% and 10% CRG samples exhibited moderate, steady Fe3+ release (90-150 ppm by week 13). For higher CRG (15% and 20%) release two types of patterns which initial burst release and an accelerated release after weeks 9 and 10 (>280 ppm for 10% CRG). The last Fe3+ observed in this study because iron is a vital micronutrient for chlorophyll synthesis and enzymatic functions in plants and a critical element introduced by CRG substitution.32 10% CRG samples exhibited moderate, steady Fe3+ release, demonstrating appropriateness for sustained micronutrient enrichment and consistency with Fe3+ being effectively incorporated into the glass matrix rather than existing as easily leachable surface coatings.33
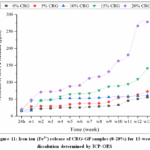 |
Figure 11: Iron ion (Fe3+) release of CRG-GF samples (0-20%) for 13-week dissolution determined by ICP-OES Click here to View Figure |
Conclusion
In conclusion, this study successfully investigated phosphate-silicate glass fertilizer by incorporating 0-20 wt.% of CRG, which replaced CaO in the glass system. The overall result in this study indicated that an increase of CRG made the structure of glass become denser and more crystalline while still maintaining the stability of the phosphate-silicate network. From dissolution testing over 13-weeks, the nutrient release shows that the incorporation of CRG influences how quickly nutrients are released. Low CRG content shows rapid nutrient release, while higher content of CRG shows slow release because of glass structure.
The 10 wt.% CRG showed the best performance among all the CRG-GF formulations. This is because it showed a 53% reduction in K+ compared to the control sample and a sustained release of K+ (~700 ppm), Fe3+ (~150 ppm) and Al3+ (below 120 ppm), which are still at the safe levels for plants needed for the 13-week study.
In addition, 10% CRG demonstrated good nutrient-release performance, which this formulation gives a practical way to recycle the RG byproduct, non-hazardous industrial waste (SW205), and valorize it into safe and value-added agricultural fertilizer. This formulation contributed to industrial waste prevention and promoting sustainable nutrient recycling in fertilizer manufacturing. This approach contributed to conventional melt-derived glass fertilizer processing and promoting economic and environmental benefits compared to conventional soluble fertilizer by reducing nutrient loss through leaching and water runoff. Future studies need to focus on field testing using real agronomic conditions and long-term toxicity tests to confirm the glass fertilizer’s efficiency, safety, and economic commerciality of CRG-GF as a controlled-release fertilizer.
Acknowledgement
The authors would like to thank the Faculty of Science and Marine Environment, Universiti Malaysia Terengganu (UMT), for providing laboratory facilities and technical support. The authors also acknowledge all staff and colleagues for the assistance and support throughout this research.
Funding Sources
This research was supported by the Ministry of Higher Education, Malaysia financial support of Fundamental Research Grant Scheme (FRGS) with Grant No. FRGS/1/2023/STG05/UMT/02/11
Conflict of Interest
The author(s) do not have any conflict of interest.
Data Availability Statement
This statement does not apply to this article.
Ethics Statement
This research did not involve human participants, animal subjects, or any material that requires ethical approval.
Informed Consent Statement
This study did not involve human participants, and therefore, informed consent was not required.
Authors’ Contributions
Fatin ‘Aqilah Mazlan contributed to conducting the experiments, analyzing data, and preparing the manuscript.
Mohd Al Amin Muhamad Nor contributed to supervising the research, reviews the manuscript, and acts as the corresponding author.
Mazidah Mamat and Mohd Faiz Hassan contributed to data analysis and manuscript revision. All authors read and approved the final manuscript.
References
- Shaviv, A.; Mikkelsen, R. L. Controlled-release fertilizers to increase efficiency of nutrient use and minimize environmental degradation – A review. Fertilizer Research. 1993, 35, 1-12
CrossRef - Vejan, P.; Khadiran, T.; Abdullah, R.; Ahmad, N. Controlled release fertilizer: A review on developments, applications and potential in agriculture. Journal of Controlled Release. 2021, 339, 321-334
CrossRef - Mohamad, S. H.; Nor, M. A. A. M. Effect of K2O contents on the releasing of nutrient ions from phosphate glass system. Key Engineering Materials. 2017, 723, 545-550
CrossRef - Muhamad Nor, M. A. A.; Mohamad, S. H. Effect of Na2O and K2O on the solubility and chemical properties of P2O5 – CaO – Na2O – K2O – Al2O3 Materials Science Forum. 2017, 888, 146-150
- Muhamad Nor, M. A. A.; Mohamad, S. H. Effect of Fe2O3 contents on the ions release from phosphate-based glass. Materials Science Forum. 2016, 840, 29-33
CrossRef - Labbilta, T.; Ail-El-Mokhtar, M.; Anli M.; Boutasknit A.; Abouliatim Y.; Khouloud M.; Meddich A.; Mesnaoui M. Controlled release fertilizers from phosphate glass-matrix: A new ecological approach to match nutrients release with plant demand. Boletin de la Sociedad Española de Cerámica y Vidrio. 2023, 62, 571-587
CrossRef - Mahazam, N.B.; Syafiqah, N.; Azmi, B. M. Evaluation of physical and chemical properties of red gypsum from Terengganu, Malaysia. International Journal of Engineering Research and Technology. 2016, 5, 433-436
- Fauziah, I.; Zauyah, S.; Jamal, T. Characterization and land application of red gypsum: A waste product from the titanium dioxide industry. Science of The Total Environment. 1996, 188, 243-251
CrossRef - Gazquez, M. J.; Bolivar, J. P.; Vaca, F.; García-Tenorio, R.; Caparros, A. Evaluation of the use of TiO2 industry red gypsum waste in cement production. Cement and Concrete Composites. 2013,37, 76-81
CrossRef - Fauziah, C.I.; Hanani, M.N.; Zauyah, S.; Samsuri, A. W.; Rosazlin, A. Co-application of red gypsum and sewage sludge on acidic tropical soils. Communications in Soil Science and Plant Analysis. 2011, 42, 2561-2571
CrossRef - Azdarpour, A.; Karaei, M. A.; Hamidi, A.; Mohammadian, E.; Honarvar, B. CO2 sequestration through direct aqueous mineral carbonation of red gypsum. Petroleum. 2018,4, 398-407
CrossRef - Mohd, M. H.; Zuhamimi, N. A. S.; Saud, A.S.; Madduluri V. R.; Alshammari, H.; Maniam, G. P. Synthesis of glycerol carbonate from industrial by-products by alcoholysis of urea: Crude glycerol and red gypsum. Fuel. 2024,357, 129774
CrossRef - ASTM C373-14. Standard test method for water absorption, bulk density, apparent porosity, and apparent specific gravity of fired whiteware products, ceramic tiles, and glass tiles. ASTM International: West Conshohocken, PA, USA. 2014, 1-5
- Ersundu, M.C.; Kusu, B.; Ersundu, A.E. Structural properties and dissolution behavior of new generation-controlled release phosphate glass fertilizers. Journal of Non-Crystalline Solids. 2022,576, 121239
CrossRef - Chen, M.; Liu, J.; Wu, Z. Effect of Fe2O3 concentration on the properties of basalt glasses. Journal of Natural Fibers. 2020,19, 575-585
CrossRef - Abd El-Ghany, H.A. Physical and optical characterization of manganese ions in sodium-zinc-phosphate glass matrix. International Advanced Research Journal in Science, Engineering and Technology. 2018, 5, 43-53
CrossRef - Sun, Y.; Zhang, Z.; Liu, L.; Wang, X. FTIR, Raman and NMR investigation of CaO – SiO2 – P2O5 and CaO – SiO2 – TiO2 – P2O5 Journal of Non-Crystalline Solids. 2015,420, 26-33
CrossRef - Wu, H.; Feng, Y.; Li, H.; He, S.; Bian, Z. Red gypsum utilization and acidic wastewater treatment based on metal self-enrichment process. Science of the Total Environment. 2019,691, 9-15
CrossRef - Kumar, B. Phosphate glasses and glass-ceramic for biomaterials. Transactions of the Indian Ceramic Society. 1985,44, 123-127
CrossRef - Sitarz, M. Influence of modifying cations on the structure and texture of silicate-phosphate glasses. Journal of Molecular Structure. 2008,887, 237-248
CrossRef - Massera, J.; Mayran, M.; Rocherullé, J.; Hupa, L. Crystallization behavior of phosphate glasses and its impact on the glasses’ bioactivity. Journal of Materials Science. 2015,50, 3091-3102
CrossRef - Kiwsakunkran, N.; Chanthima, N.; Kaewkhao, J.; Sangwaranateec, N. Composition and structural studies of glass fertilizer. Journal of Physics: Conference 2018,1120, 12016
CrossRef - Cheng, K. L.; Zhu, D. M. On calibration of pH meters. Sensors. 2005,5, 209-219
CrossRef - Pan Liu, H.; Feng Huang, X.; Ping Ma, L.; Li Chen, D.; Shang, B.; Jiang, M. Effect of Fe2O3 on the crystallization behavior of glass-ceramics produced from naturally cooled yellow phosphorus furnace slag. International Journal of Minerals, Metallurgy and Materials. 2017, 24, 316-323
CrossRef - Ercenk, E. The crystallization kinetics of the CaO-SiO2-P2O5-MgO-Al2O3 base glass system. Journal of Non-Crystalline Solids. 2014, 387, 101-106
CrossRef - Berezicka, A.; Sulowska, J.; Szumera, M. Alteration of sulfur bearing silicate-phosphate (agri)glasses in soil environment: structural characterization and chemical reactivity of fertilizer glasses: insights from ‘in vitro’ studies. Molecules. 2025, 30, 1684
CrossRef - El-Damrawi, G.; Hassan, A. K.; Shahboub, A. Characteristic studies on Ag2O – Al2O3 – P2O5 glasses and glass ceramics. Materials Science and Engineering. 2021,264, 114957
CrossRef - Oosterhuis, D. M.; Loka, D. A.; Kawakami, E. M.; Pettigrew, W. T. The physiology of potassium in crop production. Advances in Agronomy. 2014,126, 203-233
CrossRef - Labbilta, T.; Ait-El-Mokhtar, M.; Abouliatim, Y., Khouloud, M.; Meddich, A.; Mesnaoui, M. Innovative formulations of phosphate glasses as ontrolled-release fertilizers to improve tomato crop growth, yield and fruit quality. Molecules. 2021, 26,3928
CrossRef - Hruška, B.; Chromčíková, M.; Nowicka, A.; Macháček, J.; Gombárová, J.; Liška, M. Thermodynamic model and structural analysis of borosilicate glasses for pharmacy. Journal of Thermal Analysis and Calorimetry,2025,DOI: 10.1007/S10973-025-14932-Z.
CrossRef - Haynes, R. J.; Mokolobate, M. S. Amelioration of Al toxicity and P deficiency in acid soils by addition of organic residues: A critical review of the phenomenon and the mechanism involved. Nutrient Cycling in Agroecosystems. 2001,59, 47-63
CrossRef - Morrissey, J.; Lou Guerinot, M. Iron uptake and transport in plants: The good, the bad, and the ionome. Chemical Reviews. 2009,109, 4553-4567
CrossRef - Schmidt, W. Mechanism and regulation of reduction-based iron uptake in plants. New Phytologist. 1999,141, 1-26
CrossRef
 PlumX:
  Views: 409 Views
  PDF Downloads: 124
 Accepted on: 25 Jul 2026
Second Review by: Dr. Akshay Akot
Final Approval by: Dr. Ravindra M Kumbhare


ISSN Online: 2231-5039