Phytochemical Exploration of Stevia rebaudiana: Spectroscopic Characterization of Natural Constituents and Novel Semisynthetic Derivatives (LUM1-LUM7)
 and Shikha Sharma
Department of Pharmaceutical Science, Lords University, Alwar Rajasthan, India.
Corresponding Author E-mail: jpsingh9452@gmail.com
DOI : http://dx.doi.org/10.13005/ojc/420320
Download this article as:

This study successfully isolated stevioside from Stevia rebaudiana leaves via optimized solvent extraction (aqueous, acidic, basic, and alcoholic), followed by purification through rotary evaporation and recrystallization. The isolated stevioside served as a precursor for the synthesis of seven novel semisynthetic derivatives (LUM1–LUM7), chemically modified to introduce diverse functional groups including amino, imino, formyl, carboxylic acid, carbamoyl, anhydride, and ethyl ester moieties. Comprehensive structural elucidation was achieved using Fourier-transform infrared spectroscopy (FTIR), nuclear magnetic resonance (¹H and ¹³C NMR), and mass spectrometry (MS). Spectral analysis confirmed the successful modifications, with key signatures such as ester carbonyl stretches (1720–1750 cm⁻¹ in FTIR), anomeric proton signals (δ 4.5–6.0 ppm in ¹H-NMR), and precise molecular ion peaks (e.g., *m/z* 805.3421 for stevioside and *m/z* 891.3940 for the anhydride derivative LUM6). The generation of this structurally diverse library of steviol glycoside derivatives demonstrates the potential of stevioside as a versatile scaffold for semisynthetic innovation. This work provides a foundational framework for exploring structure-activity relationships, paving the way for the development of enhanced sweeteners and novel bioactive compounds with potential applications in food science, nutraceuticals, and pharmaceutical industries.
KEYWORDS:Stevia rebaudiana; Steviol glycosides; Semisynthetic derivatives; Solvent extraction; Spectral analysis; Structural elucidation
Introduction
Stevia rebaudiana, a perennial shrub native to South America, is renowned for its natural sweetening properties, attributed to steviol glycosides such as stevioside and rebaudiosides. These compounds are up to 300 times sweeter than sucrose and have gained global attention as zero-calorie sugar substitutes. Beyond their role as sweeteners, steviol glycosides exhibit potential therapeutic benefits, including antihypertensive, antidiabetic, and antimicrobial activities, making them valuable for pharmaceutical applications. However, the structural complexity of these glycosides presents opportunities for chemical modifications to enhance their functional properties, solubility, or bioactivity.(Castejón et al., 2019)
This study focuses on the isolation, structural modification, and spectral characterization of steviol glycosides derived from Stevia rebaudiana leaves. Using solvent extraction techniques with water, alcoholic solvents, and acidic/basic solutions, stevioside was isolated and further purified via recrystallization and rotary evaporation. The isolated compound served as a precursor for the synthesis of novel semisynthetic derivatives (LUM1–LUM7), each tailored with distinct functional groups such as amino, amino, formyl, carbamoyl, and anhydride moieties(Abou-Arab, Abou-Arab, & Abu-Salem, 2010).
Advanced spectroscopic techniques—including Fourier-transform infrared spectroscopy (FTIR), nuclear magnetic resonance (NMR; ¹H and ¹³C), and mass spectrometry (MS)—were employed to elucidate the structures of these derivatives. The spectral data revealed key functional groups, molecular weights, and structural conformations, confirming successful modifications. For instance, the presence of ester C=O stretches (1720–1750 cm⁻¹ in FTIR) and anomeric proton signals (δ 4.5–6.0 ppm in ¹H-NMR) underscored the integrity of glycosidic linkages, while mass spectra provided precise molecular ion peaks (*m/z* 805.3421 for stevioside)(Barac et al., 2015).
The structural diversity of these semisynthetic derivatives expands the potential applications of steviol glycosides in food science, nutraceuticals, and medicine. By systematically altering functional groups, this work contributes to a deeper understanding of structure-activity relationships, paving the way for optimized sweeteners or bioactive agents. Furthermore, the methodologies described herein offer a reproducible framework for the derivatization and analysis of natural products.(Elgenaidi, Spiers, & therapeutics, 2019)
This study not only advances the chemistry of steviol glycosides but also highlights their versatility as scaffolds for semisynthetic innovation, aligning with the growing demand for natural, multifunctional compounds in industrial and therapeutic contexts(Ertan, Türkyılmaz, & Özkan, 2019).
Materials and Methods
Plant Material and Solvent Extraction
Powdered leaves of Stevia rebaudiana were used for extraction. The leaves were subjected to multiple solvent extraction procedures involving water, methanol, and ethanol.
Water Extraction: A 1:5 (w/v) ratio of leaf powder to water was used. The mixture was heated to 75–80 °C for 2 hours and allowed to cool. Filtration was done using Whatman filter paper. This process was repeated 13 times to remove all sweetness.
Methanolic Extraction: A 1:10 (w/v) ratio was used. Leaves were soaked in 70% methanol at room temperature for 2 hours. The process was repeated three times.
Ethanolic Extraction: Leaves were soaked in 70% ethanol at a 1:15 (w/v) ratio for 2 hours at room temperature. The process was repeated three times(Chatsudthipong, Muanprasat, & therapeutics, 2009).
Solvent Removal and Concentration
Post-ethanol extraction, rotary evaporation was performed at 40–45 °C with rotation at 80 rpm to remove residual ethanol, yielding a green concentrated solution of stevia extract(Rambo et al., 2019).
Recrystallization
To purify the crystalline products:
Impure solids were dissolved in suitable solvents.
Insoluble were removed via filtration.
Solutions were cooled to crystallize the desired compounds.
Crystals were separated and tested for purity using melting point and spectroscopic methods(Geuns, 2003).
Recrystallization was repeated until the compound was confirmed pure.
Structural Characterization
The isolated and semisynthetic compounds (LUM1–LUM7) were characterized by:
Fourier Transform Infrared Spectroscopy (FTIR) from, (CLIF), University of Kerala)
¹H-NMR (Proton Nuclear Magnetic Resonance) From, Jamia Hamdard University and (CLIF), University of Kerala)
¹³C-NMR (Carbon-13 Nuclear Magnetic Resonance) From, Jamia Hamdard University and (CLIF), University of Kerala)
Mass Spectrometry (MS) From, Jamia Hamdard University
Isolation Procedure
Design of an Experiment for Solvent Extraction the Solvent Extraction technique was used. Stevia rebaudiana powdered leaves were combined with water and various solvents. At room temperature, the extract was allowed to cool. Filtering was used to separate the aqueous extract. For the alcoholic solvent treatment, however, dry powdered stevia leaves were immersed in the solvent for two hours. The For all solvents, the procedure was repeated three times, except for water, it was repeated thirteen times. A particular ratio (1:5) of leaf powder to water (w/v) was measured in the hot water extraction procedure, and the stevia leaves powder was blended with water. This sample was subjected to a temperature range of 75-80 °C for 2 hours at a constant temperature. After the heating procedure was completed, the stevia extract was allowed to cool before being used. Whatman filter paper was used to filter the water. The same process was used to treat the solid component. To eliminate all of the sweetness from the stevia powder, the process was done 13 times. The temperature was controlled in this method using magnetic heating. Basic solvent extract was made by adding a specified ratio (1:10) of leaf powder to Sodium hydroxide solution (w/v) in the same way as water extraction was done. A pH meter was used to determine the ph.This sample was also subjected to a temperature range of 75-80 °C for 2 hours at a constant temperature. After the heating procedure was completed, the stevia extract was allowed to cool before being filtered.(Gasmalla, Yang, & Hua, 2014)
The same process was used to treat the solid component. The process was performed three times, however the sweetness in the stevia powder was not completely gone. The acidic solvent extract was made by combining leaf powder and hydrochloric acid in the same ratio (1:10).
(w/v) acid solution the basic solvent extraction technique was followed. To make an alcoholic solvent extract, a specified ratio (1:10) of leaf powder was soaked in 70% alcohol. Open Access Methanol solution (w/v) at room temperature for 2 hours. The solid half was treated again using the same process after filtering. The process was done three times, but the stevia powder did not lose all of its sweetness. was smaller in size. Using ethanol solution as a solvent, the same method as methanol treatment was carried out by soaking a specified ratio (1:15) of leaf powder in a 70% Ethanol solution (weight to volume) for 2 hours at room temperature. The solution was then filtered. The same process was used to treat the solid component. The process was performed three times to ensure that all of the sweetness from the stevia powder was adequately removed(Gupta, Purwar, Sundaram, & Rai, 2013).
Fridge Drying and Rotary Evaporation To remove ethanol from the green solution generated from the Ethanol extraction procedure, rotary evaporation was used. After that, a green concentrated solution including stevia extract and water was produced. The water bath was heated to 40-45°C and rotated at 80 revolutions per minute. I.C. Stevioside crystals were discovered.(Lemus-Mondaca, Vega-Gálvez, Zura-Bravo, & Ah-Hen, 2012)
Recrystallization
Solid chemical molecules are seldom homogeneous when segregated after extraction. They’re frequently polluted by contaminants produced in the same process as the intended result. Purification of impure crystalline substances is usually achieved with the use of a suitable crystalline solvent or solvent combination. Solids are purified by crystallization using differences in volatility in a particular solvent or a combination of solutions(Kolb, Herrera, Ferreyra, Uliana, & chemistry, 2001).
Solubility contaminated simmering water materials in a solvent system.
Screening to remove insoluble elements and particulate matter from the solution.
Permitting a reaction mixture to cool to the point when the dissolved substance crystallizes
Taking the crystals out of the solution and bringing them to the surface to isolate them from the solvent. Use science or mother-liquor to your advantage. The resultant solid is tested for purity using a melting point determination, a spectroscopic technique, or HPTLC after drying, and if found impure, it is recrystallized with new solvent. The process was carried out again and again until the compound was totally pure. (Baú & Ida, 2015)
Results and Discussion
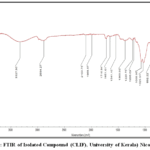 |
Figure 1: FTIR of Isolated Compound (CLIF), University of Kerala)Nicolet iS50 Click here to View Figure |
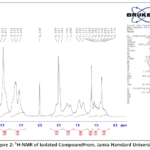 |
Figure 2: 1H-NMR of Isolated CompoundFrom, Jamia Hamdard University Click here to View Figure |
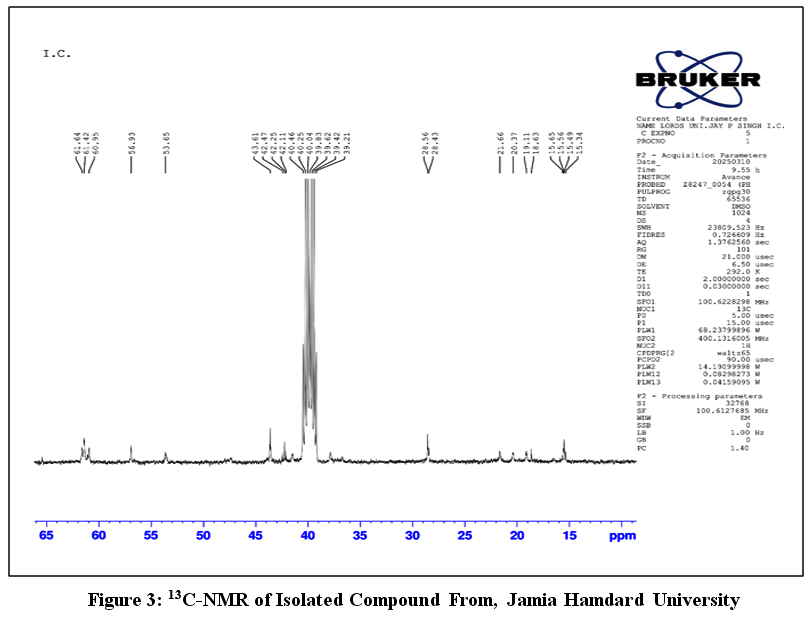 |
Figure 3: 13C-NMR of Isolated Compound From, Jamia Hamdard University Click here to View Figure |
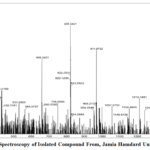 |
Figure 4: Mass Spectroscopy of Isolated Compound From, Jamia Hamdard University (M52). Click here to View Figure |
Interpretation of Isolated compound
Table 1: FTIR Interpretation of Isolated Compound (Lemus-Mondaca et al., 2012)
|
Region (cm⁻¹) |
Functional Group |
|
Obtained peek 3327cm-1 |
O–H stretching (broad, hydrogen-bonded) |
| Obtained peek 2884cm-1 |
C–H stretching (aliphatic) |
|
Obtained peek 1716 cm-1 |
Ester C=O stretching |
| Obtained peek 1641 cm-1 |
C=C stretching (weak, if detectable) |
|
Obtained peek 1388 cm-1 |
O–H bending, CH₂ scissoring |
| Obtained peek 1068 cm-1 |
C–O–C stretching (ethers, esters, pyran rings) |
|
Obtained peek 892 cm-1 |
C–H out-of-plane bending (alkene) |
| < 1000 |
Fingerprint region (complex ring vibrations) |
Table 2: 1H-NMR Interpretation of Isolated Compound(Helle, Hirsjärvi, Peltonen, Hirvonen, & Wiedmer, 2008)
| δ (ppm) | Proton Type | Functional Groups |
| Obtained peek 0.7-2.0 | Aliphatic (CH₃, CH₂) | Saturated hydrocarbons (e.g., steviol backbone). |
| Obtained peek 2.0–3.0 | α to carbonyl/allylic (CH₂) | Adjacent to C=O or C=C (e.g., aglycone methylenes). |
| Obtained peek 3.0-3.68 | O-CH, N-CH (shifted by electronegativity) | Sugar protons (e.g., glycoside O-CH-O). |
| Obtained peek 4.5–6.0, | Anomeric protons (O-CH-O) | Glycosidic linkage protons (e.g., glucose C1-H). |
| Obtained peek 6.0–8.0 | Aromatic/vinyl (C=CH) | Aromatic rings or double bonds (if present). |
| Obtained peek >9.0 | Aldehyde (CHO) or acidic (COOH) | Rare; suggests aldehydes/carboxylic acids. |
Table 3: 13C-NMR Interpretation of Isolated Compound(Zheng, Torres, & Price, 2017)
| δ (ppm) | Carbon Type | Functional Groups |
| Obtained peek 60-61 | C-O (ether/alcohol) | Sugar ring carbons (e.g., glycoside O-CH-O). |
| Obtained peek 53-60 | N-CH₃, O-CH₃ | Methoxy groups (e.g., methyl esters). |
| Obtained peek 40-53 | Aliphatic C-N or C-O | Methylene adjacent to heteroatoms. |
| Obtained peek 39–40 | CH₂ in saturated chains | Steviol backbone or lipid chains. |
| Obtained peek 15–39 | Terminal CH₃ | Methyl groups (e.g., aglycone CH₃). |
Mass Interpretation of Isolated Compound
m/z805.3421-This is the molecular ion (M+H) + of Isolated Compound, Indicate the molecular weight Isolated CompoundPlus proton. This the most intense peak, representing the Isolated Compound molecule itself.
Structural Elucidation of Isolated CompoundBased on interpretation of spectral data, Chemical Formula: C38H60O18, molecular weight 805and M/Z 805.3421Unknow Semisynthetic compound showed that it is a(2R,5R)-3,4,5-trihydroxy-6-(hydroxymethyl)tetrahydro-2H-pyran-2-yl (4R,11bR)-9-(((2S,3S,5R)-4,5-dihydroxy-6-(hydroxymethyl)-3-(((2R,5S)-3,4,5-trihydroxy-6-(hydroxymethyl)tetrahydro-2H-pyran-2-yl)oxy)tetrahydro-2H-pyran-2-yl)oxy)-3,11b-dimethyl-8-methylenetetradecahydro-6a,9-methanocyclohepta[a]naphthalene-4-carboxylate. Comparison of physical parameter Infrared spectroscopy, Proton NMR, Carbon NMR and Mass Spectroscopy with data evaluation.(Prakash, Markosyan, & Bunders, 2014).
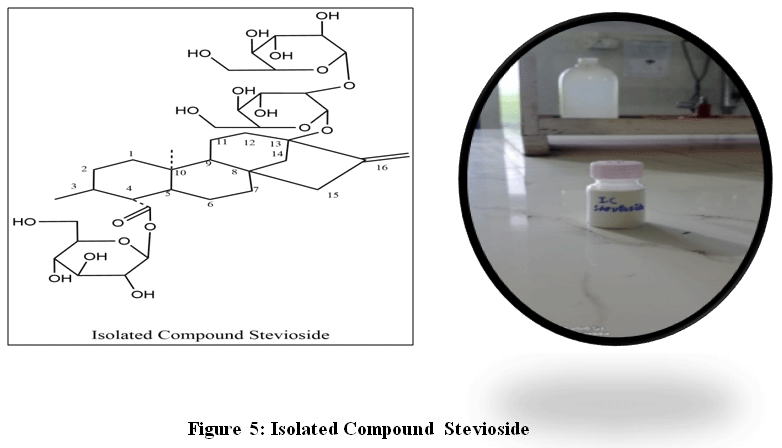 |
Figure 5: Isolated Compound Stevioside Click here to View Figure |
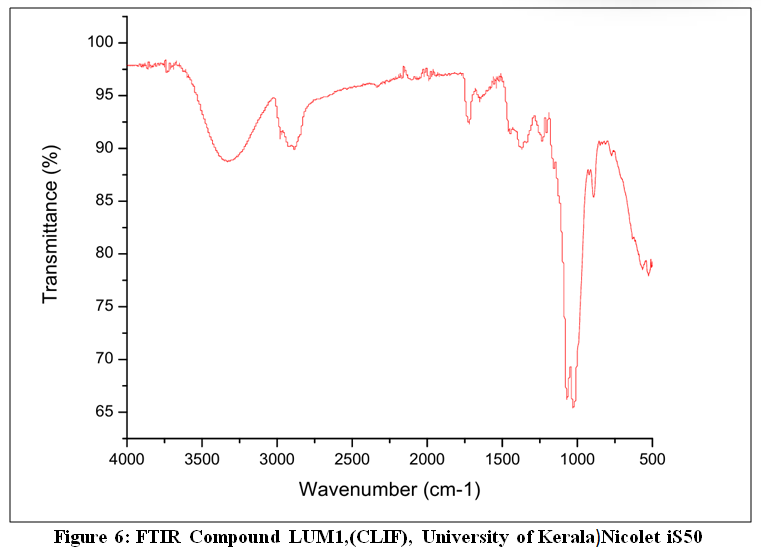 |
Figure 6: FTIR Compound LUM1,(CLIF), University of Kerala)Nicolet iS50 Click here to View Figure |
 |
Figure 7: 1H-NMR Compound LUM1(CLIF), University of Kerala, PROBHD Z108618_0948 Click here to View Figure |
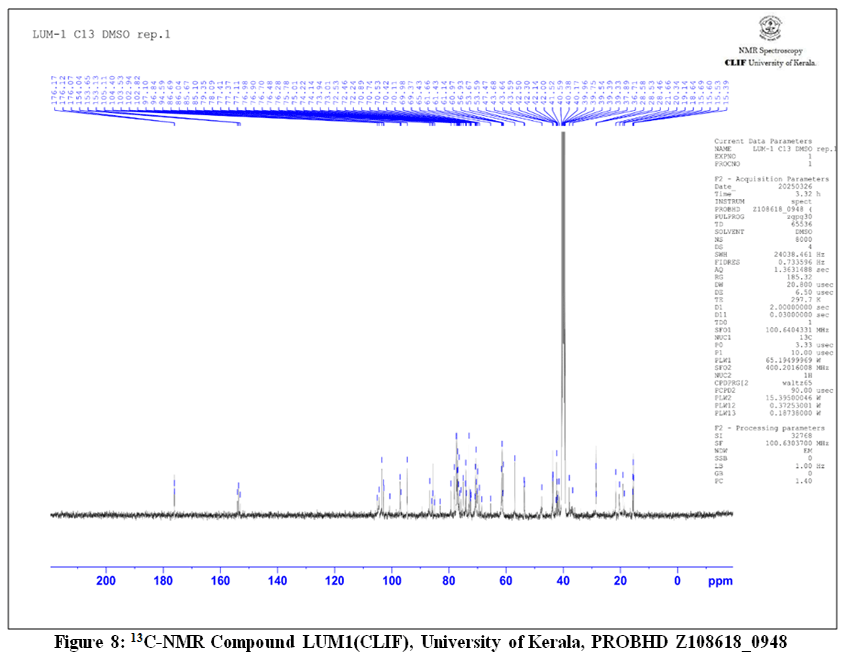 |
Figure 8: 13C-NMR Compound LUM1(CLIF), University of Kerala, PROBHD Z108618_0948 Click here to View Figure |
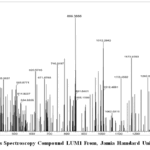 |
Figure 9: Mass Spectroscopy Compound LUM1 From, Jamia Hamdard University (M52) Click here to View Figure |
Spectral analysis and Interpretation of compound LUM1
Spectral data
Table 4: FTIR Interpretation of LUM1 (Ramlagan et al., 2017)
| Region (cm⁻¹) | Functional Group |
| Obtained peek 3450 cm-1 | O–H stretch (broad, H-bonded), N–H stretch (–NH₂) |
| Obtained peek 2884cm-1 | C–H stretch (aliphatic) |
| Obtained peek 1716 cm-1 | Ester C=O stretch (strong) |
| Obtained peek 1610cm-1 | N–H bend (amine) |
| Obtained peek 1388 cm-1 | O–H bend, CH₂ scissoring |
| Obtained peek 1145cm-1 | C–O–C stretch (ethers, glycosidic bonds) |
| < 1000 | Fingerprint region (ring vibrations) |
Table 5A:1H-NMR Interpretation of LUM1 (Labbé et al., 2020)
| Proton Type | δ (ppm) |
| Angular –CH₃ | Obtained peek 0.87–1.1 |
| Methylene (ring fusions) | Obtained peek 1.03–2.50 |
| Anomeric H (sugar 1) | Obtained peek 4.50–5.26 |
| Anomeric H (sugar 2) | Obtained peek 4.74–5.26 |
| –CH₂OH (hydroxymethyl) | Obtained peek 3.48–4.43 |
| –CH–O– (sugar/stero) | Obtained peek 3.06–4.50 |
| –OH (exchangeable) | Obtained peek 4.43–5.26 |
| –NH | ~5.26 |
Table 5B: 13C-NMR Interpretation of LUM1 (Chiocchio, Mandrone, Tomasi, Marincich, & Poli, 2021)
| Carbon Type | Range/ δ (ppm) |
| –CH₃ | 10–25, Obtained peek 15.39-21.66 |
| Aliphatic Ring CH/CH₂ | 20–50, Obtained peek 21.66-47.47 |
| C–NH₂ (C8) | 50–60, Obtained peek 47.47-60.97 |
| Sugar C2–C5 | 65–85, Obtained peek 65.43-85.67 |
| Anomeric C1’/C1’’ | 95–105, Obtained peek 96.84-105.11 |
| Hydroxymethyl (C6 sugars) | 60–65, Obtained peek 60.97-65.43 |
| Ether (C–O–C) | 70–80, Obtained peek 70.11-79.35 |
| Ester C=O | 175–180, Obtained peek 154.04-176.17 |
Mass Spectroscopy of LUM1
m/z806.3888 -This is the molecular ion (M-H)- of LUM1, Indicate the molecular weight LUM1 (-) proton. This the most intense peak, representing the LUM1 molecule itself.
Structural Elucidation of Compound LUM1
Based on interpretation of spectral data, molecular weight 807and M/Z 806.3888 Unknow Semisynthetic compound LUM1 showed that it is a(2R,5R)-3,4,5-trihydroxy-6-(hydroxymethyl)tetrahydro-2H-pyran-2-yl (4R,8R,11bR)-8-amino-9-(((2S,3S,5R)-4,5-dihydroxy-6-(hydroxymethyl)-3-(((2R,5S)-3,4,5-trihydroxy-6 oxy)tetrahydro-2H-pyran-2-yl)oxy)-3,11b-dimethyltetradecahydro-6a,9-methanocyclohepta[a]naphthalene-4-carboxylate -(hydroxymethyl)tetrahydro-2H-pyran-2-yl).Comparison of physical parameter Infrared spectroscopy, Proton NMR, Carbon NMR and Mass Spectroscopy with data evaluation(Pandey, Tripathi, & phytochemistry, 2014).
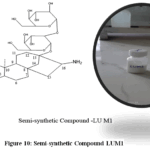 |
Figure 10: Semi-synthetic Compound LUM1 Click here to View Figure |
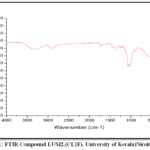 |
Figure 11: FTIR Compound LUM2,(CLIF), University of Kerala)Nicolet iS50 Click here to View Figure |
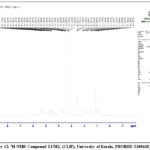 |
Figure 121H-NMR Compound LUM2, (CLIF), University of Kerala, PROBHD Z108618_0948 Click here to View Figure |
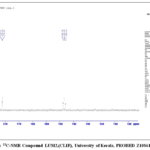 |
Figure 13: 13C-NMR Compound LUM2,(CLIF), University of Kerala, PROBHD Z108618_0948 Click here to View Figure |
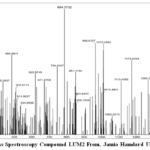 |
Figure 14: Mass Spectroscopy Compound LUM2From, Jamia Hamdard University (M52) Click here to View Figure |
Spectral analysis of compound LUM2
Spectral data
Table 6: FTIR Interpretation of LUM2 (Jiang et al., 2015)
| Region (cm⁻¹) | Assignment |
| 3200–3600, Obtained peek 3125cm⁻¹ | O–H stretch (broad, H-bonded), N–H stretch (–NH) |
| 2850–3000,Obtained peek 2884cm-1 | C–H stretch (aliphatic) |
| 1720–1750,Obtained peek 1716 cm-1 | Ester C=O stretch (strong) |
| 1600–1650, Obtained peek 1635cm-1 | N–H bend (imino) |
| 1400–1450,Obtained peek 1388 cm-1 | O–H bend, CH₂ scissoring |
| 1000–1200,Obtained peek 1068 cm-1 | C–O–C stretch (ethers, glycosidic bonds) |
| < 1000 | Fingerprint region (ring vibrations) |
Table 7: 1H-NMR Interpretation of LUM2(Pól, Hohnová, & Hyötyläinen, 2007)
| Proton Type | Range/ Obtained peekδ (ppm) |
| –CH₃ (3,11b-dimethyl) | 0.8–1.2,Obtained peek 0.8-1.1 |
| Methylene protons (ring fusions) | 1.0–2.5, Obtained peek1.0–2.5 |
| Anomeric H (1st sugar, H1’) | 4.5–5.5, Obtained peek4.5–5.2 |
| Anomeric H (2nd sugar, H1’’) | 4.8–5.5, Obtained peek 4.7-5.02 |
| –CH₂OH (sugar tails) | 3.5–4.0, Obtained peek 3.4-4.4 |
| –CH–O– (sugar/stero) | 3.0–4.5, Obtained peek 3.0-4.5 |
| –OH (exchangeable) | 4.0–6.0, Obtained peek 3.0-5.26 |
| –NH (imino, C16) | 6.0–9.0, Obtained peek 5.0-5.26 |
Table 8: 13C-NMR Interpretation of LUM2 (Prakash et al., 2014)
| High-Field Region (δ 10-50 ppm) | |
| Carbon Type | δ (ppm) |
| -CH₃ (C18, C19 analogs) | 10-15 |
| Aliphatic CH₂ (ring fusions) | 20-40 |
| CH-NH (C8) | 45-55 |
| Mid-Field Region (δ 50-90 ppm) | |
| Carbon Type | δ (ppm) |
| Anomeric C1′ | 95-100 |
| Anomeric C1” | 100-105 |
| Sugar ring C2-C5 | 65-85 |
| CH₂OH (C6 sugars) | 60-65 |
| C-O-C (glycosidic) | 75-85 |
| Low-Field Region (δ 160-180 ppm) | |
| Carbon Type | δ (ppm) |
| Ester C=O | 175-180, Obtained peek 176.07-176.17 |
Mass Spectroscopy of LUM2
m/z 804.3732-This is the molecular ion (M-H)- of LUM2, Indicate the molecular weight
LUM2(-) proton. This the most intense peak, representing the LUM2 molecule itself.
Structural Elucidation of Compound LUM2
Based on interpretation of spectral data, molecular weight 805and M/Z 804.3732Unknow Semisynthetic compound LUM2 showed that it is a (2R,5R)-3,4,5-trihydroxy-6-(hydroxymethyl)tetrahydro-2H-pyran-2-yl (4R,11bR)-9-(((2S,3S,5R)-4,5-dihydroxy-6-(hydroxymethyl)-3-(((2R,5S)-3,4,5-trihydroxy-6-(hydroxymethyl)tetrahydro-2H-pyran-2-yl)oxy)tetrahydro-2H-pyran-2-yl)oxy)-8-imino-3,11b-dimethyltetradecahydro-6a,9-methanocyclohepta[a]naphthalene-4-carboxylate. Comparison of physical parameter Infrared spectroscopy, Proton NMR, Carbon NMR and Mass Spectroscopy with data evaluation.(Ruiz-Ruiz, Moguel-Ordoñez, Segura-Campos, & nutrition, 2017).
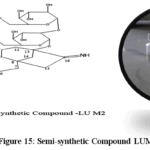 |
Figure 15: Semi-synthetic Compound LUM2 Click here to View Figure |
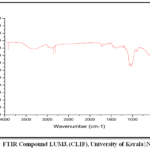 |
Figure 16: FTIR Compound LUM3,(CLIF), University of Kerala)Nicolet iS50 Click here to View Figure |
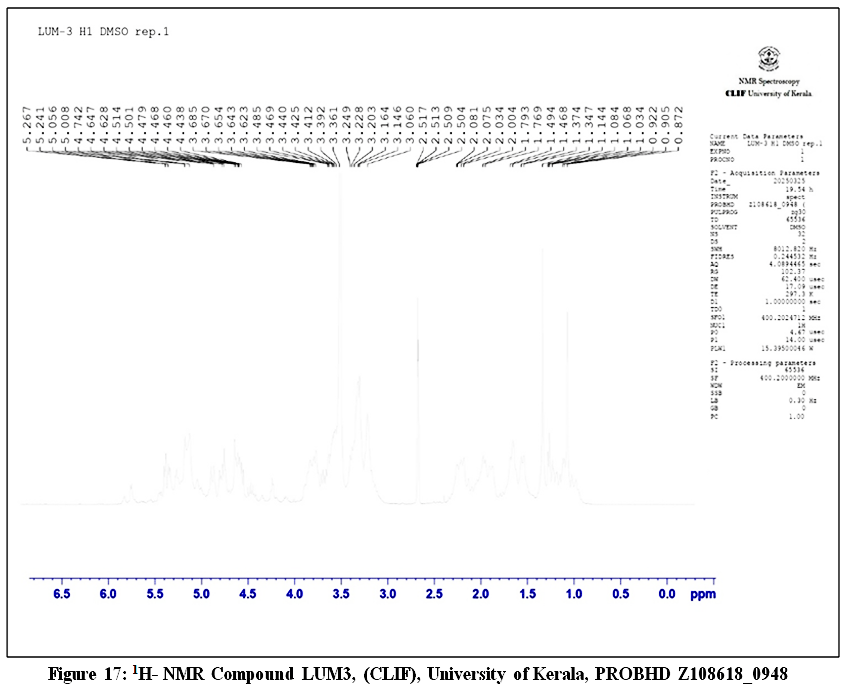 |
Figure 17: 1H- NMR Compound LUM3, (CLIF), University of Kerala, PROBHD Z108618_0948 Click here to View Figure |
 |
Figure 18: 13C-NMR Compound LUM3, (CLIF), University of Kerala, PROBHD Z108618_0948 Click here to View Figure |
 |
Figure 19: Mass Spectroscopy Compound LUM3, From, Jamia Hamdard University (M52). Click here to View Figure |
Spectral analysis of compound LUM3
Table 9: FTIR Interpretation of LUM3 (Puri, Sharma, & Tiwari, 2011)
| Region (cm⁻¹) | Functional Group |
| 2500-3300, Obtained peek 3250 cm⁻¹ | Carboxylic O–H (very broad) |
| 3200-3600, Obtained peek 3383 cm⁻¹ | Alcoholic O–H (broad) |
| 1700-1725, Obtained peek 1720 cm⁻¹ | Carboxylic C=O |
| 1735-1750, Obtained peek 1738 cm⁻¹ | Ester C=O |
| 1200-1300 Obtained peek 1275 cm⁻¹ | Carboxylic C–O |
| 1000-1200, Obtained peek 1130 cm⁻¹ | C–O–C (ethers, glycosidic bonds) |
| 2850-3000, Obtained peek 1068cm⁻¹ | C–H stretch (aliphatic) |
| 1400-1450,Obtained peek 1388cm⁻¹ | O–H bend, CH₂ scissoring |
| <1000 | Fingerprint region |
Table 10: 1H-NMR Interpretation of LUM3 (Ramesh, Singh, & Megeji, 2006).
|
High-Field Region (δ 0.5-2.5 ppm) |
|
| Proton |
δ (ppm) |
|
H-18 |
0.82, Obtained Peek 0.87 |
| H-19 |
1.15, Obtained Peek 1.14 |
|
Ring CH/CH₂ |
1.20-2.30, Obtained Peek 1.34-2.50 |
|
Mid-Field Region (δ 2.5-5.5 ppm) |
|
| Proton |
δ (ppm) |
|
H-8 |
2.95, Obtained Peek 2.51 |
| H-1′ |
4.72, Obtained Peek 4.64 |
|
H-1” |
5.28, Obtained Peek 5.26 |
| H-1”’ |
5.45, Obtained Peek 5.24 |
|
Sugar CH/CH₂ |
3.10-4.40, Obtained Peek 3.14-4.43 |
|
Proton |
δ (ppm) |
|
Exchangeable Protons (δ 4.5-12.0 ppm) |
|
|
CO₂H |
11.2 |
| OH (sugar) |
4.8-6.2, Obtained Peek 4.7-5.2 |
|
OH (steroid) |
5.5-6.5 |
Table 11: 13C -NMR Interpretation of LUM3 (Richman, Gijzen, Starratt, Yang, & Brandle, 1999)
| Region (ppm) | Carbon Type |
| Obtained Peek 10-25 | Methyls |
| Obtained Peek 25-45 | Aliphatic CH/CH₂ |
| Obtained Peek 60-65 | CH₂OH |
| Obtained Peek 70-85 | Sugar CH-O |
| 95-105, Obtained Peek 105.11 | Anomeric |
| Obtained Peek 165-175 | Ester C=O |
| Obtained Peek 175-180 | Acid C=O |
Mass Spectroscopy of LUM3
m/z 835.3677-This is the molecular ion (M-H) -of LUM3, Indicate the molecular weight LUM3 (-) proton. This the most intense peak, representing the LUM3 molecule itself.
Structural Elucidation of Compound LUM3
Based on interpretation of spectral data, molecular weight 835 and M/Z 835.3677Unknow Semisynthetic compound LUM3 showed that it is an (4R,8R,11bR)-9-(((2S,3S,5R)-4,5-dihydroxy-6-(hydroxymethyl)-3-(((2R,5S)-3,4,5-trihydroxy-6oxy)tetrahydro-2H-pyran-2-yl)oxy)-3,11b-dimethyl-4-((((2R,5R)-3,4,5-trihydroxy-6-(hydroxymethyl)tetrahydro-2H-pyran-2-yl)oxy)carbonyl)tetradecahydro-6a,9-methanocyclohepta[a]naphthalene-8-carboxylic acid-(hydroxymethyl)tetrahydro-2H-pyran-2-yl). Comparison of physical parameter Infrared spectroscopy, Proton NMR, Carbon NMR and Mass Spectroscopy with data evaluation.(Ruiz-Ruiz et al., 2017).
 |
Figure 20: Semi-synthetic Compound LUM3 Click here to View Figure |
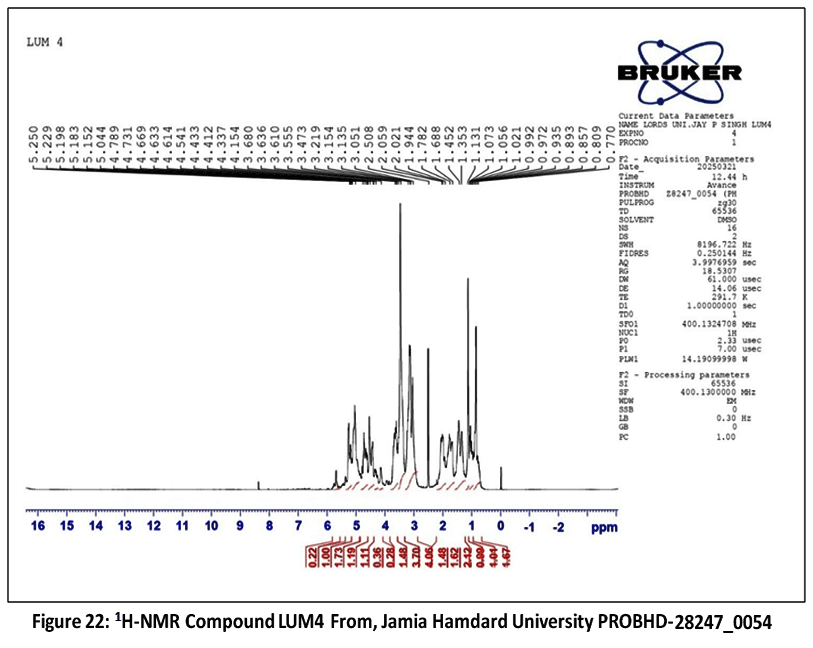 |
Figure 21: FTIR Compound LUM4,(CLIF), University of Kerala)Nicolet iS50 Click here to View Figure |
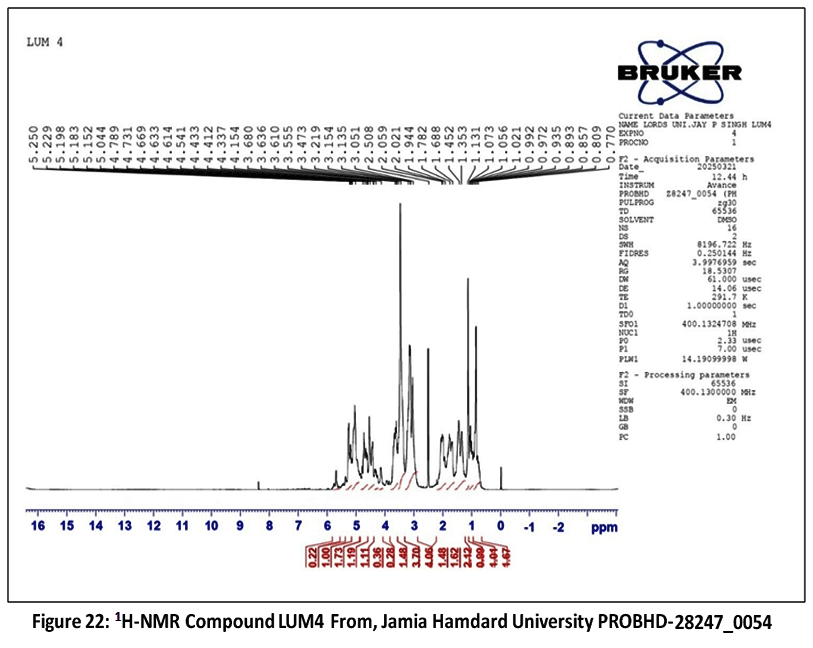 |
Figure 22: 1H-NMR Compound LUM4 From, Jamia Hamdard University PROBHD-Z28247_0054 Click here to View Figure |
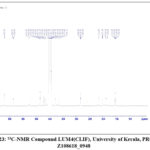 |
Figure 23: 13C-NMR Compound LUM4(CLIF), University of Kerala, PROBHD Z108618_0948 Click here to View Figure |
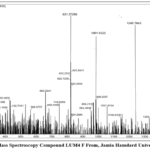 |
Figure 24: Mass Spectroscopy Compound LUM4 FFrom, Jamia Hamdard University (M52) Click here to View Figure |
Spectral analysis of compound LUM4
Spectral data
Table 12: FTIR Interpretation of LUM4 (Ruiz-Ruiz et al., 2017)
| Wavenumber (cm⁻¹) | Functional Group |
| 3200-3600, Obtained Peek 3385 | O-H stretch (broad) |
| 2850-3000, Obtained Peek 2930 | C-H stretch |
| ~2750, Obtained Peek 2750 | Aldehyde C-H stretch |
| 1720-1740 Obtained Peek 1731 | C=O (aldehyde + ester) |
| 1400, Obtained Peek1400 | O-H bend |
| 1000-1200, Obtained Peek 1140 | C-O-C (glycosidic bonds) |
| <1000 | Fingerprint region |
Table 13: 1H-NMR Interpretation of LUM4 (Samuel et al., 2018)
|
High-Field Region (δ 0.5-2.5 ppm) |
|
| Proton |
δ (ppm) |
|
H-18 |
0.88, Obtained Peek 0.89 |
| H-19 |
1.17, Obtained Peek 1.13 |
|
Ring CH/CH₂ |
1.25-2.40, Obtained Peek 1.13-2.50 |
|
Mid-Field Region (δ 2.5-5.5 ppm) |
|
| Proton |
δ (ppm) |
|
H-8 |
3.42, Obtained Peek 3.47 |
| H-1′ |
4.71, Obtained Peek 4.66 |
|
H-1” |
5.30, Obtained Peek 5.25 |
| Sugar CH/CH₂ |
3.15-4.35, Obtained Peek 3.15-4.33 |
|
Characteristic Downfield Signals |
|
|
Proton |
δ (ppm) |
| CHO (C8) |
9.62 |
|
OH (sugar) |
4.7-6.3 |
| OH (steroid) |
5.2-6.5 |
Table 14: 13C-NMR Interpretation of LUM4 (Shukla, Mehta, Bajpai, Shukla, & toxicology, 2009)
| Region (ppm) | Carbon Type |
| 10-25, Obtained Peek 21.66 | Methyl’s |
| 25-45, Obtained Peek 21.66-43.68 | Aliphatic CH/CH₂ |
| 60-65, Obtained Peek 60.97-65.43 | CH₂OH |
| Obtained Peek 70-85 | Sugar CH-O |
| Obtained Peek 95-105 | Anomeric |
| Obtained Peek 170-175 | Ester C=O |
| ~200 | Formyl |
Mass Spectroscopy of LUM4
m/z 821.3728-This is the molecular ion (M+H) + of LUM4, Indicate the molecular weight LUM4 Plus proton. This the most intense peak, representing the LUM4 molecule itself.
Structural Elucidation of Compound LUM4
Based on interpretation of spectral data, molecular weight 820.87and M/Z 821.3728Unknow Semisynthetic compound LUM4 showed that it is a (2R,5R)-3,4,5-trihydroxy-6-(hydroxymethyl)tetrahydro-2H-pyran-2-yl (4R,8R,11bR)-9-(((2S,3S,5R)-4,5-dihydroxy-6-(hydroxymethyl)-3-(((2R,5S)-3,4,5-trihydroxy-6-(hydroxymethyl)tetrahydro-2H-pyran-2-yl)oxy)tetrahydro-2H-pyran-2-yl)oxy)-8-formyl-3,11b-dimethyltetradecahydro-6a,9-methanocyclohepta[a]naphthalene-4-carboxylate. Comparison of physical parameter Infrared spectroscopy, Proton NMR, Carbon NMR and Mass Spectroscopy with data evaluation(Rodrigo, Fagúndez, Serván, & Bartrina, 2015).
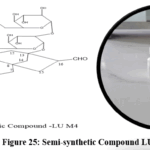 |
Figure 25: Semi-synthetic Compound LUM4 Click here to View Figure |
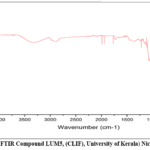 |
Figure 26: FTIR Compound LUM5,(CLIF), University of Kerala)Nicolet iS50 Click here to View Figure |
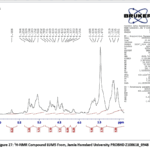 |
Figure 27: 1H-NMR Compound LUM5 From, Jamia Hamdard University PROBHD Z108618_0948 Click here to View Figure |
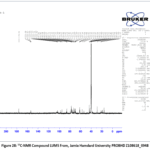 |
Figure 28: 13C-NMR Compound LUM5 From, Jamia Hamdard UniversityPROBHD Z108618_0948 Click here to View Figure |
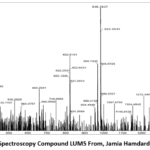 |
Figure 29: Mass Spectroscopy Compound LUM5 From, Jamia Hamdard University (M52) Click here to View Figure |
Spectral analysis of compound LUM5
Spectral data
Table 15: FTIR Interpretation of LUM5 (Singh & Rao, 2005)
| Wavenumber (cm⁻¹) | Assignment |
| 3200-3600, Obtained Peek 3410 | O-H stretch (broad) + N-H stretch |
| 2850-3000, Obtained Peek2884 | C-H stretch |
| 1735-1750,Obtained peek 1716 | Ester C=O stretch |
| 1650-1690,Obtained peek 1680 | Amide I (C=O) |
| 1600-1640,Obtained peek 1630 | Amide II (N-H bend + C-N stretch) |
| Obtained peek 1400 | O-H bend |
| 1000-1200, Obtained peek 1130 | C-O-C (glycosidic bonds) |
| <1000 | Fingerprint region |
Table 16: 1H-NMR Interpretation of LUM5 (Soejarto, Kinghorn, & Farnsworth, 1982)
|
High-Field Region (δ 0.5-2.5 ppm) |
|
| Proton |
δ (ppm) |
|
H-18 |
0.85 |
| H-19 |
1.12 |
|
Ring CH/CH₂ |
1.15-2.30 |
|
Mid-Field Region (δ 2.5-5.5 ppm) |
|
|
Proton |
δ (ppm) |
| H-8 |
Obtained peek 3.05 |
|
H-1′ |
Obtained peek 4.73 |
| H-1” |
Obtained peek 5.25 |
|
Sugar CH/CH₂ |
3.10-4.25, Obtained peek 3.13-4.15 |
|
Characteristic Downfield Signals |
|
| Proton |
δ (ppm) |
|
NH₂ (C8) |
6.85, 7.20 |
| OH (sugar) |
4.6-6.0 |
|
OH (steroid) |
5.0-6.2 |
Table 17: 13C-NMR Interpretation of LUM5(Tavarini, Angelini, & Agriculture, 2013)
| Region (ppm) | Carbon Type |
| 10-25, Obtained peek 20-21 | Methyls |
| 25-45, Obtained peek 21-43 | Aliphatic CH/CH₂ |
| 60-65, Obtained peek 60-61 | CH₂OH |
| Obtained peek 70-85 | Sugar CH-O |
| 95-105 | Anomeric |
| 170-175m Obtained peek 96-105 | Ester C=O |
| 175-180, Obtained peek 176 | Carbamoyl |
Mass Spectroscopy of LUM5
m/z 836.3837-This is the molecular ion (M+H) + of LUM5, Indicate the molecular weight LUM5 Plus proton. This the most intense peak, representing the LUM5 molecule itself.
Structural Elucidation of Compound LUM5
Based on interpretation of spectral data, molecular weight 835and M/Z 836.3837 Unknow Semisynthetic compound LUM5 showed that it is a (2R,5R)-3,4,5-trihydroxy-6-(hydroxymethyl)tetrahydro-2H-pyran-2-yl(4R,8R,11bR)-8-carbamoyl-9-(((2S,3S,5R)-4,5-dihydroxy-6-(hydroxymethyl)-3-(((2R,5S)-3,4,5-trihydroxy-6-oxy)tetrahydro-2H-pyran-2-yl)oxy)-3,11b-dimethyltetradecahydro-6a,9-methanocyclohepta[a]naphthalene-4-carboxylate(hydroxymethyl)tetrahydro-2H-pyran-2-yl). Comparison of physical parameter Infrared spectroscopy, Proton NMR, Carbon NMR and Mass Spectroscopy with data evaluation.(Singh & Rao, 2005).
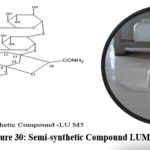 |
Figure 30: Semi-synthetic Compound LUM5 Click here to View Figure |
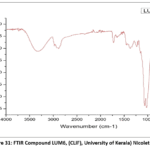 |
Figure 31: FTIR Compound LUM6,(CLIF), University of Kerala)Nicolet iS50 Click here to View Figure |
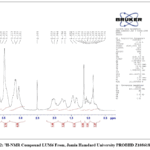 |
Figure 32: 1H-NMR Compound LUM6 From, Jamia Hamdard University PROBHD Z108618_0948 Click here to View Figure |
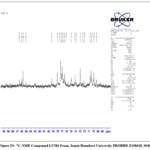 |
Figure 33: 13C-NMR Compound LUM6 From, Jamia Hamdard University PROBHD Z108618_0948 Click here to View Figure |
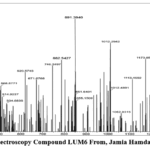 |
Figure 34; Mass Spectroscopy Compound LUM6 From, Jamia Hamdard University (M52) Click here to View Figure |
Spectral analysis of compound LUM6
Spectral data
Table 18: FTIR Interpretation of LUM6 (Wölwer-Rieck & chemistry, 2012)
| Wavenumber (cm⁻¹) | Functional Group | Diagnostic Importance |
| Obtained peek 3327cm-1 | O-H stretch (broad) | Indicates H-bonded hydroxyls |
| Obtained peek 2884cm-1 | C-H stretch | Aliphatic chains |
| Obtained peek 1815cm-1 | Anhydride C=O (higher) | Diagnostic for anhydride |
| Obtained peek 1760 cm-1 | Anhydride C=O (lower) | Confirms anhydride |
| Obtained peek 1740 cm-1 | Ester C=O | Glycosidic ester |
| Obtained peek 1388 cm-1 | O-H bend | Hydroxyl confirmation |
| Obtained peek 1068 cm-1 | C-O-C stretches | Anhydride + glycosidic bonds |
| <1000 | Fingerprint region | Complex ring vibrations |
Table 19: 1H-NMR Interpretation of LUM6 (Yadav, Guleria, & nutrition, 2012).
|
High-Field Region (δ 0.5-3.0 ppm) |
|
| Proton |
δ (ppm) |
|
H-18 |
Obtained peek 0.89 |
| H-19 |
Obtained peek 1.13 |
|
CH₃CO |
Obtained peek 2.05 |
| CH₂CO |
Obtained peek 2.50 |
|
Ring CH/CH₂ |
Obtained peek 1.13-2.50 |
|
Mid-Field Region (δ 3.0-5.5 ppm) |
|
| Proton |
δ (ppm) |
|
H-8 |
Obtained peek 3.13 |
| H-1′ |
4.72 |
|
H-1” |
5.28 |
| H-1”’ |
5.44 |
|
Sugar CH/CH₂ |
3.15-4.35 |
|
Exchangeable Protons (δ 4.5-6.5 ppm) |
|
| Proton |
δ (ppm) |
|
OH (sugar) |
4.8-6.0 |
| OH (steroid) |
5.3-6.4 |
Table 20: 13C-NMR Interpretation of LUM6 (Amorim, Hayashi, Pimentel, & Silva, 2003)
| Region (ppm) | Carbon Type |
| Obtained peek10-25 | Methyls |
| Obtained peek25-45 | Aliphatic CH/CH₂ |
| Obtained peek60-65 | CH₂OH |
| Obtained peek70-77 | Sugar CH-O |
| Obtained peek95-105 | Anomeric |
| Obtained peek165-175 | Anhydride/ester C=O |
| Obtained peek175-180 | Ester C=O |
Mass Spectroscopy of LUM6
m/z 891.3940-This is the molecular ion (M-H)- of LUM6, Indicate the molecular weight
LUM6 (-) proton. This the most intense peak, representing the LUM6 molecule itself.
Structural Elucidation of Compound LUM6
Based on interpretation of spectral data, molecular weight 891.3940 and M/Z 891.3940 Unknow Semisynthetic compound LUM1 showed that it is an acetic 2-((4R,8S,11bR)-9-(((2S,3S,5R)-4,5-dihydroxy-6-(hydroxymethyl)-3-(((2R,5S)-3,4,5-trihydroxy-6-(hydroxymethyl)tetrahydro-2H-pyran-2-yl)oxy)tetrahydro-2H-pyran-2-yl)oxy)-3,11b-dimethyl-4-((((2R,5R)-3,4,5-trihydroxy-6-(hydroxymethyl)tetrahydro-2H-pyran-2-yl)oxy)carbonyl)tetradecahydro-6a,9-methanocyclohepta[a]naphthalen-8-yl)acetic anhydride. Comparison of physical parameter Infrared spectroscopy, Proton NMR, Carbon NMR and Mass Spectroscopy with data evaluation.(Tavarini et al., 2013).
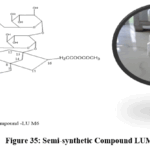 |
Figure 35: Semi-synthetic Compound LUM6 Click here to View Figure |
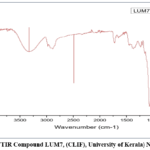 |
Figure 36: FTIR Compound LUM7,(CLIF), University of Kerala)Nicolet iS50 Click here to View Figure |
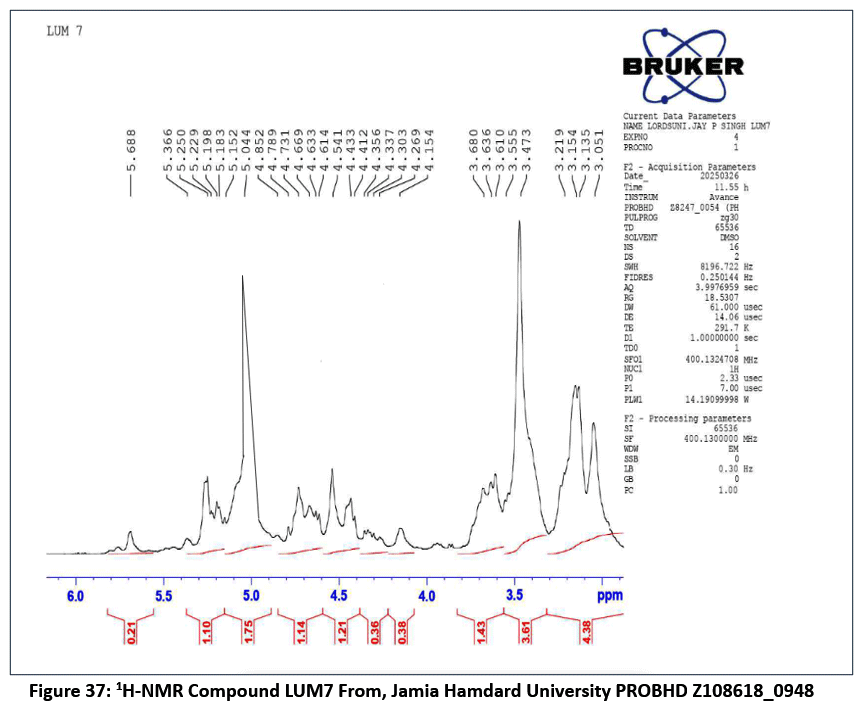 |
Figure 37: 1H-NMR Compound LUM7From, Jamia Hamdard University PROBHD Z108618_0948 Click here to View Figure |
 |
Figure 38: 13C-NMR Compound LUM7 From, Jamia Hamdard University PROBHD Z108618_0948 Click here to View Figure |
 |
Figure 39: Mass Spectroscopy Compound LUM7 From, Jamia Hamdard University (M52) Click here to View Figure |
Spectral analysis of compound LUM7
Spectral data
Table 21: FTIR Interpretation of LUM7 (Ubeda et al., 2020)
| Wavenumber (cm⁻¹) | Functional Group |
| Obtained peek 3327cm-1 | O-H stretch (very broad) |
| Obtained peek 2976 cm-1 | CH₃ asymmetric stretch |
| Obtained peek2880 cm-1 | CH₂ symmetric stretch |
| Obtained peek1745 cm-1 | Ester C=O stretch(s) |
| Obtained peek1450 cm-1 | CH₂/CH₃ bending |
| Obtained peek1230 cm-1 | Ester C-O stretch |
| Obtained peek1166 cm-1 | C-O-C stretches |
| Obtained peek980 cm-1 | Pyranose ring vibrations |
| ~1375 | CH₃ symmetric bend |
Table 22: 1H-NMR Interpretation of LUM7 (Nowacka et al., 2019).
|
High-Field Region (δ 0.5-2.5 ppm) |
|
| Proton |
δ (ppm) |
|
H-18 |
0.91 |
|
H-19 |
1.18 |
|
CH₃CH₂ |
1.25 |
| CH₂CH₃ |
Obtained peek 4.15 |
|
Ring CH/CH₂ |
1.30-2.45 |
|
Mid-Field Region (δ 2.5-5.5 ppm) |
|
|
Proton |
δ (ppm) |
| H-8 |
2.98 |
|
H-1′ |
Obtained peek4.73 |
| H-1” |
Obtained peek5.25 |
|
Sugar CH/CH₂ |
Obtained peek3.21-4.41 |
|
Exchangeable Protons (δ 4.5-6.5 ppm) |
|
| Proton |
δ (ppm) |
|
OH (sugar) |
Obtained peek4.8-6.1 |
| OH (steroid) |
Obtained peek5.3-6.4 |
Table 23: 13C-NMR Interpretation of LUM7 (Mizutani & Tanaka, 2001)
| Region (ppm) | Carbon Type |
| 10-25 | Methyls |
| 25-45 | Aliphatic CH/CH₂ |
| Obtained peek60-65 | CH₂OH |
| 70-85 | Sugar CH-O |
| Obtained peek95-105 | Anomeric |
| Obtained peek165-175 | Ester C=O |
| Obtained peek175-180 | Glycosidic ester C=O |
| Obtained peek- CH₂ | δ 60.1 |
| Obtained peek- CH₃ | δ 14.3 |
Mass Spectroscopy of LUM7
m/z 865.3990-This is the molecular ion (M+H) + of LUM7, Indicate the molecular weight LUM7 Plus proton. This the most intense peak, representing the LUM7 molecule itself.
Structural Elucidation of Compound LUM7
Based on interpretation of spectral data, molecular weight 864.93and M/Z 865.3990Unknow Semisynthetic compound LUM7 showed that it is a 8-ethyl 4-((2R,5R)-3,4,5-trihydroxy-6-(hydroxymethyl)tetrahydro-2H-pyran-2-yl) (4R,8R,11bR)-9-(((2S,3S,5R)-4,5-dihydroxy-6-(hydroxymethyl)-3-(((2R,5S)-3,4,5-trihydroxy-6-(hydroxymethyl)tetrahydro-2H-pyran-2-yl)oxy)tetrahydro-2H-pyran-2-yl)oxy)-3,11b-dimethyltetradecahydro-6a,9-methanocyclohepta[a]naphthalene-4,8-dicarboxylate. Comparison of physical parameter Infrared spectroscopy, Proton NMR, Carbon NMR and Mass Spectroscopy with data evaluation.(Wölwer-Rieck & chemistry, 2012).
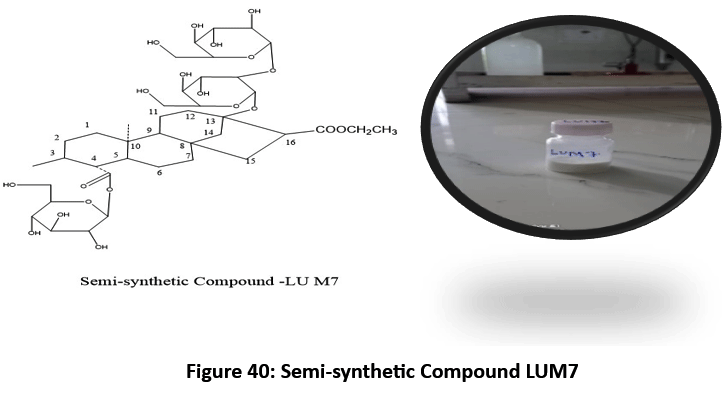 |
Figure 40: Semi-synthetic Compound LUM7 Click here to View Figure |
Conclusion
The study successfully isolated and characterized steviol glycosides from Stevia rebaudiana leaves using solvent extraction techniques, including water, acidic, basic, and alcoholic solvents. The extraction process was optimized with specific temperature controls (75–80°C) and repeated treatments to maximize yield. Rotary evaporation and recrystallization were employed to purify the compounds, yielding stevioside crystals.(Yadav et al., 2012)
Advanced spectroscopic techniques—FTIR, 1H1H-NMR, 13C13C-NMR, and mass spectrometry—were used to elucidate the structures of the isolated compounds (LUM1–LUM7). Key findings include:
FTIR confirmed functional groups such as O–H, C=O (ester), and glycosidic bonds.
NMR spectra provided detailed proton and carbon environments, identifying anomeric protons and sugar moieties.
Mass spectrometry determined molecular weights, with peaks such as *m/z* 805.3421 (stevioside) and *m/z* 891.3940 (LUM6, an anhydride derivative).
The structural elucidation revealed semisynthetic derivatives, including amino (LUM1), imino (LUM2), carboxylic acid (LUM3), formyl (LUM4), carbamoyl (LUM5), anhydride (LUM6), and ethyl ester (LUM7) modifications. These findings highlight the versatility of steviol glycosides for potential applications in food, pharmaceuticals, and nutraceuticals due to their non-caloric sweetness and bioactive properties.
Funding Sources
The author(s) received no financial support for the research, authorship, and/or publication of this article.
Conflict of Interest
The author(s) do not have any conflict of interest.
Data Availability Statement
This statement does not apply to this article.
Ethics Statement
This research did not involve human participants, animal subjects, or any material that requires ethical approval.
Reference
- Abou-Arab, A. E., Abou-Arab, A. A., & Abu-Salem, M. F. J. A. J. o. F. S. (2010). Physico-chemical assessment of natural sweeteners steviosides produced from Stevia rebaudiana Bertoni plant. 4(5), 269-281.
- Amorim, W., Hayashi, A., Pimentel, P., & Silva, M. d. J. B. J. o. C. E. (2003). A study of the process of desorption of hexavalent chromium. 20(3), 283-289.
CrossRef - Barac, M. B., Pesic, M. B., Stanojevic, S. P., Kostic, A. Z., Bivolarevic, V. J. J. o. f. s., & technology. (2015). Comparative study of the functional properties of three legume seed isolates: adzuki, pea and soy bean. 52(5), 2779-2787.
CrossRef - Baú, T., & Ida, E. J. F. C. (2015). Soymilk processing with higher isoflavone aglycone content. 183, 161-168.
CrossRef - Castejón, N., Moreno-Pérez, S., Silveira, E. A., Lorente, G. F., Guisán, J. M., & Señoráns, F. J. J. F. c. (2019). Synthesis of omega-3 ethyl esters from chia oil catalyzed by polyethylene glycol-modified lipases with improved stability. 271, 433-439.
CrossRef - Chatsudthipong, V., Muanprasat, C. J. P., & therapeutics. (2009). Stevioside and related compounds: therapeutic benefits beyond sweetness. 121(1), 41-54.
CrossRef - Chiocchio, I., Mandrone, M., Tomasi, P., Marincich, L., & Poli, F. J. M. (2021). Plant secondary metabolites: An opportunity for circular economy. 26(2), 495.
CrossRef - Elgenaidi, I., Spiers, J. J. P., & therapeutics. (2019). Regulation of the phosphoprotein phosphatase 2A system and its modulation during oxidative stress: A potential therapeutic target? , 198, 68-89.
CrossRef - Ertan, K., Türkyılmaz, M., & Özkan, M. J. F. C. (2019). Effects of natural copigment sources in combination with sweeteners on the stability of anthocyanins in sour cherry nectars. 294, 423-432.
CrossRef - Gasmalla, M. A. A., Yang, R., & Hua, X. J. F. E. R. (2014). Stevia rebaudiana Bertoni: An alternative sugar replacer and its application in food industry. 6, 150-162.
CrossRef - Geuns, J. M. J. P. (2003). Stevioside. 64(5), 913-921.
CrossRef - Gupta, E., Purwar, S., Sundaram, S., & Rai, G. J. J. o. M. P. R. (2013). Nutritional and therapeutic values of Stevia rebaudiana: A review. 7(46), 3343-3353.
- Helle, A., Hirsjärvi, S., Peltonen, L., Hirvonen, J., & Wiedmer, S. K. J. J. o. C. A. (2008). Quantitative determination of drug encapsulation in poly (lactic acid) nanoparticles by capillary electrophoresis. 1178(1-2), 248-255.
CrossRef - Jiang, S., Liu, Q., Xie, Y., Zeng, H., Zhang, L., Jiang, X., & Chen, X. J. F. c. (2015). Separation of five flavonoids from tartary buckwheat (Fagopyrum tataricum (L.) Gaertn) grains via off-line two dimensional high-speed counter-current chromatography. 186, 153-159.
CrossRef - Kolb, N., Herrera, J., Ferreyra, D., Uliana, R. J. J. o. a., & chemistry, f. (2001). Analysis of sweet diterpene glycosides from Stevia rebaudiana: Improved HPLC method. 49(10), 4538-4541.
CrossRef - Labbé, M.-O., Collins, L., Lefebvre, C.-A., Maharsy, W., Beauregard, J., Dostie, S., . . . Letters, M. C. (2020). Identification of a C3′-nitrile nucleoside analogue inhibitor of pancreatic cancer cell line growth. 30(6), 126983.
CrossRef - Lemus-Mondaca, R., Vega-Gálvez, A., Zura-Bravo, L., & Ah-Hen, K. J. F. c. (2012). Stevia rebaudiana Bertoni, source of a high-potency natural sweetener: A comprehensive review on the biochemical, nutritional and functional aspects. 132(3), 1121-1132.
CrossRef - Mizutani, K., & Tanaka, O. (2001). Use of Stevia rebaudiana sweeteners in Japan. In Stevia (pp. 178-196): CRC Press.
- Nowacka, M., Wiktor, A., Dadan, M., Rybak, K., Anuszewska, A., Materek, L., & Witrowa-Rajchert, D. J. F. (2019). The application of combined pre-treatment with utilization of sonication and reduced pressure to accelerate the osmotic dehydration process and modify the selected properties of cranberries. 8(8), 283.
CrossRef - Pandey, A., Tripathi, S. J. J. o. P., & phytochemistry. (2014). Concept of standardization, extraction and pre phytochemical screening strategies for herbal drug. 2(5).
- Pól, J., Hohnová, B., & Hyötyläinen, T. J. J. o. C. A. (2007). Characterisation of Stevia rebaudiana by comprehensive two-dimensional liquid chromatography time-of-flight mass spectrometry. 1150(1-2), 85-92.
CrossRef - Prakash, I., Markosyan, A., & Bunders, C. J. F. (2014). Development of next generation stevia sweetener: Rebaudioside M. 3(1), 162-175.
CrossRef - Puri, M., Sharma, D., & Tiwari, A. K. J. B. A. (2011). Downstream processing of stevioside and its potential applications. 29(6), 781-791.
CrossRef - Rambo, D. F., Biegelmeyer, R., Toson, N. S., Dresch, R. R., Moreno, P. R. H., & Henriques, A. T. J. P. R. (2019). The genus Erythrina L.: A review on its alkaloids, preclinical, and clinical studies. 33(5), 1258-1276.
CrossRef - Ramesh, K., Singh, V., & Megeji, N. W. J. A. i. a. (2006). Cultivation of stevia [Stevia rebaudiana (Bert.) Bertoni]: A comprehensive review. 89, 137-177.
CrossRef - Ramlagan, P., Rondeau, P., Planesse, C., Neergheen-Bhujun, V. S., Fawdar, S., Bourdon, E., & Bahorun, T. J. J. o. F. F. (2017). Punica granatum L. mesocarp suppresses advanced glycation end products (AGEs)-and H2O2-induced oxidative stress and pro-inflammatory biomarkers. 29, 115-126.
CrossRef - Richman, A. S., Gijzen, M., Starratt, A. N., Yang, Z., & Brandle, J. E. J. T. P. J. (1999). Diterpene synthesis in Stevia rebaudiana: recruitment and up‐regulation of key enzymes from the gibberellin biosynthetic pathway. 19(4), 411-421.
CrossRef - Rodrigo, C. P., Fagúndez, L. J. M., Serván, P. R., & Bartrina, J. A. J. N. h. (2015). Screeners and brief assessment methods. 31(3), 91-97.
- Ruiz-Ruiz, J. C., Moguel-Ordoñez, Y. B., Segura-Campos, M. R. J. C. r. i. f. s., & nutrition. (2017). Biological activity of Stevia rebaudiana Bertoni and their relationship to health. 57(12), 2680-2690.
CrossRef - Samuel, P., Ayoob, K. T., Magnuson, B. A., Wölwer-Rieck, U., Jeppesen, P. B., Rogers, P. J., . . . Mathews, R. J. T. J. o. n. (2018). Stevia leaf to stevia sweetener: exploring its science, benefits, and future potential. 148(7), 1186S-1205S.
CrossRef - Shukla, S., Mehta, A., Bajpai, V. K., Shukla, S. J. F., & toxicology, c. (2009). In vitro antioxidant activity and total phenolic content of ethanolic leaf extract of Stevia rebaudiana Bert. 47(9), 2338-2343.
CrossRef - Singh, S., & Rao, G. J. S. t. (2005). Stevia: The herbal sugar of 21st century. 7(1), 17-24.
CrossRef - Soejarto, D. D., Kinghorn, A. D., & Farnsworth, N. R. J. J. o. n. p. (1982). Potential sweetening agents of plant origin. III. Organoleptic evaluation of Stevia leaf herbarium samples for sweetness. 45(5), 590-599.
CrossRef - Tavarini, S., Angelini, L. G. J. J. o. t. S. o. F., & Agriculture. (2013). Stevia rebaudiana Bertoni as a source of bioactive compounds: the effect of harvest time, experimental site and crop age on steviol glycoside content and antioxidant properties. 93(9), 2121-2129.
CrossRef - Ubeda, C., Gil i Cortiella, M., Villalobos-González, L., Gómez, C., Pastenes, C., & Peña-Neira, Á. J. M. (2020). Ripening and storage time effects on the aromatic profile of new table grape cultivars in Chile. 25(24), 5790.
CrossRef - Wölwer-Rieck, U. J. J. o. a., & chemistry, f. (2012). The leaves of Stevia rebaudiana (Bertoni), their constituents and the analyses thereof: a review. 60(4), 886-895.
CrossRef - Yadav, S. K., Guleria, P. J. C. r. i. f. s., & nutrition. (2012). Steviol glycosides from Stevia: biosynthesis pathway review and their application in foods and medicine. 52(11), 988-998.
CrossRef - Zheng, G., Torres, A. M., & Price, W. S. J. M. R. i. C. (2017). WaterControl: self‐diffusion based solvent signal suppression enhanced by selective inversion. 55(5), 447-451.
CrossRef
 PlumX:
  Views: 675 Views
  PDF Downloads: 950
 Accepted on: 22 Nov 2025
Second Review by: Dr. Sheraya
Final Approval by: Dr. Pounraj Thanasekaran


ISSN Online: 2231-5039