Sonochemical Synthesis of Zinc Oxide-Vanadium Oxide Nanoflakes for Photocatalytic Degradation of Rh-B Dye
 , Deepesh Bhardwaj 2*, Rupali Rastogi 1and Satyendra Singh Chauhan3
1Department of Chemistry, ITM University, Gwalior, M.P. India.
2Department of Chemistry, ITM, Gwalior, M.P. India.
3Department of Physics, ITM Gwalior (M.P.) India.
Corresponding Author E-mail:deepesh.bhardwaj@itmgoi.in
DOI : http://dx.doi.org/10.13005/ojc/420207
Download this article as:
![]()
Zinc oxide nanoparticles exhibit low efficiency for catalytic applications under visible light due to their tendency to quickly recombine with photo-generated carriers, which reduces their effectiveness in photocatalytic degradation of dyes. In order to improve the efficacy of the ZnO-based photocatalyst, Zinc Oxide-Vanadium oxide nanoflakesaresynthesized by subjecting the solution of precursors to ultrasonic waves at 15KHz frequency and 375W power for a duration of 2 hours using a probe sonicator. The Zinc Oxide-Vanadium oxide nanoflakes are further analysed using various instrumental techniques including as TEM, FESEM, EDAX, XRD, UV-Vis, and FTIR to determine their particle size, crystal structure, shape, and composition. The findings indicate that the particle size of Zinc Oxide-Vanadium oxide nanocomposite was in the range of 30-56nm in the shape of flakes.As vanadium oxide has low bandgap so its presence in this nanocomposite has led to reduction in the band gap from 3.2 eV to 3.1 eVincreasing solar light absorbing capacity. The findings suggested that the optical response of ZnO was significantly improved and shifted towards visible region by incorporating Vanadium oxide as a co-catalyst. The photocatalytic properties of Zinc Oxide-Vanadium oxide nanocomposites were assessed under visible light and at three different pH of 4, 7 and 9 by using Rhodamine-B dye (Rh-B) as a model pollutant. This composite material has the potential to demonstrate outstanding photocatalytic efficacy in eliminating Rh-B dye from water sources of about 80% which was best seen at pH-9 and temperature 42℃ under visible light irradiation.This study adds to the increasing interest in visible-light photocatalysts based on heterostructures that have the potential to cure wastewater in the real world.
KEYWORDS:Nanocomposites; Photocatalytic degradation; Rh-B Dye; Sonochemical synthesis; Vanadium oxide; Zinc Oxide
Introduction
Zinc oxide (ZnO) is a highly adaptable material with semiconductor properties that has considerable interest in a range of fields including optoelectronics, photocatalysis, and sensing.1 An effective method for improving the qualities of ZnO involves incorporating dopants, which have a substantial effect on the electrical, optical, and structural properties of the material. There has been an increasing focus on synthesizing materials to address environmental issues, including the breakdown of organic dyes in wastewater. ZnO-based nanocomposites have demonstrated significant promise among these materials, primarily because of their exceptional photocatalytic characteristics.2 Sonochemical synthesis is a potential technique for synthesizing ZnO-based nanomaterials. It offers benefits including consistent particle size distribution and high purity.3 The fabrication of Zinc Oxide-Vanadium oxide nanoflakes utilizing sonochemical techniques has attracted considerable interest in this area due to its improved photocatalytic activity in the degradation of dyes. This study intends to present a detailed study of the current research in the field of sonochemical synthesis of Zinc Oxide-Vanadium oxide nanoflakes and their application in the photocatalytic degradation of dyes.4 The major objectives of this study are to investigate a cost-effective and easily expandable technique for producing Zinc Oxide-Vanadium oxide nanoflakes via sonochemical synthesis. Because, unlike conventional procedures, sonication enables quick nucleation, homogeneous morphology, and enhanced crystallinity, resulting in improved separation of charges and light absorption.Additionally, the study aims to assess the efficiency of these nanoflakes as a photocatalyst for breaking down of Rh-B dye commonly found as pollutant in water bodies.5 Nanotechnology has introduced innovative and effective materials and methods for removing pollutants from wastewater.6 Nanomaterials, specifically Zinc Oxide-Vanadium oxide nanoflakes, have attracted interest in photocatalytic degradation processes because of their large surface area, capability to produce reactive oxygen species, and promise for effective degradation of pollutant dyes. The sonochemical synthesis of Zinc Oxide-Vanadium oxide nanoflakes utilizes high-frequency sound waves to enhance chemical processes and enable the synthesis of nanoflakes with specific characteristics.7,5 This method provides numerous benefits, such as a cost-effective and easily expandable synthesizing procedure, along with the capability to regulate the size and structure of the nanoflakes. Also, effective electron-hole pair separation is made possible by the creation of a ZnO–VO heterojunction, which lowers recombination rates and improves photocatalytic activity.Nanocomposites have been recognized as a very useful materials, that overcomes the issues related to the exclusive use of metal oxides in water purification. They offer a platform to enhance the hydrophobicity of the composite, resulting in improved efficiency in adsorption and photocatalysis.8 Furthermore, the increased surface area provided by the nanoflake shape increases the availability of active sites for dye adsorption and degradation.
Experiment
Material Required
Ammonium-m-vandate [NH4VO3], Zinc acetate dihydrate [Zn(CH3COO)2.2H2O], Ethylenediamine [C2H8N2], Hydrochloric Acid [HCL], Potassium hydroxide [KOH], Ethanol [C2H5OH], and double distilled (DD) water [H2O]are the laboratory grade chemicals and reagents utilized without any further purification.
Synthesis of Zinc Oxide-Vanadium oxide nanoflakes
Zinc oxide-vanadium oxide nanoflakes were synthesized through ultrasonic irradiation using a probe-sonicator, zinc and vanadium as 1:1 mratio. In order to produce ZnO-VO, a solution of Ammonium-m-vandate [NH4VO3] (0.5849g, 0.1 m) was combined with a solution of [Zn(CH3OO)2.2H2O] (1.0975g, 0.1 m) in distilled water (100 ml). The aqueous solution formed was agitated for 30 minutes prior to the addition of ethylene-di-amine (2 ml) as a capping agent. The solution was subjected to sonication for 2 hours at 375 W and a frequency of 15 kHz, the solutions of potassium hydroxide (KOH) (50 ml of 0.5611g, 0.2 m) and hydrochloric acid (HCL) (2 ml) were simultaneously added to this mixture as a reducing agent. The greyish precipitate was rinsed 5–6 times with water and ethanol mixture in a ratio of 3:1, and then dried for 8 hours in hot oven at a constant temperature of 80°C.
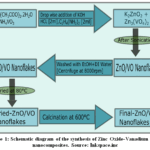 |
Figure 1: Schematic diagram of the synthesis of Zinc Oxide-Vanadium oxide nanocomposites. Source: Inkspace.inc Click here to View Figure |
Photocatalytic experiments
The photocatalytic efficiency of the Zinc oxide-Vanadium oxide nanocomposites were assessed by measuring the photodegradation of Rhodamine-B dye (Rh-B) dissolved at different pH solution under direct sun radiation, with an average daily temperature of 42 ± 2°C. Prior to irradiation, the solutions were agitated using a magnetic stirrer in the absence of light for a duration of 90 minutes in order to establish adsorption-desorption equilibrium within the photocatalyst and the pollutant dye. A concentrated solution of Rh-B dye was made by dissolving 10 mg of dye in 1 L of distilled water. Three solutions of Rh-B dye with varying concentrations (0.6, 1.6, and 3.0 mg/L) were generated at different pH levels (4, 7, and 9). These solutions were then analysed to determine the Rh-B dye degradation using Zinc Oxide-Vanadium oxide catalyst. At regular intervals of 30 minutes (for a total duration of 2.5 hours), samples were taken and then subjected to centrifugation in order to eliminate the catalyst. The elimination of Rh-B dye was assessed by measuring its absorption at 554±2 nm using a UV–vis spectrophotometer. Subsequently, the absorption was transformed into concentration using the Beer-Lambert’s law9:

where, A=absorbance, ε=molar absorptivity, l=path length in cm, C=concentration.
Also, the % degradation was calculated via:
where, %D is percent degradation of dye, C0 is initial concentration of dye, Ctis final concentration of dye.
Results and Discussion
Diverse analytical techniques are employed to determine the physiochemical structure of the synthesized substance. The X-ray diffraction (XRD) investigation is performed utilizing a fifth generation Rigaku instrument (Model no. Mini Flex 600 XRD). The particle size of the sample was determined using Scherrer’s equation. Crystallites size in the synthesized samples was determined by analysing the maximum prominent peak in the XRD data. This was done viaDebye-Scherrer formula.10
dRX represents the size of the crystallite, k is correction factor (accounts for the morphologies of the particles), β represents width of the extreme diffraction peak plane at half of its maximum intensity, also known as the full width at half maximum (FWHM), the wavelength of the Cu target is λ = 0.15406 nm and θ represents the Bragg angle. The accuracy of measuring the peak width in XRD spectra was better than 0.05°. The morphology and particle size of the nanocomposites are assessed using Transmission electron microscopy (JEOL JSM6390LV). The chemical composition of the produced substance is assessed using Bruker Nano GmbH, Germany-EDAX. FTIR and UV–vis spectroscopy methods are employed to confirm the synthesis of Zinc Oxide-Vanadium oxide and to determine any alterations in the energy bandgap.11
FTIR Analysis
Figure-2 of Zinc Oxide-Vanadium oxide composites show absorption bands between 400-700 cm−1, which shows ZnO stretching modes.12 The signal observed at a wavenumber of 659 cm−1 can be attributed to zinc oxide (ZnO). The bands in the range of 500-800 cm−1 display clear V–O–V vibrations.13 The detected absorption bands at 787 cm−1 in the dried material are associated with the V–O bond. The peaks seen at 479 cm−1 and 902 cm−1 are ascribed to the symmetrical vibrations of the V-O-Zn bond and the V–O bond, respectively.14
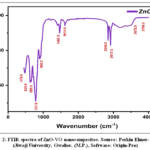 |
Figure 2: FTIR spectra of ZnO-VO nanocomposites. Source: Perkin Elmer-105267 (Jiwaji University, Gwalior, (M.P.), Software: Origin-Pro) Click here to View Figure |
The absorption band seen at 1467 cm−1 is ascribed to the stretching vibration of Zn–O (υ-ZnO) bands in the tetrahedron unit of vanadate species. This confirms the existence of the ZnO phase.15 The peaks detected at 1618 cm−1 and 3672 cm−1 correspond to the stretching and bending vibrations of the H–O–H bonds in the water (H2O) molecules that have been adsorbed onto the surface of the Zinc Oxide-Vanadium oxide material. These peaks correspond to the values that were previously documented.
UV Analysis
Figure 3 displays the UV spectra of Zinc Oxide-Vanadium oxide. All samples exhibit a prominent absorption below 400 nm, with a distinct absorbance peak at approximately 349 nm. In the provided graph, the peak for ZnO nanoparticles is observed at a wavelength of 349 nm, while the peak for vanadium oxide is observed at 260 nm.16
We have determined the optical band gap value using the Tauc’s relation17 as follows:
![]()
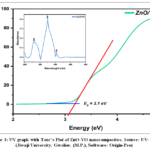 |
Figure 3: UV graph with Tauc’s Plot of ZnO-VO nanocomposites. Source: UV-1280 (Jiwaji University, Gwalior, (M.P.), Software: Origin-Pro) Click here to View Figure |
Figure 3 depicts the correlation between the square of the absorption coefficient (α) multiplied by the photon energy (hν), and the photon energy (hν) itself. Zinc oxide (ZnO) has an optical band gap energy (Eg) of 3.2 electron volts (eV), whereas vanadium oxide has an optical band gap energy of 2.4 eV.18 The presence of vanadium ions in this nanocomposite has led to a notable reduction in the band gap of materials, resulting in a value of 3.1 eV.
XRD Analysis
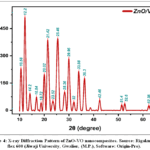 |
Figure 4: X-ray Diffraction Pattern of ZnO-VO nanocomposites. Source: Rigaku mini flex 600 (Jiwaji University, Gwalior, (M.P.), Software: Origin-Pro) Click here to View Figure |
XRD patterns revealed a displacement of the diffraction peaks in the Zinc Oxide-Vanadium oxide sample compared to pure ZnO. The formation of zinc vanadate yellow powder occurred when zinc ion and vanadium ion solutions were combined under the specified controlled experimental circumstances. Figure 4 displays the XRD of the sample after it was dried and calcined. Typically, the diffraction peaks exhibit a high degree of sharpness and intensity. It is evident from Figure 4 that the majority of the diffraction peaks can be attributed to nanoflakes of the Zinc Oxide-Vanadium oxide phase. The powerful peaks indicate the high quality of the Zinc Oxide-Vanadium oxide crystals, but the complex itself is amorphous. The most prominent peak is observed at a location of 12.2 degrees.19 The peaks had a strong correlation with JCPDS No. 11-0288, and additional peaks corresponding to secondary phases or impurities were detected, confirming the purity of the product. These findings are in agreement with previously published research.20 The observed diffraction peaks correspond to monoclinic ZnO-VO phase, which is consistent with the JCPDS card# 01-070-1532 nanocrystals.9, 20 The average size of the crystallites in the sample that was dried at 80 °C and calcined at 600 °C falls within the range of 30 and 56 nm, respectively.
SEM Analysis
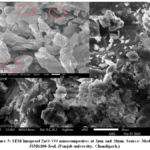 |
Figure 5: SEM Imagesof ZnO-VO nanocomposites at 2µm and 20µm. Source: Model-JSM6100 Jeol, (Panjab university, Chandigarh.) Click here to View Figure |
The OH− ions concentration in the solution itself serves as a crucial determinant of developmental progression. The V(OH)4− ions mostly undergo a reaction with Zn2+ surface which is positively charged, which is polar and active, rather than with the other nonpolar surfaces. This led to a partial obstruction of growth along the c-axis. Lateral expansion in Zinc Oxide-Vanadium oxide nanoflakes is likely due to the protective presence of V(OH)4 – ions on the Zn2+ surface.21 Figure 5 displays the SEM sample images after they were dried and calcined at temperatures of 80 and 600 °C, respectively. The creation of two-dimensional nanoflake-like morphologies in Zinc Oxide-Vanadium oxide is evident at both high and low temperatures. The thickness of the material is approximately 54nm. After being heated to 600 °C, the shape of the synthesized nanocomposite did not undergo any noticeable alteration (Fig. 5). The VO3− ions derived from ammonium meta vanadate undergo a reaction with the ions of Zn2+ generated from zinc acetate. The self-assembly of defined crystallographic planes occurs in a layer-by-layer fashion through the influence of electrostatic forces.22 As the temperature increases, the remaining small amount of H2O is eliminated, resulting in the creation of empty spaces called voids.23
EDAX Analysis
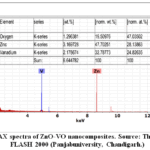 |
Figure 6: EDAX spectra of ZnO-VO nanocomposites. Source: Thermo Scientific FLASH 2000 (Panjabuniversity, Chandigarh.) Click here to View Figure |
The EDAX spectrum (Fig. 6) exhibits three peaks corresponding to the atom percentages of oxygen (47.03%), zinc (28.13%), and vanadium (24.82%). The composition of oxygen, zinc, and vanadium in the ZnO-VO nanocomposites is consistent with this percentage.
TEM Analysis
Figures 7 and 8 display the TEM images of the zinc oxide-vanadium oxidenanoflakes. The nanoflakes in Figure 8(a) were dried at 80 °C, while those in Figure 7(b) and 8(b) were calcined at 600 °C. The sample exhibits the creation of nanoflakes, while the calcined sample displays the generation of structures resembling 2D flakes. The size of the particles falls within the range of around 30-56 nm, which aligns with the measurements obtained through XRD and SEM analysis.
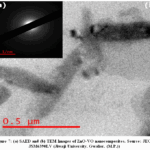 |
Figure 7: (a) SAED and (b) TEM Images of ZnO-VO nanocomposites. Source: JEOL JSM6390LV (Jiwaji University, Gwalior, (M.P.)) Click here to View Figure |
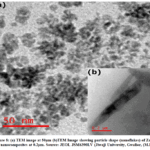 |
Figure 8: (a) TEM image at 50µm (b)TEM Image showing particle shape (nanoflakes) of ZnO-VO nanocomposites at 0.2µm. Source: JEOL JSM6390LV (Jiwaji University, Gwalior, (M.P.)) |
The fusion of particles is observed, coupled with the formation of bottlenecks between adjacent attachments along the y-axis. Additionally, there is evidence of attachment that is positioned laterally and parallel to the y-axis. The development of nanoflakes can be linked to the crystal structure with layers inside.24 The electron diffraction pattern in Fig.6(a) displays the least intense rings for Zinc Oxide-Vanadium oxide, indicating the favoured orientation of the synthesized amorphous material.
Photocatalytic Degradation of Dyes
The photocatalytic mechanism generally consists of three steps: firstly, the process involves the assimilation of a photon with energy that is either equal to or surpasses the band gap energy of the photocatalyst. Secondly, this leads to the creation and subsequent combination of electron-hole pairs, thirdly, the occurrence of oxidation and reduction reactions. that take place on the surface of the photocatalyst.25 Figure 9 illustrates the process of generating holes and electrons in the nanocomposite when exposed to visible light, leading to the sequential mineralization of Rh-B dye. When photons with energy equal to or greater than the band-gap energy of the photocatalyst interact with it, electron-hole pairs are produced and separated. The electron in an excited stateundergoes a reaction with oxygen molecules adsorbed on a surface, resulting in the formation of radicals with superoxide anion (O2-•) that are electrically engaged. While the holes in the valence band are being stimulated, they oxidize -OH before producing hydroxyl radical species (•OH). However, this hydroxyl •OH radical, which is a highly powerful oxidizing agent, further oxidizes the dye molecules into mineral byproducts, namely CO2 and H2O.26
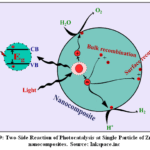 |
Figure 9: Two-Side Reaction of Photocatalysis at Single Particle of ZnO-VO nanocomposites. Source: Inkspace.inc Click here to View Figure |
The incorporation of these advancements in the field of photocatalytic degradation of dyes demonstrates a focused endeavour to attain sustainable and efficient water treatment solutions. This reflects the ongoing development and refinement of environmental remediation techniques at an advanced research level. The details of photocatalytic degradation of dye using different catalysts are mentioned below in table-1:
Table 1: Comparison of photocatalytic degradation using different synthesized ZnO-nanocomposites.
|
Catalyst |
Target dye | Light source | Degradation (%) | Reaction time(min) | Reference |
| 40% ZnO-GR | MB | Visible | 86.8 | 100 |
27 |
|
Cu-ZnO/TiO2 |
MB | Visible | 68 | 120 | 28 |
| 75% NiSe2–ZnO | MB | Visible | 97 | 300 |
29 |
|
ZnO/PANI |
MB | Visible | 76 | 160 | 30 |
| Graphdiyne-ZnOnanohybrids | MB | UV | 89 | 180 |
31 |
|
Graphene-ZnO nanofiber mats |
MB | UV | 80 | 240 | 32 |
| ZnO (stearic acid)/Vox-NTs | MB | Visible | 80 | 210 |
33 |
|
NiO/ZnO |
MB | Visible | 97 | 175 | 34 |
| rGO@/ZnO | MB | Visible | 99 | 100 |
35 |
Degradation of Rh-B Dye
Rhodamine-B dye is a benzene derivative that is known to be harmful to the kidney and liver, and can cause stomach tumours. It is also a carcinogenic substance. This dye is commonly used in the treatment of leather items, textiles, and various foods.36 It exerts a deleterious impact on both marine organisms and terrestrial ecosystems. Due to the release of nitrogen oxides and hydrogen chlorides, this substance is inherently hazardous and poses significant risks to human health, agriculture, and aquatic ecosystems.37 Zinc oxide-Vanadium oxide has been employed for the photocatalytic degradation of Rh-B organic dye under visible light irradiation. The initial concentrations of the Rh-B dye in the solution were 0.6 mg/L, 1.6 mg/L, and 3.0 mg/L, while the concentration of the Zinc Oxide-Vanadium oxide nanocomposite remained constant at 30 mg/L. The absorption peak of Rh-B dye is often observed at a wavelength of 554±2 nm.38 The peak’s intensity level noticeably reduced as the duration of the visible light exposure increased. The concentration of Rh-B dye decreases to various amounts after being exposed to visible light for 2.5 hours. The Rh-B dye solution undergoes a colour change from a vibrant pink to a pale pink. We conducted the photocatalytic experiment three times, each time at a different pH level of 4, 7, and 9, with outside temperature 42℃ as shown in Figure 10(b), 10(c), and 10(d) accordingly.
In order to understand the impact of visible light on the photocatalytic response of Rh-B dye, the degradation percentage was assessed in the absence of any photocatalyst. It was found that the Rh-B dye solution has no photocatalytic activity under visible light irradiation without the presence of Zinc Oxide-Vanadium oxide nanocomposite. Conversely, the Zinc Oxide-Vanadium oxide nanocomposite has minimal photocatalytic activity for Rh-B dye in the absence of visible light exposure. Figure 10(a) displays the graphical representation. The graphs depicted in 11(b), 11(c), and 11(d) illustrate the extent of Rh-B dye photodegradation over a period of 2.5 hours using Zinc Oxide-Vanadium oxide nanocomposite. The degradation percentages at pH-4, pH-7, and pH-9 are around 45%, 40% and 80%correspondingly.The pH is the primary determinant in the photocatalytic process, as it directly influences the surface charge of the photocatalyst, which in turn affects the degradation of dyes.39
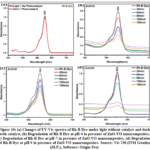 |
Figure 10: (a) Changes of UV-Vis spectra of Rh-B Dye under light without catalyst and dark with catalyst, (b) Degradation of Rh-B Dye at pH-4 in presence of ZnO-VO nanocomposites, Click here to View Figure |
Therefore, an investigation was conducted to examine the impact of pH on the deterioration of Rh-B dye. We also examined the photocatalytic degradation under acidic conditions with a pH of 4, where the impact was insignificant. The degradation efficiency exhibited a positive correlation with pH, with a notable rise observed at pH 9, reaching 80%. This value is twice as high as the degradation efficiency observed under normal and acidic pH conditions. One potential explanation for the increased photocatalytic degradation of Rh-B dye at higher pH levels is the generation of OH radicals as a result of the abundance of hydroxyl ions in the alkaline environment. The photocatalytic breakdown rate of Rh-B dye at varied pH values was described using a simple Langmuir-Hinshelwood (L-H) kinetic model.40
Limitation
This study has some shortcomings:
Lack of scalability: Due to batch processing and equipment constraints, the sonochemical synthesis approach may be challenging to scale for industrial purposes.
Restricted range of pollutants: The efficacy of the photocatalyst against other types of pollutants (such as heavy metals and antibiotics) has not been investigated; only rhodamine B dye was examined.
Mechanistic understanding: Deeper mechanistic investigations (such as radical trapping and LC-MS study of intermediates) would offer a better understanding of the photocatalytic pathway, even though degrading efficiency was shown.
Conclusion
Conclusively, Zinc Oxide-Vanadium oxide nanoflakenanocomposites have been successfully synthesized using a single-step sonication process. This synthesis demonstrates significant promise as an affordable, eco-friendly, and sustainable material that could pave the way for large-scale industrial manufacturing. The bandgap of Zinc Oxide-Vanadium oxide has been reduced to 3.1 electron volts (eV). The size of the Zinc Oxide-Vanadium oxide nanoflake were determined to be approximately 30–56 nm based on analysis of SEM and TEM pictures of the calcined sample. This study focuses on assessing the effectiveness of Zinc Oxide-Vanadium oxide in treating water systems contaminated with dyes. Certain reactive dyes decay at lower pH levels, while others degrade at higher pH levels. However, in the process of photocatalytic degradation of Rh-B dye under visible light irradiation, was best carried out at the optimal pH of 9 which resulted to 80% in direct sunlight at the temperature of 42℃.
Acknowledgement
The authors express their gratitude to ITM Gwalior, Jiwaji University, Gwalior, for UV, FTIR, TEM, SAED and XRD and also to the Punjab University, Chandigarh, for providing the SEM and EDAX, facilities.
Funding Sources
The authors express their gratitude to the Madhya Pradesh Council for Science Technology, located in Bhopal, (M.P.) INDIA, for providing the required partial financial support (File no. 3134/CST/R&D/Phy&Engg. and Pharmacy/2018/05.02.2019) for this research project.
Conflict of interest
The authors affirm that there are no financial, personal, or professional conflicts of interest related to this study.
Data availability Statement
This paper and its supporting information contain all pertinent data produced and analysed during this investigation, including experimental, spectroscopic, crystallographic, and microscopic data. This paper’s source data can be found at https://doi.org/10.1007/s42452-021-04479-7.On reasonable request, the appropriate author will provide any raw data files that are required in a different format. This research includes data from the following sources: https://doi.org/10.1007/s42452-019-0508-2.
Ethics Statement
This research did not involve human participants, animal subjects, or any material that requires ethical approval.
References
- Güell, F.; Galdámez-Martínez, A.; Martínez-Alanis, P. R.; Catto, A. C.; da Silva, L. F.; Mastelaro, V. R.; … &Dutt, A. Materials Advances, 2023, 4(17), 3685-3707.
CrossRef - Goktas, S.; &Goktas, A. Journal of Alloys and Compounds, 2021, 863, 158734.
CrossRef - Vishnukumar, P.; Vivekanandhan, S.; Misra, M.; &Mohanty, A. K. Materials Science in Semiconductor Processing, 2018, 80, 143–161.
CrossRef - Ullah, S.; Shahid, W.; Shahid, S.; Khan, M. I.; Ansar, N.; Khizar, M.; … &Alreshidi, M. A. Journal of Saudi Chemical Society, 2023, 27(6), 101766.
CrossRef - Bhardwaj, D.; Prasher, D.; Dubey, A.; Dhiman, V.; &Tomar, R. SN Applied Sciences, 2021, 3, 1–7.
CrossRef - Saravanan, A.; Kumar, P. S.; Hemavathy, R. V.; Jeevanantham, S.; Jawahar, M. J.; Neshaanthini, J. P.; &Saravanan, R. Chemosphere, 2022, 307, 135713.
CrossRef - Manickam, S.; Boffito, D. C.; Flores, E. M.; Leveque, J. M.; Pflieger, R.; Pollet, B. G.; &Ashokkumar, M. UltrasonicsSonochemistry, 2023, 99, 106540.
CrossRef - Irani, E.; &Amoli-Diva, M. Journal of Photochemistry and Photobiology A: Chemistry, 2020, 391, 112359.
CrossRef - Li, L.; Zhao, H.; Ni, N.; Wang, Y.; Gao, J.; Gao, Q.; … & Zhang, Y. SpectrochimicaActa Part A: Molecular and Biomolecular Spectroscopy, 2022, 275, 121192.
CrossRef - Mahmoud, S. A.; Bendary, S. H.; Salem, A. A.; &Fouad, O. A. SN Applied Sciences, 2019, 1(5), 497.
CrossRef - Ahmad, I.; Shukrullah, S.; Naz, M. Y.; Ahmed, E.; Ahmad, M.; Akhtar, M. S.; … &Alrobei, H. International Journal of Hydrogen Energy, 2022, 47(34), 15505–15515.
CrossRef - Abdullah, T. A.; Juzsakova, T.; Le, P. C.; Le, H. S.; Adelikhah, M.; Rasheed, R. T.; … & Nguyen, X. C. Total Environment Research Themes, 2022, 3, 100005.
CrossRef - Rani, C.; Hemalatha, M.; Bindu, S. H.; &Raju, C. L. Rasayan Journal of Chemistry, 2020, 13(2).
- Masoud, M. S.; Ali, A. E.; Ahmed, H. M.; & Mohamed, E. A. Journal of Molecular Structure, 2013, 1050, 43–52.
CrossRef - Oton, L. F.; Coelho, D. C.; Oliveira, A. C.; de Araujo, J. C.; Lang, R.; Rodriguez-Castellon, E.; … & Ramos, M. Molecular Catalysis, 2020, 480, 110641.
CrossRef - Chitra, M.; Uthayarani, K.; Rajasekaran, N.; Neelakandeswari, N.; Girija, E. K.; Padiyan, D. P.; &Mangamma, G. RSC Advances, 2016, 6(112), 111526–111538.
CrossRef - Sáenz-Trevizo, A.; Amézaga-Madrid, P.; Pizá-Ruiz, P.; Antúnez-Flores, W.; & Miki-Yoshida, M. Materials Research, 2016, 19, 33–38.
CrossRef - Mrabet, S.; Ihzaz, N.; Alshammari, M.; Khlifi, N.; Ba, M.; Bessadok, M. N.; … & El Mir, L. Journal of Alloys and Compounds, 2022, 920, 165920.
CrossRef - Chandrasekaran, S.; &Anbazhagan, V. Applied Biochemistry and Biotechnology, 2024, 196(1), 50–67.
CrossRef - Sajid, M. M.; Shad, N. A.; Khan, S. B.; Zhang, Z.; & Amin, N. Journal of Alloys and Compounds, 2019, 775, 281–289.
CrossRef - Hu, X.; Borowiec, J.; Zhu, Y.; Liu, X.; Wu, R.; Ganose, A. M.; … &Boruah, B. D. Small, 2024, 20(18), 2306827.
CrossRef - LakshmanaNaik, R.; Bala Narsaiah, T.; Justin, P.; Shwetha, H. N.; Sharanakuamr, T. M.; Somashekar, M. N.; … & Pasha, A. Research on Chemical Intermediates, 2025, 51(2), 1093-1112.
CrossRef - Flores, N. M.; Pal, U.; Galeazzi, R.; & Sandoval, A. RSC Advances, 2014, 4(77), 41099–41110.
CrossRef - Pallavolu, M. R.; Nallapureddy, J.; Nallapureddy, R. R.; Neelima, G.; Yedluri, A. K.; Mandal, T. K.; … &Joo, S. W. Journal of Alloys and Compounds, 2021, 886, 161234.
CrossRef - Koe, W. S.; Lee, J. W.; Chong, W. C.; Pang, Y. L.; &Sim, L. C. Environmental Science and Pollution Research, 2020, 27(3), 2522–2565.
CrossRef - Chitra, M.; Mangamma, G.; Uthayarani, K.; Neelakandeswari, N.; &Girija, E. K. Physica E: Low-dimensional Systems and Nanostructures, 2020, 119, 113969.
CrossRef - Fan, H.; Zhao, X.; Yang, J.; Shan, X.; Yang, L.; Zhang, Y.; … &Gao, M. Catalysis Communications, 2012, 29, 29-34.
CrossRef - Fan, F.; Wang, X.; Ma, Y.; Fu, K.; & Yang, Y. Fullerenes, Nanotubes and Carbon Nanostructures, 2015, 23(11), 917-921.
CrossRef - Khan, S. U.; Hussain, R.; Ali, Z.; Maryam, R.; Hussain, A.; Alajmi, M. F.; … & Cochran, E. W. RSC advances, 2024, 14(39), 28626-28637.
CrossRef - Ameen, S.; Akhtar, M. S.; Kim, Y. S.; Yang, O. B.; & Shin, H. S. Colloid and Polymer Science, 2011, 289, 415-421.
CrossRef - Thangavel, S.; Krishnamoorthy, K.; Krishnaswamy, V.; Raju, N.; Kim, S. J.; &Venugopal, G. The Journal of Physical Chemistry C, 2015, 119(38), 22057-22065.
CrossRef - An, S.; Joshi, B. N.; Lee, M. W.; Kim, N. Y.; & Yoon, S. S. Applied surface science, 2014, 294, 24-28.
CrossRef - Benavente, E.; Navas, D.; Devis, S.; Segovia, M.; Sotomayor-Torres, C.; & González, G. Catalysts, 2018, 8(2), 93.
CrossRef - Jia, J.; Bai, X.; Zhang, Q.; Hu, X.; Liu, E.; & Fan, J. Nanoscale, 2020, 12(9), 5636-5651.
CrossRef - Negash, A.; Mohammed, S.; Weldekirstos, H. D.; Ambaye, A. D.; &Gashu, M. Scientific Reports, 2023, 13(1), 22234.
CrossRef - Jha, M.; &Shimpi, N. G. Nano-Structures & Nano-Objects, 2018, 16, 234–249.
CrossRef - Salih, S. J.; Kareem, A. S. A.; & Anwer, S. S. Heliyon, 2022, 8(8).
CrossRef - Lops, C.; Ancona, A.; Di Cesare, K.; Dumontel, B.; Garino, N.; Canavese, G.; … &Cauda, V. Applied Catalysis B: Environmental, 2019, 243, 629–640.
CrossRef - Reza, K. M.; Kurny, A. S. W.; &Gulshan, F. Applied Water Science, 2017, 7, 1569–1578.
CrossRef - Alshamsi, H. A.; Al Bedairy, M. A.; &Alwan, S. H. IOP Conference Series: Earth and Environmental Science, 2021, 722(1), 012005.
CrossRef
Accepted on: 29 Mar 2026
Second Review by: Dr. Arti Malviya
Final Approval by: Dr. Pounraj Thanasekaran


ISSN Online: 2231-5039

![]()


