Stability Indicating UV and RP-HPLC (QBD Optimization), Statistical Correlation for The Determination of Ibuprofen Lysine and Its Related Substance in Tablet Dosage Form
 , L. Prakashraj and T. Sudha*
Department of Pharmaceutical Chemistry and Analysis, School of Pharmaceutical Sciences, Vels Institute of Science, Technology and Advanced Studies (VISTAS), Pallavaram, Chennai, Tamil Nadu, India.
Corresponding Author E-mail:tsudha.sps@vistas.ac.in
Download this article as:
ABSTRACT:Design of Experiments (DoE) was used here to produce and verify two effective methods for measuring Ibuprofen Lysine and related substances using UV-Spectroscopy and RP-HPLC. The best result for estimating Ibuprofen Lysine was obtained using methanol and wavelength 261 nm. In RP-HPLC, the choice of experimental design was the central composite design, working to tune acetonitrile, vary buffer pH, alter flow rate and maximize chromatographic results. The highest success was reached for chloroacetic acid at pH 3.0, using 40:60 acetonitrile (v/v), a flow rate of 2.0 mL/min and an elution time of only 10 minutes. All methods were fully confirmed by ICH standards, resulting in high linearity (r = 0.9991) from 0.0086 to 0.0688 mg/mL, good %RSD and study methods. The methods were proven suitable for daily use because all system suitability parameters passed the required criteria. High accuracy, precision, specificity and robustness were found in both methods, so they can be reliably used in quality control for pharmaceuticals.
KEYWORDS:DoE; Ibuprofen Lysine; Method development; RP-HPLC; Related substance; Validation
Introduction
Ibuprofen Lysine (Fig. 1a) is another name for 2-{4-(2-methylpropyl) phenyl} propanoic acid;2S-2,6-diaminohexanoic acid. The salt form of ibuprofen lysine is known as ibuprofen. When the active ingredient is changed to a lysine salt, ibuprofen is simpler to dissolve in water. Many people have used this popular NSAID to help reduce swelling and ease pain. Ibuprofen lysine had the exact pharmacologic effects as Ibuprofen. Ibuprofen Lysine is found to have two impurities, compound J (2RS)-2-(4-Isobutyrylphenyl)-propanoic acid as an ibuprofen related compound and compound C, 4′-Isobutylacetophenone, 1-(4-Isobutylphenyl) ethenone and 1-Acetyl-4-isobutylbenzene. As an analgesic, ibuprofen is used to treat pain and inflammation, as well as toothache, menstrual cramps, aching muscles and conditions affecting joints. Separating Ibuprofen lysine from the degradation products created under stressful conditions is important for the development of RP-HPLC method stability indicating method. Separation and degree measurement of Ibuprofen lysine against its degradation products is necessary to create a stability assay RP-HPLC method. The drug industry relies on forced degradation and stability indicating studies to maintain quality and safety of their products and medicinal materials. If a degradation product is important, it should be investigated and a consideration made for characterizing and measuring how much is present. Statisticians most commonly turn to the central composite design (CCD) as their main response surface model. In accordance with this design, star points are placed at the centre points. Since performing a complete three-level experiment takes a very long time, most researchers include a quadratic model by applying central composite design. When looking at more than two groups, an ANOVA explains the right way to generate a new group. The decision about one or two-way analysis of variance is based on the number of independent variables present in the study. The two-way ANOVA is an improvement over the one-way ANOVA. Even with T tests, only two teams can be verified, yet sample A generally requires at least three groups1-6.
 |
Figure 1a: Structure of Ibuprofen Lysine. Click here to View table |
 |
Figure 1b: Structure of Ibuprofen related compound J Click here to View Figure |
 |
Figure 1c: Structure of Ibuprofen related compound C Click here to View Figure |
The literature reviews covered creating and testing an RP-HPLC technique for Ibuprofen and paracetamol, developing a method to separate Ibuprofen enantiomers by HPLC, inventing and validating a spectroscopy method for the joint quantification of Ibuprofen, paracetamol and serratiopeptidase, establishing a HPLC method to assess the stability of ibuprofen famotidine, creating and validating an RP-HPLC method to determine Ibuprofen, creating an research about the stability of Ibuprofen Lysine and its family through RP-HPLC, central composite technique and UV-Spectroscopy was not found in literature. To construct, improve and check each method, QbD combined with RP-HPLC and spectroscopy was used7-15.
Materials and Methods
Apparatus and Software
RP-HPLC was developed and validated using the Shimadzu Prominence-I LC-2030 Plus. The UV spectroscopy technique was created using the Shimadzu UV-1900 I series. A sonicator from PCI Analytics and an analytical balance produced by Essae were the tools used. The trial version of Design Expert 12 (7.1.6) was used to build the Central Composite Design.
Chemicals and reagents
Data obtained from the study was analyzed with acetonitrile and methanol (HPLC grade) which were supplied by Rankem, along with ammonium hydroxide and gases from Loba Chemst via Sunglow Lifescience Pvt. Ltd. The compounds IBL, RSJ and RSC used were three forms of ibuprofen from Albermarle, the water was from Sunglow LifeScience Pvt. Ltd, Kattankulam, Kancheepuram.
Chromatographic and Spectroscopic conditions
Separation was performed on an HPLC equipped with a UV detector (the Prominence-I LC-2030 plus). A mixture of 60% acetonitrile to 40% chloroacetic acid was used as the mobile phase in this RP-HPLC sample. Upon degassing the mobile phase, we directed 2.0 ml/min through a Phenomenax C18 column which is 250 mm long, 4.6 mm wide and made up of 5µ (micron) particles. A 254 nm UV detector was used for the analysis. Everything took up ten minutes of the show. For UV imaging, methanol was chosen as the solvent and a photomultiplier tube was applied as the detector.
UV method Standard and Sample preparation
A 342 mg portion of the Ibuprofen Lysine working standard was weighed, taken to a 100 ml standard flask and dissolved using methanol. We added methanol (3420 µg/ml) to get the final volume. After that, 10 milliliters of the solution were added to a 100 ml graduated flask. Once that was done, MeOH was poured into the solution to raise the mark of the final weight. A final sample concentration of 342 µg/mL was produced. By using the same steps on a single tablet of Ibuprofen lysine, we obtained the sample solution at a concentration of 342 µg/mL.
Preparation for HPLC method
Preparation of Mobile phase
Place 4.0 g of Monochloroacetic acid into 400 mL of water and use NH4OH to reach a pH of 3.0±0.1. Then, 600 mL of acetonitrile were mixed, sonicated for five minutes and allowed to degas.
Preparation of Diluent
Mobile phase (Chloroacetic acid 400 mL: Acetonitrile 600 mL pH 3.0 %v/v) used as a diluent.
Preparing the system suitability stock solution and its associated reference substance (RS)
I started by assembling 1.0 mg of Ibuprofen Related Compounds C and J, mixing 7 mL of mobile phase, blending them by sonication and then filling the volume to 10 mL with more mobile phase.
Preparation of system suitability standard solution
The Ibuprofen Lysine working standard/reference standard was diluted to 10 mL once the 171 mg dose was measured. Once added, 1 mL of System suitability stock solution went in and after that, 7 mL of mobile phase. I dissolved the contents using sonication and then brought the volume to 17100 µg/mL with the mobile phase.
Preparation of sensitivity solution
We weighed 8.55mg of Ibuprofen Lysine working standard and transferred it into a dried 50mL volumetric flask, along with 30mL of mobile phase. After sonication, the mixture was dissolved. After that, dilute the stock solution to the required volume using the mobile phase (171 µg/mL). So, 5mL of the original solution was trended into a 100mL volumetric flask and the volume was extended with the mobile phase to achieve 8.55 µg/mL.
Preparation of standard solution
An amount of 34.2 mg (342 µg/mL) of Ibuprofen Lysine was measured and placed into the volumetric flask. Store 10 mg of each of Ibuprofen Related compounds C and J in a 100 mL volumetric flask and mix with 70 mL of mobile phase by sonicating. The mobile phase should be used to bring the analysis volume to the desired level. Add 10 mL of above solution and mobile phase to a 100 mL volumetric flask.
Preparation of Placebo Solution
A weight of 3420 mg (17100 µg/mL) of Ibuprofen Lysine was put into a 200 mL volumetric flask as placebo powder. Ten minutes after adding 100 mL of the mobile phase, the mixture was sonicated. Once chilled to a suitable temperature, the mobile phase was infused to reduce the sample to volume. 0.45µ nylon was chosen as the filter type to process the mixture through.
Preparation of sample solution
Tablet contents were crushed, measured and extracted into a 200 mL volumetric flask, containing 3420 mg (17100 µg/mL) of Ibuprofen Lysine. After bringing 100 mL mobile phase to the column, it is sonicated for 10 minutes. After that, the solution was passed through a 0.45µ nylon syringe filter.
Preparation of Impurities Stock Solution
We measured out 340 µg/mL of compound J as 17 mg and compound C as 21.5 mg, each stored in a separate 50 mL dried volumetric flask. Sonication was used after adding 30 mL to the mobile phase to dissolve it fully.
Spiked Sample solution preparation
We crushed 20 tablets and measured their weight. Place 17100 µg of Ibuprofen Lysine and 10 ml of mobile phase into a 20 mL volumetric flask. Afterwards, use sonication for ten minutes. After dropping in 3 mL (34 µg/mL) of the stock for Ibuprofen Lysine-related compound J and 3 mL (43 µg/mL) of the stock for Ibuprofen Lysine-related compound C, bring the content to the final volume with mobile phase. A 0.45 µm nylon syringe filter was applied to the fluid at the end of the procedure.
Method Validation
The ICH and FDA criteria were followed in evaluating the method validation parameters.
Specificity
The responses were specific due to the use of Blank, Placebo, System Suitability, Standard ID solution and unspiked sample solution. The above said solution was injected. Specificity was evaluated by using interference against such as diluent and Placebo.
Method Precision
In method precision, samples were analyzed six times from a homogenous batch. After injecting 10 μL of each sample into an HPLC instrument, the generated chromatogram was recorded. For UV method, the assay sample solution absorbance was measured at the specified wavelength. The % RSD was calculated for both the methods
Linearity (Preparation of Calibration graph)
Linearity for multiple similar substances using the RP-HPLC method was checked within the range from 25 % to 200 % of the specification limit. Linear structure was determined by assessing at least six levels. About 0.5-2.0 mL of the standard stock solution of ibuprofen-related compound J was added to six 20 mL volumetric flasks and filled with diluent, making the final concentrations about 8.7-69.4 μg/mL. In each case, 0.5 – 2.0 mL of the Ibuprofen lysine solution in diluent was carefully measured and moved into 20 mL volumetric flasks, filled to the 20.0 mL mark with diluent. Between 8.6 and 68.8 μg/mL is the range where you should find Ibuprofen Lysine. Each of the Ibuprofen related compound C standards (0.5 -2.0 mL) was poured into six small volumetric flasks and each solution was made to the right volume with diluent. After that, the solution was transferred into six 10 ml volumetric flasks. A volume of standard solution between 0.4 mL and 2.4 mL was added to each flask and methanol was placed in each still to reach the mark required for UV detection. The tested Ibuprofen Lysine concentration turned out to be (13.68-82.08 μg/mL).
LOD and LOQ
The sample’s smallest analyte concentration is known as the LOD, under the given experimental conditions, could be detected but not necessarily quantified. For either method, the minimal concentration of analyte in the sample that could be measured with great accuracy and precision was determined within the set experiment conditions.
Accuracy
The analytical method’s accuracy was determined over its range by assessing at least five levels. In three replicates, LOQs of 50 %, 100 %, 150 %, and 200 % were prepared. The chromatograms were recorded after injecting 10 μL of each solution concentration. The accuracy levels were determined using the RP-HPLC methods linearity levels. The absorbance was tested at three distinct concentration levels: 50, 100, and 150 % solution.
Robustness
A method is known as robust when it can adjust to small changes in its parameters, proving it remains reliable in regular operation. In this experiment, each procedure parameter is deliberately changed one at a time, and data is recorded for any minute changes that happen accidentally during routine analysis.
Solution stability
The standard and sample solutions were examined for stability at the beginning of the experiment and 12, 24, 40 and 48 hours after. Chromatograms were acquired after injecting 10 µL of standard and sample solutions at various time intervals (initial, 12th hours, 24th hours, 40th hours and 48th hours). The percentage assay of the sample solutions was computed, and system suitability parameters were verified.
Forced degradation studies
Forced degradation testing was used to purposely deteriorate the sample. These investigations were utilized to assess the overall sensitivity of the material/drug product in order to validate methods and/or elucidate degradation pathways. Each research solution was injected, and the chromatogram was acquired using the RP-HPLC method. The absorbance for the UV method was measured.
Force degradation study solution
After adding 30 mL of a diluent and sonicating for ten minutes, the hydrolysis with acid was carried out. A 10 mL portion of 1M sodium hydroxide was added to the mixture after adding 10 mL of 1M hydrochloric acid, keeping it in a water bath at 80°C for 12 hours. Ten minutes of sonication were given to the solution, with the addition of 30 mL of diluent for hydrolysis. A total of 10 mL of 1M sodium hydroxide were poured into the sample and placed in a water bath at 80°C for 12 hours. When the diluent reached 30 mL, the mixture was exposed to sonication for 10 minutes which encourages oxidative hydrolysis. Following this, 10 mL of 30 % hydrogen peroxide were added to the workbench and left there for 12 hours. The dyes were put into an oven at 60°C for 48 hours to test thermal degradation. An exposure of 200 watt-hours per square meter of UV-A light and 1.2 million lux-hours of visible light was applied during photolytic degradation.
Results and Discussion
UV spectrophotometric method
The approach we developed for UV spectrophotometry is easy to follow, very accurate and very precise. We used methanol as our solvent. A spectrum was taken after scanning 10 μg/mL of the drug in the UV range. λ max for Ibuprofen lysine was found to be 261 nm using the UV-VIS spectra. At 261 nm, the Ibuprofen Lysine spectrum is featured in figure 2. Linear study at different power levels was presented in figure 3.
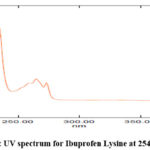 |
Figure 2: UV spectrum for Ibuprofen Lysine at 254nm Click here to View Figure |
Determining the limit of detection showed that Ibuprofen Lysine is easily detected in amounts more than 1.2032 µg/ml. The amount of ibuprofen lysine needed to detect a signal was 3.6462 µg/ml. Ibuprofen Lysine had a precision % RSD of 1.1437. RSD results below 2 % found this new UV technique to be accurate. Several recovery studies verified that the method works correctly. The investigators reported that the recovery rate for Ibuprofen Lysine was between 99.56 and 100.27 Ibuprofen Lysine. Ibuprofen Lysine had a recovery % RSD lower than 2 % which showed that the excipients were not affecting the result. As a result, the approach was found to be reliable. Since the RSD was very low, the technique became more robust after being improved. You can find the UV validation parameters results in Table 1. Each degradation study had less than 20 % degradation overall. So, it did not allow any degeneration. The numbers in table 1 reflect the reports.
 |
Figure 3: Overlay spectrum for linearity study Click here to View Figure |
Table 1: Report for UV Validation method
| Parameter | Details for Ibuprofen Lysine |
| Concentration Range | 13.68 to 82.08 µg/ml |
| Correlation Coefficient (r) | 0.9995 |
| Regression Equation | Y = 0.0109 × X + 0.0444 |
| Slope (m) | 0.0109 |
| Intercept (c) | 0.0444 |
| Limit of Detection (LOD) | 1.2032 µg/ml |
| Limit of Quantification (LOQ) | 3.6462 µg/ml |
| Assay Result (Mean % Recovery) | 99.89 % |
| Accuracy (% Relative Standard Deviation, RSD) | 1.05 % |
| Precision (% RSD) | 1.14 % |
| Solution Stability over 48 hours (% RSD) | 1.42 % |
RP-HPLC method
Improvement of Chromatographic method
The process of setting parameters, including keeping apart analytes, improving both resolution and their retention, using chemometric techniques, design on surfaces and Derringer’s desirability function, was supervised. So, limit by employing a central composite design maximum separation may be achieved and a clearer view of multiple parameters of how these many chromatogram quality differences interact to give a take a victory away from one type another. Using a central composite design experiment, the key chromatographic parameters are chosen and their effects were optimized. The chosen parameters are adjusted according to the results of risk analysis. Quality by Design (QbD) is a systematic approach to developing and optimizing chromatographic methods, ensuring robust and reproducible results. The QbD framework focuses on understanding the method’s critical parameters and their impact on performance, leading to high-quality analytical outcomes16,17.
Central Composite Design (CCD) is a statistical tool used in Design of Experiments (DoE) to optimize chromatographic methods systematically. The critical aspect is to optimize conditions by studying the effects of multiple factors and their interactions with an eye towards minimizing experimentation. CCDs are greatly advantageous for Response Surface Methodology (RSM) because of their ability to develop quadratic models, which allows for the prediction of optimal conditions during chromatographic separations such as HPLC, UPLC, and GC. The Objective and Critical Quality Attributes (CQAs), identify the method’s goal (e.g., maximizing resolution, minimizing retention time, improving peak symmetry). the response variables of CQAs were Retention time, resolution between peaks, peak area, asymmetry factor, theoretical plates18,19.
In this work, a statistical screening design (CCD) was used to optimize the constitutive parameters. We also evaluated the square effects of interaction effects and qualification (RT), tailing factor (T), and resolution (RS) using the POR response interface method. For example, using Central Composite Design to carry out experiments. Full quadratic regression models for the three factors were evaluated using a CCD design with 20 experimental runs on a Design Expert 12 platform.
The regression is written as Y= β0+ β1A+ β2B+ β3C+ β12AB+ β13AC+ β23BC+ β11A2+ β22B2+ β33C2
where Y refers to what the model is trying to explain, β is the regression coefficient and X1, X2 and X3 mean A, B and C and Y is made up of values for retention time, peak height and resolution formed by responses at different settings: flow rate, wavelength and acetonitrile concentration. The findings from the first experiments led to the selection of the dependent and independent variables with low, medium and high levels. The reactions to the combination factors used in the trial setup have been observed20,21.
The best conditions were found with acetonitrile in the mobile phase (55–65 %; v/v) and a pH of the buffer between 2.8 and 3.2, both with a flow rate of 1.8–2.2 mL/min. The first peak (RSJ) and its tailing factor (T1), the retention time of the Ibuprofen lysine (IBL) second peak (Rt2) and the resolution between the second and third peaks were determined (Rs2,3). Table 2 presents the central composite designs and responses.
Table 2: Central composite design arrangements and Responses
| Std | Run | Space type | Factor A:ACN con ml |
Factor B:buffer pH | Factor C:flow rate ml/min | Response 1 R1 tailing factor | Response 2 R2 Rt2 min | Response 3 R3 Rs2,3 min |
| 19 | 1 | Center | 60 | 3 | 2 | 1.249 | 4.964 | 6.952 |
| 15 | 4 | Center | 60 | 3 | 2 | 1.249 | 4.964 | 6.952 |
| 20 | 10 | Center | 60 | 3 | 2 | 1.249 | 4.964 | 6.952 |
| 17 | 11 | Center | 60 | 3 | 2 | 1.249 | 4.964 | 6.952 |
| 16 | 15 | Center | 60 | 3 | 2 | 1.249 | 4.964 | 6.952 |
| 18 | 16 | Center | 60 | 3 | 2 | 1.249 | 4.964 | 6.952 |
| 14 | 2 | Axial | 60 | 3 | 2.33636 | 1.043 | 4.623 | 6.532 |
| 9 | 3 | Axial | 51.591 | 3 | 2 | 1.152 | 4.523 | 6.612 |
| 10 | 6 | Axial | 68.409 | 3 | 2 | 1.096 | 4.41 | 6.314 |
| 13 | 12 | Axial | 60 | 3 | 1.66364 | 1.421 | 5.102 | 7.01 |
| 11 | 13 | Axial | 60 | 2.66364 | 2 | 1.356 | 5.096 | 6.579 |
| 12 | 20 | Axial | 60 | 3.33636 | 2 | 1.152 | 4.779 | 6.756 |
| 4 | 5 | Factorial | 65 | 3.2 | 1.8 | 1.201 | 4.523 | 6.756 |
| 3 | 7 | Factorial | 55 | 3.2 | 1.8 | 1.645 | 5.013 | 6.854 |
| 5 | 8 | Factorial | 55 | 2.8 | 2.2 | 1.109 | 4.702 | 6.709 |
| 7 | 9 | Factorial | 55 | 3.2 | 2.2 | 1.192 | 4.615 | 6.809 |
| 2 | 14 | Factorial | 65 | 2.8 | 1.8 | 1.194 | 4.812 | 6.705 |
| 1 | 17 | Factorial | 55 | 2.8 | 1.8 | 1.212 | 5.012 | 6.541 |
| 6 | 18 | Factorial | 65 | 2.8 | 2.2 | 1.189 | 4.705 | 6.612 |
| 8 | 19 | Factorial | 65 | 3.2 | 2.2 | 1.173 | 4.912 | 6.564 |
For the fitted model, the interaction with the largest absolute coefficients was AC (0.1238 AC) of retention time (Rt2). Rt2 showed a strong beneficial interaction between A and C (p < 0.0001). According to the study, with increase concentration of Acetonitrile, the retention time of Ibuprofen lysine was lowered gradually and used in high level and low level in flow rate (ml/min) and was then reported.
Table 3: Reduced reaction Statistical Parameters and Surface Models taken from ANOVA
| Outputs | Model | Adjusted
R² |
Significance | Variability
(%) |
Sensitivity |
| Tailing factor(T1) | +1.25-0.0363*A+0.0120*B+- 0.0897*C+0.0656*AB+0.0654*AC-0.0466*BC-0.0360*A2+0.0100*B2+0.0022*C2
|
0.5309 | 0.0353 | 7.16 | 7.6359 |
| Retention time (Rt2) | +4.96-0.0425*A-0.0513*B-0.0902*C+0.0005*AB+0.1238*AC+0.0510*BC-0.1666*A2
-0.0001*B2-0.0266*C2
|
0.7816 | 0.0012 | 2.00 | 10.3546 |
| Resolution
(Rs2,3) |
+6.95-0.0569*A+0.0461*B-0.0707*C-0.0513*AB-0.0510*AC-0.0390*BC-0.1448*A2-0.1263*B2-0.0359*C2 | 0.7204 | 0.0037 | 1.61 | 7.1332 |
To analyze the findings, the resultant models were evaluated using perturbation plots, as well as, the 3D response surface plots. The variables with the highest absolute coefficients (quadratic and interaction phrases) were selected for the columns of response floor plots in geared up patterns. In the fitted model, the interaction with the highest absolute coefficient was ac (0.1238 AC) of the retention time (Rt2). With a p-value of Rt2, the strongest positive correlation between a and c was statistically significant. Shadow views of the response surface plots used in figure 4b were used to illustrate the extent and direction in which the response varied as each factor was allowed to move away from the selected reference point. The steepest slope or curve indicated the response sensitivity for each given element. As shown in Figure 5b, the best factor that influences retention time (Rt2) is Acetonitrile concentration (factor A). As Acetonitrile organic solvents are more polar in nature so it decreases retention time of polar analyte (Ibuprofen Lysine) because it will compete more efficiently than polar stationary phase with the analyte (Ibuprofen Lysine). Retention time (Rt2) was impacted by flow rate (factor C), and buffer pH (factor B) was significantly impacted by the remaining factors on tailing factor T1. The resolution for Rs 2,3 was not significantly impacted by Factors A and B. The retention time is often shortened by increasing the amount of organic solvent in the mobile phase. Analyzing the optimization models’ perturbation and response plots showed that factors A and B significantly impacted the analyte ability to separate. In the current study, the global optimization of three replies and the selection of several optimal conditions for the formulation analysis were conducted using Derringer’s desirability function. Tailing factor, resolution time, and resolution between peaks were determined as the optimization criteria. The derringer’s desirability function or d, is created by averaging the various desirability functions, weighted or unweighted. According to the description, the preference function of derringer is:
D = [d1 p2 x d2 p2 x d3 p2 x……… x d npn]1/n
Each response has a unique desirability function, d1, there are a total of n responses available and pi represents how much outcome is achieved. The desirability function (d) is allowed to range between 0 and 1. Ranges in weight start from 0.1 up to 10. The importance of the goal is increased when its weight surpasses 1, and decreased when its weight falls below 1. The guidelines for maximizing every single reply (Table 4)22,23.
Table 4: Criteria for Optimizing Individual Responses
| Response | Lower limit | Higher limit | Criteria / Goal |
| Tailing factor | 1.043 | 1.645 | minimize |
| RT | 4.41 | 5.102 | Is in range |
| RS | 6.314 | 7.01 | minimize |
So, based on that minimize of the tailing factor(T1) for Ibuprofen related substance (RSJ) last peak, Retention time (Rt2) of Ibuprofen Lysine second eluting peak was in range and displayed Resolution (Rs2,3) for Ibuprofen related substance of last peak C was minimize suggested to incline analysis time in criteria. According to the above conditions and restrictions, the optimization process was executed. Figure 6 showed the 3D surface generated for the desirability function of the Derringer24,25.
The range of coordinates with the maximum desirability value (D = 0.915) showed that 55-65 % acetonitrile, pH 2.8-3.2 buffer, a flow rate of 1.8-2.2 mL/min and 254 nm wavelength were most desirable for the mobile phase. 10 mM buffer at 65 %v/v, pH 3.2 in the mobile phase worked best with a flow rate of 2.2 mL/min. As well as predicting the parameter response values associated with the later value of D T1= 1.193, Rt2 = 4.760 min and Rs2,3=6.618 min. The observed variations of the experimental responses, compared with the predicted responses are in good agreement within a 4.64 % range. Table 5a shows the average error percentage using the following equation. The standard & related substance optimized chromatogram were shown in figure 7-8.
![]()
Table 5a: Ideal conditions: Expected vs experimental values for different functions
| Optimum conditions | ACN Comp (%v/v) | Buffer pH | Flow rate (ml/min)
|
Tailing Factor
|
Retention time | Resolution |
| Predictive | 65 | 3.2 | 2.2 | 1.193 | 4.760 | 6.618 |
| Experimental | 65 | 3.2 | 2.2 | 1.249 | 4.964 | 6.952 |
| Average error | 4.69 | 4.2 | 5.03 | |||
| Desirability value (D) = 0.915 | ||||||
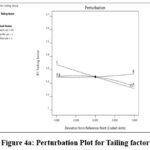 |
Figure 4a: Perturbation Plot for Tailing factor Click here to View Figure |
 |
Figure 4b: Perturbation Plot for RT Click here to View Figure |
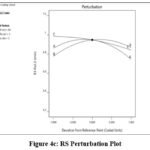 |
Figure 4c: RS Perturbation Plot Click here to View Figure |
 |
Figure 5a: 3D Surface for Tailing Factor Click here to View Figure |
 |
Figure 5b: 3D Surface for RT Click here to View Figure |
 |
Figure 5c: 3D Surface for RS Click here to View Figure |
 |
Figure 6: 3D Plots for Derringer’s Desirability function Click here to View Figure |
 |
Figure 7: Chromatogram for Standard solution Click here to View Figure |
 |
Figure 8: Chromatogram for Ibuprofen Lysine and its related substance Click here to View Figure |
Method Validation
Interference against e.g. Diluent and Placebo was used to assess specificity. Retention time, purity angle and peak purity were observed. It was determined to be within the limit. In table 5b, the system suitability parameters reports. Six injections of spiked standard solutions were performed using the HPLC system. RSD was determined for peak area and retention time. The %RSD value for retention time of RSJ, IBL and RSC was found to be 0.1, 0.1 and 0.1% respectively. This indicated that the %RSD value was 0.2 for RSJ, 0.2 for IBL and 0.1% for RSC. The % RSD value was calculated and found to be within limit (i.e., < 2%). So it reasons the method was accurate. The Linearity solutions were prepared from the stock solution by quantitative dilutions to final solutions within a range 25% to 200% of working concentration. At least six levels of established linearity. The range of linearity concentration was 8.7- 69.4 μg/mL for RSJ, 8.6-68.8 µg/mL IBL and10. 46- 62.77 µg/mL for RSC. The Pearson’s coefficient correlation was 0.9982, 0.9972 and 0.9995 for the DLUQ (IBL), RSC and RSJ respectively. The method was linear as R2value was found to be 0.999. LOD was calculated based on linearity curve and signal to noise ratio. LOD was calculated as 1.7 µg/mL for RSJ, IBL and RSC by using calibration curve. Mean signal to noise ratio was 1121.6, 5.31 and 817.85 for RSJ, IBL and RSC respectively. Limits of quantification (LOQ) using calibration curve 4.96 µg/mL, 4.99 µg/mL and 5.0 µg/mL for RSJ, IBL & RSC respectively. The mean signal to noise ratio for RSJ, IBL and RSC were also found to be 2672.21, 13.08 and 1985.56 respectively. Here LOQ and LOQ value were found within the limit which is 3 and 10 respectively. So, it was decided the method was sensitive.
The precision must be evaluated over the entire analytical range LOQ, at 50 %,100 %,150 % and 200 % of the upper limit every an analytical method must be established. Mean recovery may be expressed as a percentage and ranged from 88.4 % to 113.3 % for RSJ, 94.3 % to 107.2 % for RSC, and 94.7 % to 117.9 % for IBL. The value of % RSD was found to be less then 2%. Therefore, it was determined that the excipients did not interact with the API. Consequently, the developed procedure was verified. Vary the control sample, the flow rate by 0.9 to 1.1 mL/min, the wavelength by 2 nm and the column temperature by 5°C. All system suitability parameters fell within the limits set by the method. As a result, the technique could reliably be used for analyzing related substances in Ibuprofen Lysine. At 25°C, the standard solution remained stable for 48 hours. Ibuprofen-related compound C had a percentage RSD value of 3.22, while compound J had a percentage RSD value of 4.71. After 48 hours at room temperature, the sample solution’s percentage RSD values were determined. The % RSD value for Ibuprofen Lysine was found to be 4.5 %. The reports were shown in table 6.
In the forced degradation study, it was imperative to maintain a mass balance within the range of 95 % to 105 %. The methods employed for all stressed conditions met this criterion, ensuring the reliability of the results. The percentage degradation was obtained from the stressed samples under various conditions using both assay and related substances procedures for the comparison of mass balance ratio. The % degradation of acid stress conditions was found to be 0.37 %. In contrast, minimal degradation was observed under Humidity stress conditions. This indicated clear and organized presentations of results were obtained. Table 7 shows the reports.
Table 5b: Data for system suitability parameters
| Parameters | Related substance (J) | Ibuprofen Lysine | Related substance (C) |
| Retention time (min) | 2.513 | 4.964 | 7.089 |
| Tailing factor | 1.249 | 1.371 | 1.162 |
| Peak Area | 129454 | 3179224 | 113001 |
| Number of theoretical plates (USP) | 3775 | 5115 | 7220 |
| Resolution(min) | – | 11.108 | 6.952 |
Table 6: Report on validation parameters for the RP-HPLC method
| Parameters | Related substance (J) | Ibuprofen Lysine | Related substance (C) |
| Range (µg/mL) | 8.7- 69.4 | 8.6-68.8 | 10.46- 62.77 |
| Correlation Coefficient (r) | 0.9972 | 0.9982 | 0.9995 |
| Regression equation (Y=mx+c) | 21417.095023x – 35083.769796 | 201.997264x – 282.872549 | 27236.739734x – 29308.226113 |
| Slope (m) | 21417.095023 | 201.9973 | 27236.739734 |
| Intercept (c) | 35083.769796 | -282.8725 | 29308.226113 |
| LOD (µg/mL) | 1.7 | 1.7 | 1.7 |
| LOQ (µg/mL) | 4.96 | 4.99 | 5.0 |
| Accuracy (% RSD) | 0.56 | 1.78 | 0.34 |
| Precision (% RSD)
Retention time Peak area |
0.1 0.2 |
0.1 0.2 |
0.1 0.2 |
Table 7: Forced degradation studies data
| Degradation Condition | % Assay | % Degradation | % Assay | % Degradation |
| Ibuprofen Lysine (RP-HPLC) | Ibuprofen Lysine (UV) | |||
| Acid Hydrolysis | 99.9 | 0.23 | 98.42 | 1.58 |
| Alkali Hydrolysis | 101.2 | 0.37 | 99.04 | 0.96 |
| Oxidative degradation | 98.6 | 0.41 | 96.46 | 3.36 |
| Photolytic degradation | 98.6 | 0.64 | 97.14 | 2.86 |
| Humidity degradation | 99.5 | 0.22 | 95.01 | 4.98 |
| Thermal degradation | 95.1 | 0.18 | 97.42 | 2.58 |
As indicated in table 8, the published RP-HPLC approach shows lower LOD and LOQ than the method presented here. The technique was found to be sensitive since DL and QL were both much lower than seen in the previous procedure. As a consequence, the method became more sensitive than reported in previous studies. In addition, the RP-HPLC technology described in section 2 shows greater linearity than the approach presented in section 1. Both drugs showed faster clearance out of the blood than the earlier approach26.
Table 8: Comparison of developed and reported methods for RP -HPLC
| Drug name | Parameter | Development method | Reported method |
| Ibuprofen Lysine | Retention time (min) | 4.964 | 6.27 |
| Accuracy (%) | 94.7 – 117.9 | 96.37-102.6 | |
| LOD (µg / mL) | 1.7 | 27 | |
| LOQ (µg / mL) | 4.99 | 99 |
The UV method was found to have better sensitivity than the RP-HPLC method, since it had lower LOD and LOQ values, as shown in Table 9. HPLC showed DL and QL values much lower than those found by the UV method, showing that the UV method has good sensitivity. Consequently, using the UV technique made it easier to detect Ibuprofen lysine than with HPLC. For this reason, the RP-HPLC technique was good for typical routine testing of related substance and ibuprofen lysine. At least 2 liters of LC and 4 Days of C and J for this estimation.
Table 9: Comparison of UV method & RP-HPLC method
| Specifications | UV | RP-HPLC |
| Retention time and absorbance | Absorbance 261nm | Retention time 4.964 min |
| LOD (µg/mL) | 1.2032 | 1.7 |
| LOQ (µg/mL) | 3.6462 | 4.99 |
| Linearity(µg/mL) | 13.68-82.08 | 8.6-68.8 |
Correlativity between the UV and RP-HPLC method
Six samples were picked up from each batch and RP-HPLC and UV were used together to compare the two new techniques. The HPLC and UV methods were compared statistically, choosing a level of confidence of 95 % (P=0.05). The method-sample interactions were analyzed using the two-way ANOVA test. Since both tests had an F stat under the F crit, that meant there was no important change detected in either method or method-sample interaction (Refer to Table 10 a & b). As reported by the student t-test, the t-statistic came out much smaller than the t-critical value for both groups (Table 11a&b).
Table 10a: Low of variation: Two-way ANOVA Test of Ibuprofen Lysine in six-independent samples of UV and HPLC
| Two way ANOVA Test of Ibuprofen Lysine determination | ||||
| HPLCa | UVa | |||
| Sample | First sampling | Second sampling | First sampling | Second sampling |
| 1 | 342.1 | 341.5 | 340.6 | 341.6 |
| 2 | 340.5 | 340.5 | 342.2 | 340.3 |
| 3 | 341.9 | 342.0 | 340.4 | 342.2 |
| 4 | 340.2 | 341.3 | 341.5 | 341.7 |
| 5 | 342.2 | 340.8 | 342.2 | 342.1 |
| 6 | 341.4 | 341.7 | 341.6 | 340.9 |
Table 10b: ANOVA: Two-Factor with Replication
| Source of Variation | Sum of Squares (SS) | Degrees of Freedom (df) | Mean Square (MS) | F Statistic (F) | P-Value | F Critical (F crit) |
| Group | 0.337778 | 2 | 0.168889 | 0.202667 | 0.821918 | 5.143253 |
| Factor | 0.3088 | 2 | 0.1544 | 0.18528 | 0.835451 | 5.143253 |
| Interaction Effect | 0.982756 | 4 | 0.245689 | 0.294827 | 0.871377 | 4.533677 |
| Error | 5 | 6 | 0.833333 | |||
| Overall Total | 6.629333 | 14 |
Table 11a: Study the Determination of HPLC and UV and their correlation by paired t-Test Student t-Test for Ibuprofen Lysine
| Sample | HPLC | UV |
| 1 | 342.1 | 340.6 |
| 2 | 340.5 | 342.2 |
| 3 | 341.9 | 340.4 |
| 4 | 340.2 | 341.5 |
| 5 | 342.2 | 342.2 |
| 6 | 341.4 | 341.6 |
| Average | 341.4 | 341.4 |
Table 11b: Student t-Test: Paired two sample for Means (Ibuprofen Lysine)
| Metric | Variable 1 | Variable 2 |
| Average | 341.42 | 341.38 |
| Dispersion | 0.59 | 0.73 |
| Sample Size | 6 | 6 |
| Correlation Coefficient | -0.38 | |
| Assumed Mean Difference | 0 | |
| Degrees of Freedom | 5 | |
| t Value | 0.06 | |
| One-tailed Probability | 0.48 | |
| One-tailed Critical Value | 2.02 | |
| Two-tailed Probability | 0.95 | |
| Two-tailed Critical Value | 2.57 |
Conclusion
The study successfully developed and validated sensitive and trustworthy techniques for the detection of Ibuprofen Lysine and related chemicals using UV spectroscopy and RP-HPLC. The optimization process includes the fine or tuning of some significant chromatographic parameters used, such as buffer pH, flow rate, and mobile phase composition, by using the Design of Experiments (DoE) technique (central composite design).. Extensive validation measurements verified that both procedures had sufficient precision and accuracy, and both showed strong linearity, with a correlation coefficient of 0.9991 for RP-HPLC across the defined concentration range. It was demonstrated that the RP-HPLC method outperformed other methods in terms of sensitivity and analytical capabilities, making it a useful instrument for pharmaceutical quality monitoring. Moreover, the proposed UV method displayed lower limits of detection and quantification, showcasing its sensitivity.
Acknowledgement
The authors thank Sunglow Lifescience Private Limited for its support in providing the gift sample of Ibuprofen Lysine tablets and the research equipment. The authors would like to express their gratitude to the management board of Vels Institute of Science, Technology and Advanced Studies, (VISTAS), Pallavaram, Chennai, for helping with our research, motivating us and ensuring guidance was ready.
Funding Sources
The author(s) received no financial support for the research, authorship, and/or publication of this article.
Conflict of Interest
The author(s) do not have any conflict of interest.
Data Availability Statement
This statement does not apply to this article.
Ethics Statement
This research did not involve human participants, animal subjects, or any material that requires ethical approval.
References
- PubChem. (n.d.). www.pubchem.ncbi.nlm.nih.gov
- Antal, E. J., Wright, C. E., III, Brown, B. L., Albert, K. S., Aman, L. C., & Levin, N. W. (1986). The influence of hemodialysis on the pharmacokinetics of ibuprofen and its major metabolites. Clin. Pharmacol., 26(3), 184-190.
CrossRef - Nahata, M. C. (1991). Stability of labetalol hydrochloride in distilled water, simple syrup, and three fruit juices. Dalian Inst. Chem. Phys., 25(5), 465-469.
CrossRef - Blessy, M., Patel, R. D., Prajapati, P. N., & Agrawal, Y. K. (2014). Development of forced degradation and stability indicating studies of drugs—A review. Pharm. Anal., 4(3), 159-165.
CrossRef - Patel, N. V., Patel, J. K., Shah, S. H., & Patel, J. N. (2011). Central composite design for the formulation and optimization of a multi-unit potential colonic drug delivery system of budesonide for ulcerative colitis. Die Pharmazie, 66(2), 124-129.
- Sawyer, S. F. (2009). Analysis of variance: The fundamental concepts. Man. Manip. Ther., 17, 27-37.
CrossRef - Borahan, T., Unutkan, T., Şahin, A., et al. (2018). A rapid and sensitive reversed phase-HPLC method for simultaneous determination of ibuprofen and paracetamol in drug samples and their behaviours in simulated gastric conditions. Sep. Sci., 42(3), 678-683.
CrossRef - Hermawan, D., Suwandri, Novianti, R., et al. (2025). Development of high-performance liquid chromatography method for enantio-separation of ibuprofen. Rasayan J. Chem., 18(1), 46-51.
CrossRef - Upmanyu, B., Awasthi, P., & Thakur, A. (2024). HPLC spectroscopy method development and validation for simultaneous estimation of ibuprofen, paracetamol, serratiopeptidase. World J. Pharm. Res., 13(16), 1002-1019.
- Atilgan, N., Tabansiz, G., Turkes, E., et al. (2024). Stability-indicating HPLC method for determination of ibuprofen and famotidine degradation products. Chromatogr. Sci., 62(8), 751-760.
CrossRef - Elias, K. G., & Hilal, Y. (2023). Development and validation of a simple and sensitive reverse-phase high performance liquid chromatographic method for determination of ibuprofen in pharmaceutical suspensions. Baghdad Sci. J., 20(2), 550-559.
CrossRef - Kelani, K. M., Fayez, Y. M., Abdel-Raoof, A. M., et al. (2023). Development of an eco-friendly HPLC method for stability indicating assay of binary mixture of ibuprofen and phenylephrine. BMC Chem., 17, 141.
CrossRef - Supe, K. S., & Patil, J. J. (2022). Analytical method development and validation of ibuprofen by UV spectroscopy. World J. Pharm. Res., 11, 1420-1430.
CrossRef - Jain, A., Agarwal, P., Kumawat, A., et al. (2011). Evaluation and validated UV-spectroscopic method for estimation of ibuprofen from marketed tablets. J. Pharm. Technol., 4(4), 620-623.
- Supe, K. S., & Patil, J. J. (2022). Analytical method development and validation of ibuprofen by UV spectroscopy. World J. Pharm. Res.
- Fukuda, I. M., Pinto, C. F., Moreira, C. D., Saviano, A. M., & Lourenco, F. R. (2018). Design of experiments (DoE) applied to pharmaceutical and analytical quality by design (QbD). J. Pharm. Sci., 54.
CrossRef - Hibbert, D. B. (2012). Experimental design in chromatography: A tutorial review. Chromatogr. B., 910, 2-13.
CrossRef - Bhattacharya, S. (2021). Central composite design for response surface methodology and its application in pharmacy. In Response Surface Methodology in Engineering Science. Intech Open.
CrossRef - Patel, N. V., Patel, J. K., Shah, S. H., & Patel, J. N. (2011). Central composite design for the formulation and optimization of a multi-unit potential colonic drug delivery system of budesonide for ulcerative colitis. Die Pharmazie, 66(2), 124-129.
- Bhattacharya, S. (2021). Central composite-design for response surface methodology and its application in pharmacy. IntechOpen.com.
CrossRef - Oyejola, B. A., & Nwanya, J. C. (2015). Selecting the right central composite design. J. Stat. Appl., 5(1), 21-30.
- Rajmohan, T., & Palanikumar, K. (2013). Application of the central composite design in optimization of machining parameters in drilling hybrid metal matrix composites. Measurement, 46, 1470-1481.
CrossRef - Costa, N. R., & Lourenco, J. (2016). Multiresponse problems: Desirability and other optimization approaches. Chemom., 30, 702-714.
CrossRef - Costa, N. R., Lourenco, J., & Pereira, Z. L. (2011). Desirability function approach: A review and performance evaluation in adverse conditions. Intell. Lab. Syst., 107, 234-244.
CrossRef - Baraskar, S. S., Banwait, S. S., & Laroiya, S. C. (2011). Multi-objective optimisation of electrical discharge machining process using Derringer’s desirability function approach. J. Mater. Eng. Innov., 2(3/4), 203-221.
CrossRef - Aldewachi, H., & Omar, T. A. (2022). Development of HPLC method for simultaneous determination of ibuprofen and chlorpheniramine maleate. Pharm., 90, 53.
CrossRef
Second Review by: Dr. J. Swaminathan
Final Approval by: Dr. Ayssar Nahl


![]()


