Spectrophotometric Analysis of Soybean Oil

University of Bucharest, Faculty of Chemistry, Department of Physical Chemistry, Elisabeta Blvd, Bucharest, Romania
Corresponding Author E-mail: istanciu75@yahoo.com
Download this article as:
ABSTRACT:In this article, we determined by the spectrophotometric method, the transmittance spectra for non-oxidized and oxidized soybean oil for 5 and 10 hours at temperatures between 100ºC and 110ºC.It is noted that the transmittance spectrum shape of 5 hours oxidized soy bean oil is reminiscent with the transmittance spectrum shape of non oxidized soy bean oil with marked changing only in the ultraviolet band, respectively in the range 300 nm 380 nm. In both cases, it is apparent, in the visible band, the appearance of a pronounced peak at 666 nm.
KEYWORDS:Analysis; Oil; Spectrophotometry; Soy
Introduction
Spectrophotometry is a branch of molecular spectroscopy that deals with the qualitative and quantitative analysis of absorption spectra of electromagnetic radiation in the range of wavelengths 200 nm – 1100 nm, of absorbing materials usually found in solutions.1
Visible and ultraviolet spectroscopy is among the earliest physical techniques used to study organic compounds. Both types of spectra are related to electronic transitions that take place when a molecule moves from its ground state to an excited state. Consequently, these spectra—known as electronic spectra—provide information about the electronic structure of molecules.
Spectrophotometry is an optical technique used to determine the concentration of components present in a sample. It involves the quantitative measurement of a substance’s absorption or emission spectra. Compounds that absorb radiation in the visible region appear colored, exhibiting hues complementary to the absorbed wavelengths. This principle allows the determination of the amount of light absorbed by a solution, as the intensity of transmitted radiation is directly related to the concentration of the absorbing species in the analyzed sample.
This method is based on irradiating the sample to be analyzed with a beam of electromagnetic radiation, whose radiant power decreases upon exiting the system depending on the nature and concentration of the absorbing species.
Spectroscopy is a broad term used to describe a group of experimental methods and techniques that monitor and measure the absorption or emission of energy by a sample during qualitative and/or quantitative chemical analysis.
When using spectroscopy in qualitative chemical analysis, the purpose of spectroscopy is to obtain from a spectrum information about the analyzed sample, such as: internal structure, composition, dynamics.
Spectrophotometry is a branch of molecular spectroscopy that deals with the qualitative and quantitative analysis of absorption spectra in the UV-VIS range of organic or inorganic substances in liquid state. Because in the UV-VIS field not all substances or chemical elements have absorption spectra with clear maxima, the qualitative analysis is not as representative as the quantitative one. A spectrophotometer or a colorimeter uses the transmission of light through a solution to determine the concentration of a solute in that solution. Electromagnetic radiation emitted in an electromagnetic spectrum is unfolded by refraction on a prism or a diffraction grating Tn in order to precisely highlight the specific wavelengths of different elements, ions, radicals or molecules. When using spectroscopy in qualitative chemical analysis, the wavelengths of the obtained spectra are correlated with standard spectra. Quantitative chemical analysis uses the dependence between the intensity of specific spectral emissions and the concentration of elements or substances in compounds or mixtures of compounds.
A beam of radiation of intensity I0, passing through an absorbent layer under normal incidence, loses part of its radiant energy through reflection Ir and part of it is absorbed by system Ia.
The method of chemical analysis of food by spectrophotometry is a method based on the Lambert-Beer law.
So from the initial intensity, only part of the radiation is transmitted and it is denoted by It. The degree of decrease in the intensity of the incident radiation is (according to the Beer-Lambert law) proportional to the thickness of the crossed layer and to the concentration of the absorbing species:
Beer-Lambert law – expresses the relationship between the intensity of the light passing through a solution and the concentration of that solution.
In spectrophotometry, two parameters are usually used to quantify absorption:
T – is the transmission; It is extinction.
In propagation phenomena, light presents, as is known, an undulatory aspect, of an electromagnetic wave. In the phenomena of emission, respectively absorption, light presents a corpuscular aspect, that is, it behaves as if it is made up of well-determined quantities of energy, indivisible, called quanta or photons.
The explanation for the existence of photons lies in the fact that each unit of radiant energy is emitted by a microparticle: atom, ion or molecule.
The absorption or emission of a photon is related to the jumps of such a microparticle from one possible energy state to another. For such a jump it is necessary that the energy of the sister-in-law be equal to the energy difference between the two states. These transitions, related to the photon-microparticle interaction, follow certain selection rules that determine what kind of jumps from one level to another are allowed. On the other hand, a transition takes place only if certain quantum-particle interaction conditions are met.
In both chemistry and physics, various types of spectrophotometers are designed to operate across broad regions of the electromagnetic spectrum, including ultraviolet (UV), visible, infrared (IR), and microwave ranges. Among these, UV spectrophotometry is especially effective for identifying and quantifying colorless substances dissolved in solution.
In this article we determined the transmittance spectra for soybean oil oxidized 5 and 10 hours and non-oxidized at temperatures of 100ºC and 110ºC.
Material and Methods
The transmittance spectrum was determined using a T60 spectrophotometer produced by PG Instruments Limited (C.E.). Measurements were conducted over a wavelength range of 300 nm to 1100 nm, with a step size of 0.4 nm. A 10 mm glass cuvette was employed for the analysis (Fig. 1).
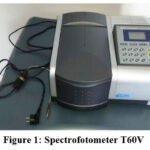 |
Figure 1: Spectrofotometer T60V Click here to View Figure |
To carry out the forced oxidation process, the system shown in Figure 2 was constructed. It consists of: 1 – an air pump, 2 – an air flow meter, 3 – an air filter, 4 – a tube containing the oil sample, and 5 – a thermostatic bath. For each oxidation experiment, 25 mL of oil was used, and the air flow rate supplied to the sample was maintained at 20 L/h.
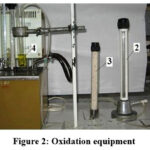 |
Figure 2: Oxidation equipment Click here to View Figure |
Results and Discussion
Soybean oil was subjected to oxidation at temperatures of 100 °C and 110 °C for durations of 5 hours and 10 hours, respectively. The transmittance spectra of soybean oil oxidized at 100 °C for 5 and 10 hours are shown in Figure 3.a. It can be observed that the transmittance spectrum of soybean oil oxidized for 5 hours closely resembles that of the non-oxidized oil, with significant differences appearing only in the ultraviolet region, specifically between 300 nm and 380 nm. In both cases, a distinct peak at 666 nm is evident in the visible region.
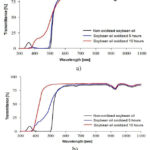 |
Figure 3: The variation of transmittances of oxidized soybean oils at temperatures of 100ºC (a) and 110ºC (b) Click here to View Figure |
Between 400 nm and 666 nm, no absorption maxima are observed; instead, only a threshold around 500 nm can be identified for both non-oxidized soybean oil and oil oxidized for 5 hours. These observations can be explained, according to2, by the degradation of certain pigments, such as carotenoids, during the industrial extraction process.
In the case of soybean oil subjected to forced oxidation for 10 hours, more significant modifications of the transmittance spectrum are evident, characterized by an increase in transmittance within the 362 nm–522 nm range. It is clear that the peak associated with chlorophyll disappears as a consequence of advanced oxidation.3-8
When the oxidation temperature is increased from 100 °C to 110 °C (Fig. 3.b), substantial changes in the shape of the transmittance spectrum are observed in the visible region for both the oil oxidized for 5 hours and that oxidized for 10 hours. This indicates that raising the temperature by 10 °C under identical experimental conditions results in a more pronounced oxidation of soybean oil.9-18
Conclusions
Changes were observed in the transmittance of the oxidized soybean oil 5 and 10 hours in comparison with the non-oxidized oil. If the oxidation temperature increases in a certain period of time, we can observe changes in the transmission spectra. Likewise, with oxidation, the parameters increase, the color differences for oxidized oil samples also increase.
References
- Zgherea, Gh., Analize Fizico – Chimice, Ed. Fundaţiei Universitare “Dunărea de Jos” Galaţi, pp. 74-80, 88-94, 2002.
- Sancez-Gimeno, A.C., Negueruela, A.I., Benito, M., Vercet, A., Oria, R., 2008, Some physical changes in Banjo Aragon extra virgin olive oil during the frying process, Food Chemistry, 110, pp. 654-658.
CrossRef - Şolea, L.C., Creţu, R., Spectrophotometric and rheological study on oxidized soybean oils, The Annals of „Dunărea de Jos” University of Galati, Fascicle XIV, Mechanical Engineering, ISSN 1224 – 5615, Galati University Press, 2013 – trimisă spre publicare.
- van der Vaart, K., Depypere, F., Graef, V. D., Schall, P., Fall, A., Bonn, D., & Dewettinck, K., 2013, Dark chocolate’s compositional effects revealed by oscillatory rheology, European Food Research and Technology, 236(6), 931-942.
CrossRef - 5. Stanciu I., 2019. Rheological behaviour of biodegradable lubricant, Journal of Science and Arts, 3(48), 703-708.
- Stanciu I., 2019. Rheological investigation of soybean oil from soya bean, Journal of Science and Arts, 4(49), 938-988.
- Stanciu I., 2011. Modeling the temperature dependence of dynamic viscosity for rapeseed oil, Journal of Science and Arts, 1(14), 55-58.
- Stanciu I., 2018. Rheology behavior of soybean oil, Journal of Science and Arts, 2(43), 453-458.
- Meneghetti S.M.P., Meneghetti M.R., Wolf C.R., Silva E.C., Lima G.E., Coimbra M.D. A., … & Carvalho, S.H.,2006, Journal of the American oil chemists’ society, 83(9), 819-822.
CrossRef - Penciu S., Beldescu A., Studiul potenţialului de export al României: Uleiuri Vegetale, Centrul Român pentru Promovarea Comerţului şi Investiţiilor Străine, 2012.
- Sheibani A., Ghotbaddini-Bahraman, N. A. S. E. R., & Sadeghi, F. A. T. E. M. E. H., 2014, Oriental Journal of Chemistry, 30(3), 1205-1209.
CrossRef - Stanciu I. 2023. Some methods for determining the viscosity index of hydraulic oil, Indian Journal of Science & Technology, 16(4), 254-258
CrossRef - 13. Stanciu 2023, Rheological behavior of corn oil at different viscosity and shear rate, Oriental Journal of Chemistry, 39(2), 335-339
CrossRef - Stanciu I. 2023, Rheological characteristics of corn oil used in biodegradable lubricant, Oriental Journal of Chemistry, 39(3), 592-595
CrossRef - Stanciu I. 2023, Effect of temperature on rheology of corn (Zea mays) oil, Oriental Journal of Chemistry, 39(4), 1068-1070
CrossRef - Stanciu I., 2021. Study Rheological Behavior of Rapeseed oils Compared to Mineral oil, Oriental Journal of Chemistry, 37(1), 247-249
CrossRef - Stanciu I., 2021. Influence of Temperature on the Rheological Behavior of Orange Honey, Oriental Journal of Chemistry, 37(2), 440-443
CrossRef - Stanciu I., 2021. Rheological Study of Orange Honey with Influence on Concentration, Oriental Journal of Chemistry, 37(4), 864-867.
CrossRef
Accepted on: 17 Feb 2026
Second Review by: Dr. Jennicav Jove
Final Approval by: Dr. B. K Sharma


![]()


