Methocarbamol Loaded Nanoemulgel for the Topical Delivery by using Central Composite Design
 , Haranath Chinthaginjala*, Nikhila Subramanyam, Priya Gogula, Maheswar Reddy Yaga
Department of Pharmaceutics, Raghavendra Institute of Pharmaceutical Education and Research (RIPER) -Autonomous, KR Palli cross, Chiyyedu (PO), Anantapur, Andhra Pradesh, India.
Corresponding Author Email: haranathriper@gmail.com
Download this article as:
ABSTRACT:The present study was aimed to formulate methocarbamol loaded nanoemulgel employing a central composite design. Particle size and zetapotential were chosen as dependent variables, while the concentration of castor oil and Smix were chosen as independent variables. The ultrasonication method was used in this study to create nano emulsions. The optimized formulations were further formulated into gel using Carbopol-934 and evaluated. Differential Scanning and Fourier Transform-Infrared Spectroscopy Studies using calorimetry showed that the drug could be identified and that the excipients and drug were physically compatible. Formulation F5 showed a zetapotential of 19.5 mv and a particle size of 314.5 nm with a polydispersity index of 0.445. F8 showed a zetapotential of -19 mv and a particle size of 393.5 nm with a polydispersity index of 0.458. The optimized formulations i.e., F5 and F8 which were further formulated into emulgel. The findings showed that the statistical model is effective from a scientific standpoint because the estimates predicted by the models were fairly close to one another.
KEYWORDS:Central-Composite Design; Contour plots; In-vitro permeation; Methocarbamol; Nanoemulgel
Introduction
For medications with low bioavailability and a lipophilic nature that are administered via various routes in addition to the topical route, nano emulsion is the most efficient delivery system1. Oil, water, and emulsifier combine to form nano emulsions, which are colloidal dispersions with droplets ranging in size from 20 nm to 500 nm2. Because it reduces the interfacial tension between the water and oil phases of the nano emulsion3, the emulsifier is essential for producing tiny droplets3.
Nanoemulgels are topical gels contain nano emulsions. In dermatology, they are frequently used to treat skin disorders like psoriasis, acne, eczema, and relief4. They can also be used to deliver medications for pain relief, anti-inflammatory agents, and anti-infective agents5. Higher drug solubilization in the oily phase leads to a higher concentration gradient towards the skin, which in turn raises drug’s skin permeability6. Methocarbamol is a muscle relaxer. It works by blocking nerve impulses that are sent to our brain. The drug is rapidly absorbed by the gastrointestinal tract and reaches the peak plasma concentrations at 2 hours7. Methocarbamol is metabolized via dealkylation, hydroxylation, and conjugation in the liver. The half-life of methocarbamol range between 1 to 2 hrs before being excreted into the urine8. Particle size and zeta potential were chosen as dependent variables, while the concentration of castor oil and Smix were chosen as independent variables9. Quality by Design is a systematic approach to development that emphasizes understanding and control of the product and process while beginning with predetermined goals. Respecting high-quality risk management and sound science10. It necessitates identification of all important formulation and process parameters, and also assessment of the influence of any deviation on the completed product’s quality11. Because of their ability to deliver both hydrophilic and lipophilic drugs, nano emulsions are currently attracting a lot of interest from the biopharmaceutical and cosmetics industries12. They can be used as a drug delivery system via a variety of systemic routes, including oral, topical, and others13. Because it has a higher succour capacity than creams and ointments and has less stickiness, patient adherence has been greatly improved14. Nanoemulgel has achieved high patient acceptability due to the advantages of both nano emulsion and gel15.
Materials and Methods
Materials
Alphamed Pvt. Ltd. in Anantapur, Andhra Pradesh, offered methocarbamol as a complimentary. The Tween 80 was supplied by Mumbai-based Loba Cheme Pvt Ltd. The PEG 400 was supplied by Mumbai-based Loba Cheme. Every material used was of analytical quality.
Methods
Fourier Transform-Infrared (FT-IR) studies
The compatibility of drug with the excipients was determined by using FT-IR. The drug and excipients are taken in small amounts and blend with Potassium Bromide (KOH), compressed to form thin pellets16. These are analysed using FT-IR, and scanned from range of 4000cm-1 to 400cm-1 range using FT-IR spectrophotometer (Schimadzu 1800).
Differential Scanning Calorimetry (DSC) studies
The DSC equipment (Venchal Scientifics, 412105, USA) was engaged to conduct the DSC investigations. This method is also used for determining drug excipient compatibility studies. The drug and excipients are taken in small amount in aluminium pan and it is sealed17. The sample was analysed using DSC.
Optimization by the CCD
Sigma Tech software Version 3.1 was utilized in the current study to design the experimentation of the methocarbamol nanoemulgel using a 22factorial design. A two level two factor (22) full factorial design was applied to optimize the nano emulsion. Independent variables were selected as Concentration (conc.) of Castor oil (X1) and Smix (X2). All were set at low level and high level signified in table 1. Responses were chosen as Particle size (PS) and Zeta potential (ZP). According to factorial design, nine formulations (F1-F9) were manufactured. The considerable curvature result was obtained and model was seen to be non-linear so the software suggested to use CCD. The nondependent factors recognized are castor oil (X1) and Smix (X2). The outcome elected was % DR and developmental trials were signified in table 2.
Table 1: Experimental design of nanoemugel as per 22 factorial level
| Sr. No. | Factors | Units | Low level (-1) |
High level
(+1) |
| 1 | Castor oil | % | 7.5 | 12.5 |
| 2 | Smix | % | 37.5 | 42.5 |
Table 2: Central Composite Design layout of formulations (F1-F9)
| Formulation code | Combination | Castor oil(X1)
In % |
Smix(X2)
In % |
| F1 | ɪ | 7.5 | 37.5 |
| F2 | X1 | 12.5 | 37.5 |
| F3 | X2 | 7.5 | 42.5 |
| F4 | X1X2 | 12.5 | 42.5 |
| F5 | Midpoint | 10.0 | 40.0 |
| F5 | Midpoint | 10.0 | 40.0 |
| F5 | Midpoint | 10.0 | 40.0 |
| F5 | Midpoint | 10.0 | 40.0 |
| F6 | X1At-2L | 5.0 | 40.0 |
| F7 | X1At+2L | 15.0 | 40.0 |
| F8 | X2At-2L | 10.0 | 35.0 |
| F9 | X2At+2L | 10.0 | 45.0 |
Method of preparation of nano emulsion
The composition of all formulations was presented in Table 3. Methocarbamol drug was weighed accurately. Transfer the required amount of drug into a beaker and dissolved in castor oil. Then Smix were added into it18. Further the required quantity of water has added and stirred it. Then the mixture is kept for homogenisation for 20mins and sonicated the mixture by ultrasonication method by using probe sonicator for 20mins to attain translucent nano emulsion.
Table 3: Composition of Methocarbamol Nano emulsion (F1-F9)
| Ingredients | F1 | F2 | F3 | F4 | F5 | F6 | F7 | F8 | F9 |
| Drug(gm) | 0.3 | 0.3 | 0.3 | 0.3 | 0.3 | 0.3 | 0.3 | 0.3 | 0.3 |
| Castor oil
(ml) |
2.25 | 3.75 | 2.25 | 3.75 | 3 | 1.5 | 4.5 | 3 | 3 |
| Smix (ml) | 11.25 | 11.25 | 12.75 | 12.75 | 12 | 12 | 12 | 10.5 | 13.5 |
| Water (ml) | 16.5 | 15 | 15 | 13.5 | 15 | 16.5 | 13.5 | 16.5 | 13.5 |
Characterization of nano emulsion (F1-F9)
Particle size (PS), Poly dispersity index (PDI)
The average Particle size, PDI were measured by nanoparticle size analyser (Horiba). The prepared samples were properly diluted with distilled water to stay away from multi-scattering phenomenon. First the cuvette was cleaned not to affect the analysis results. The diluted samples were taken in cuvettes and measured19. The nano emulsion’s particle size should fall between 1-1000nm.
Zeta potential (ZP)
The zetapotential was measured by using zeta sizer. After being diluted with distilled water, nano emulsions were put into a cuvette that had been cleaned and washed. Then Zeta potential was measured from the electrophoretic mobility20. The Zeta potential values were expressed in mv. All analysis was done in triplicates.
In vitro % drug release
The drug release studies of the developed nano emulsions were determined by making diffusion cell assembly with the aid of cellophane membrane. 2ml of nano emulsion sample was taken in donor compartment and the diffusion is carried out at 37±0.5ºC using 200ml of phosphate buffer pH 7.4 as the dissolution medium and stirred at 600rpm21. To maintain sink conditions, 5 ml of each sample was taken out at intervals of 1, 2, 3, 4, 5, 6, 7, and 8 hours. Each sample was then replaced with an equivalent volume of new dissolving medium. The UV-Spectrophotometer (UV-1800, Shimadzu) was used to analyze the samples at 274 nm.
Development of nanoemulgel
After the nano emulsion was characterized, gel was formulated for the optimized formulations (F5 andF8). The composition of F5 and F8 formulations was presented in Table 4. In a beaker of double distilled water, Carbopol-934 was dissolved and then kept aside for sometime for swelling. Then, add polyethylene glycol. Triethanolamine was combined with this gel dispersion for the adjustment of pH and to attain transparent viscous gel. Under the continuous stirring, the nano emulsion formulation was uniformly included into this pre-formed gel based dispersion. Sodium benzoate was added as a preservative to the gel at the end22.
Table 4: Composition of methocarbamol loaded nanoemulgel (F5 NEG and F8 NEG)
| Ingredients | F5 NEG | F8 NEG |
| Nano emulsion formulation (ml) | 10 | 10 |
| Carbopol 934 (gm) | 0.1 | 0.1 |
| Ethanol (ml) | 0.1 | 0.1 |
| Sodium benzoate (gm) | 0.1 | 0.1 |
| Polyethylene glycol (ml) | 0.5 | 0.5 |
| Triethanolamine | q.s | q.s |
Characterization of nanoemulgel
Appearance
The appearance was observed to assess the change by visual inspection colour, presence of foreign particles and homogenicity of the optimized nanoemulgel23. The results were evaluated and summarized.
pH
Using a digital pH meter, the pH of the prepared nanoemulgel was assessed. First, the electrode was washed. Take 1ml of nanoemulgel and 9ml of buffer was mixed. Then the pH was determined and recorded24.
Viscosity
The prepared batches’ viscosity was measured using a Brookfield viscometer equipped with spindle 52. A spindle was lowered into the formulation at the centre, being cautious not to touch the bottom of the beaker, and it rotated at a speed of 20 rpm. The formulation, whose viscosity was to be ascertained, was then introduced into the beaker and allowed to settle at room temperature for 30 minutes before the measurement was taken25. The viscosity reading was recorded.
In-vitro permeation studies of nanoemulgel
The in-vitro permeation study was carried out using cellulose membrane, also known as dialysis membrane, and a Franz diffusion cell apparatus. Overnight, the membrane was immersed in phosphate buffer with a pH of 7.426. The membrane was taken off from the buffer. It was positioned between the donor and receptor compartments. The permeation medium was phosphate buffer (pH 7.4), and 2ml of phosphate buffer were added to the receptor compartment. 1ml of each of the nanoemulgel formulations F5 and F8 was kept in the donor compartment at 37ºC and 600 rpm. At intervals of 1, 2, 3, 4, 5, 6, 7, and 8 hours, one ml aliquots were taken from each cell. The drug in the aliquots was examined using UV spectroscopy at 274 nm while sink conditions were maintained throughout the experiment.
Drug release kinetics
The formulation’s dissolution profile was fitted to the Zero order, first order, Higuchi, and Korsmeyer Peppas models to determine the kinetic drug modelling in order to examine the mechanism of drug release from the formulation27.
Results and Discussion
Compatability studies
Fourier Transfer (FT-IR) Spectroscopy
The major functional group frequencies of methocarbamol were 3411.05 cm-1, 1618.17 cm-1, 3305.02 cm-1, and 1687.84 cm-1, which corresponded to the O-H, N-H, C-H, and C=C groups; the methocarbamol with castor oil showed peaks at 1675.54 cm-1, 1739.08 cm-1, and 292.26 cm-1, which corresponded to the C=C, C=O, and O-H groups; the methocarbamol with Tween 80 showed peaks at 1684.70 cm-1, 1023.62 cm-1, 3414.11 cm-1, and 1627.20 cm-1, which corresponded to the N-H, C-H, and C=C groups; and the methocarbamol with Polyethylene glycol 400 showed peaks at 3439.69 cm-1, 3326.52 cm-1, 679.86 cm-1, and 1085.56 cm-1, which corresponded to the O-H group, C-H group, C-H (bending), and C-H group, respectively. FT-IR spectrum of methocarbamol along with excipients showed no major shifts of the peaks used in the formulation and reported without any deviations with the mixture. The results were shown in figure 1.
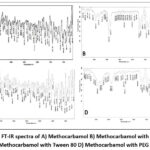 |
Figure 1: FT-IR spectra of A) Methocarbamol B) Methocarbamol with castor oil C) Methocarbamol with Tween 80 D) Methocarbamol with PEG 400 Click here to View Figure |
Differential Scanning Calorimetry (DSC) studies
The DSC studies show that there are no major changes in the peaks of drug and excipients that are used in the formulation as shown in figure 2. An information about physicochemical properties and stability were provided by the thermal behaviour of drug formulations. The DSC thermogram of pure methocarbamol revealed a sharp endothermic peak at about 92°C, which corresponds to its melting point and validates its crystalline structure. The drug can be easily identified in the formulations because of this characteristic peak which treats as an important marker. Analysis of excipients revealed that, Castor oil presented a broad endothermic transition, while Tween 80 showed small and multiple endotherms and PEG 400 showcased a distinct melting endotherm. Without significant overlap, all these excipient peaks were appeared at different temperature ranges suggests good physical compatibility between the components.
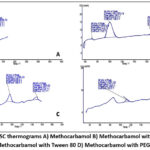 |
Figure 2: DSC thermograms A) Methocarbamol B) Methocarbamol with castor oil B) Methocarbamol with Tween 80 D) Methocarbamol with PEG 400 Click here to View Figure |
Characterization of nanoemulsion formulations (F1-F9)
Particle size (PS)
It was found that the nano emulsion formulations (F1–F9) had particle sizes between 300nm to 985 nm. After analysing the particle size data, it was discovered that the interaction between X1 and X2 was the highest (59.29%) and had a positive sign for the coefficient (7.375). It showed that the particle size decreased as the amount of X1 and X2 increased. The CCD has been used and the results are seen because Sigma Tech software indicates that the relationship between Y1 vs. X1X2 is non-linear. By entering values in Sigma Tech, the following statistical quadratic model has been obtained.
Final equation in terms of coded factors
Y1=378.5-20.925X1-28.275X2-87.375X1X2+107.575X12+35.6X22
Final equation in terms of actual factors
PS=378.5-20.925CO-28.275Smix-87. 375COSmix+107.575CO2+35.6Smix2
Where,
Y1=Particle size
X1=Castor oil
X2=Smix
After taking into account the magnitude of the coefficient and the mathematical sign it carries (i.e., -ve or +ve), conclusions were drawn using the polynomial equation. Multiple linear regression analysis showed that the ideal concentrations of Smix and Castor oil caused a decrease in particle size. In the formulation castor oil shows impact on the particle size of nano emulsions. In other formulations it can be observed that the decrease in Castor oil concentrations and increase in the Smix lead to decrease in particle size28. As castor oil content decreases there is reduce in the entire volume of oil phase, by this interfacial area lowers and requires stabilization which enhances emulsification efficiency and decreases the droplet or particle size29. Increasing Smix concentration: As Smix concentration increases, solubility of oil droplet gets improved and enhances the emulsification effectiveness. As a result, small and more stable droplets are formed because of stronger interfacial layer that prevents coalescence.”Decrease in castor oil, increase in Smix concentrations tends to reduce in particle size that is allocated to decrease in interfacial tension and stability of droplet gets improved that allows dispersion of smaller oil droplets more effectively within the continuous phase”. By using ionic components, Smix increases to an ideal value decreases droplet size and commonly negative zetapotential increases.
Polydispersity index (PDI)
It was found that the PDI of the nano emulsion formulations (F1–F9) ranged from 0.358 to 1.677. Because its addition to the formulation reduced viscosity and surface tension, which aided in the formation of nanosized, uniformly distributed nanoparticles, the ideal concentration of castor oil and Smix is thought to be the primary cause of the particle size reduction and decreased PDI. It can be observed that the slight increase or decrease in the concentrations of castor oil and Smix lead to the changes in PDI. The PDI values decreases as surfactant and co-surfactant (Smix) ratio increases because of higher surfactant levels, that improves interfacial stabilization and reduces the coalescence30. Oil content influence the PDI by increasing the oil concentration, so that PDI values increases. The PDI values from 0.01 0.7 indicates that monodispersed particles and greater than 0.7 indicates the presence of poly dispersed particles. The PDI value indicates the uniform dispersion of the drug particles in the vesicle and high stability.
Zeta potential (ZP)
The range of -27.6mv to +19.5mv was determined to be the ZP of nano emulsion formulations (F1-F9). After analysing the zeta potential data, it was discovered that the interaction between X1 and X2 was the highest (99.5852%) with a positive sign of the coefficient (1.225). It indicated that at the increase in levels of X1 and increase in levels of X2, increased the zetapotential. The CCD has been used and the results are seen because Sigma Tech software indicates that the relationship between Y2 vs. X1X2 is nonlinear. By entering values in Sigma Tech, the following statistical quadratic model has been obtained.
Final equations in terms of coded factors
Y2=509.1656+43.625X1+66.8416X2-67.375X1X2-99.7979X12-102.510
Final equations in terms of actual factors
Y2=509.1656+43.625CO+66.8416Smix-67.375CO.Smix-99.7979CO2-102.510Smix2
Where,
Y2=Zetapotential
X1=Castor oil
X2=Smix
Multiple linear regression analysis’s findings showed that Zeta potential increased with the optimal levels of Castor oil concentrations and Smix. In the other formulations it can be observed that the increase in Castor oil and increase in Smix lead to increase in zeta potential. It has also been demonstrated that Smix plays a key role in stabilization of formation of vesicles leading to increase in zeta potential. Castor oil contains ricinoleic acid, which has carboxylic (-COOH) and hydroxyl (-OH) groups. As castor oil concentration increases, above functional groups at the oil-water interface increases which enhances the droplet surface charge specifically in aqueous pH conditions. As a result, the negative zeta potential increases31. Effect of Smix Increase: In the Smix system, non-ionic surfactants improve the emulsification and reduce the droplet size which indirectly increases the absolute zetapotential by enhancing steric and electrostatic stability. More oil induces more droplets and increase the surface area. Higher concentrations of Smix and castor oil result in higher zeta potential because of the ionizable groups in castor oil that contribute to surface charge and the Smix’s improved dispersion and interfacial stabilization, which together raise the droplets’ net surface potential.
Table 5: Characterization of nanoemulsion formulations (F1-F9)
| Formulation code |
Particle size (nm) |
Zeta potential (mv) |
Polydispersity Index |
| F1 | 523.4nm | 0.3mv | 0.358 |
| F2 | 972.4nm | -2.0mv | 1.677 |
| F3 | 305.7nm | -2.2mv | 0.411 |
| F4 | 405.2nm | 0.4mv | 0.460 |
| F5 | 314.5nm | 19.5mv | 0.445 |
| F6 | 984.4nm | -6.2mv | 0.642 |
| F7 | 584.9nm | -18.7mv | 0.425 |
| F8 | 393.5nm | -19mv | 0.458 |
| F9 | 616.3nm | -27.6mv | 0.584 |
Particle Size of Nano emulsion formulations (F5 and F8)
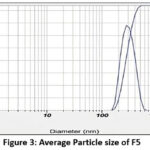 |
Figure 3: Average Particle size of F5 Click here to View Figure |
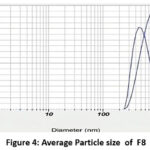 |
Figue 4: Average Particle size of F8 Click here to View Figure |
Zeta potential of Nano emulsion formulations (F5 and F8)
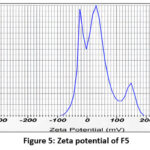 |
Figure 5: Zeta potential of F5 |
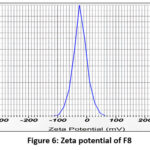 |
Figure 6: Zeta potential of F8 Click here to View Figure |
Drug release studies
The nano emulsion formulations of F1-F9 have the drug release in the range of 81.07% to 79.68% at the end of 8hrs. Among these formulations, the F5 and F8 are selected as best formulations. The drug release of F5 and F8 are 90% and 85.06% at the end of 8hrs. The drug release profile of nano emulsion formulations are shown in figure 7.
In Vitro drug release of Methocarbamol Nano emulsion formulations
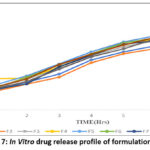 |
Figure 7: In Vitro drug release profile of formulations (F1-F9) Click here to View Figure |
Characterization of nanoemulgel formulations (F5 NEG and F8 NEG)
Appearance
The formulations F5 NEG and F8 NEG were transparent, free from foreign particles and homogenous in nature. Sensory Qualities- For user approval clarity, colour homogenicity and the absence of grittiness are essential. With respect to particle size, small and evenly dispersed particles prone to appear transparent or clear, absence of foreign particles and homogenicity of the nanoemulgel32. Meanwhile, inadequate emulsification can lead to turbidity or phase separation. All optimized methocarbamol nanoemulgels show no signs of instability such as oil separation or colour change and confirming their physical stability and long-term applicability.
pH
The pH of the formulated gels i.e., F5 NEG and F8 NEG were determined as 6.69 and 6.652. Triethanolamine balanced the skin’s pH. As there was no sign of any phase separation the formulations can be utilized for application on human skin. Upholding an appropriate pH is essential for the stability and efficacy of topical formulations. Studies point that the pH values should remain within the skin’s normal range of 4.5 to 6.5 to avoid compromising the skin barrier and ensuring effective drug penetration33. But the pH values of evaluated methocarbamol formulations remains constant throughout the storage and indicates no hydrolysis or degradation of drug or excipients. Buffering agents and carefully selected excipients like Carbopol 934 help to sustain the pH within relevant ranges, meanwhile surfactant selections and emulsification protocols are adjusted to prevent pH shifts. For securing dermatological safety and analysing the formulation’s stability over time, pH is essential for overseeing.
Viscosity
The formulations F5 NEG and F8 NEG showed good viscosity. The concentration and the nature of gelling agent leads to the changes in viscosity. Viscosity fulfils the role in the performance of topical formulations. An optimal(moderate) topical formulation should have a viscosity to balance the spreadability and gel form retention. An increase in gelling polymer concentration leads to higher viscosity, which in turn affects drug release and diffusion rate. Drug penetration can be delayed due to limited molecular mobility because of enormous viscosity34. In methocarbamol nanoemulgels, an oil concentration, gel base and surfactant mixture (Smix) ratios should be considered carefully in order to adjust the viscosity. During accelerated storage conditions, uniform viscosity can be sustained by the formulations because to illustrate the physical stability and tolerance to phase separation.
Table 6: Characterization of nanoemulgel formulations (F5 NEG and F8 NEG)
| Sr. No. | Parameter | F5 NEG | F8 NEG |
| 1 | Colour | Transparent | Transparent |
| 2 | Foreign particles | (-) | (-) |
| 3 | Homogenicity | ** | ** |
| 4 | pH | 6.69 | 6.52 |
| 5 | Viscosity (cps) | 2468 | 2780 |
In vitro permeation studies of nanoemulgel
Methocarbamol nano emulsion formulation F5 which exhibited the better Particle size, PDI, zeta potential and the nano emulsion formulation F8 which has second better Particle size with 393.5nm is converted in to nanoemulgel for further studies. Figure 8 shows the curve plotted between the cumulative amount of drug permeated per unit area across the cellulose membrane and time and profile of nanoemulgel (F5 and F8 NEG). The formulations, F5 and F8, show the permeation through the process of diffusion at the end of 8 hours with percentages of 69.68% and 66.92%. It has shown that the formulations exhibited better amount of drug release exhibits zero, first, Higuchi, and Korsmeyer-Peppas plots and it’s plots for the formulations (F5 and F8 NEG) are shown in figure 9. The R2 value of Zero order is lesser than first order, and Korsmeyer-Peppas model is lesser than Higuchi model with R2 of (0.950). This suggests that it followed the first order and followed by Higuchi model. It is clear that the Carbopol 934 which acts as gelling agent played a key role in the effective diffusion through the membrane without altering the nano emulsion formulation with increased drug release. Cumulative drug release and penetration rates are improved in the nanoemulgel formulations compared to the conventional gels or emulsions. Surfactants and co-surfactants in the Smix system perform as the penetration enhancers, that interrupt the stratum corneum lipid structure and meanwhile increase the surface area of absorption. Because of lower oil concentration and higher Smix ratios, drug diffusion can be enhanced by reducing the viscosity so that the thermodynamic activity can be increased. Drug flow can be delayed due to the excess thick gel so that penetration rate can be decreased35.
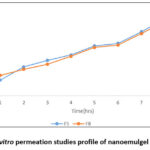 |
Figure 8: In vitro permeation studies profile of nanoemulgel (F5&F8 NEG). Click here to View Figure |
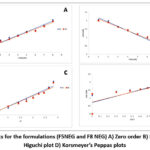 |
Figure 9: Plots for the formulations (F5NEG and F8 NEG) A) Zero order B) First order C) Higuchi plot D) Korsmeyer’s Peppas plots. Click here to View Figure |
Response Y1 (Particle size)
Table 7: Effect of variables on responses Y1 (PS)
| Sr. No. | Combination | Co efficient |
| 1 | b0 | 378.5 |
| 2 | b1 | -20.925 |
| 3 | b2 | -28.275 |
| 4 | b12 | -87.375 |
| 5 | b11 | 105.575 |
| 6 | b22 | 35.6 |
Final equations in terms of coded factors
Y1=378.5-20.925X1-28.275X2-87.375X1X2+107.575X12 +35.6X22
Response Y2 (Zeta Potential)
Table 8: Effect of variables on responses Y2 (ZP)
| Sr. No. | Combination | Co efficient |
| 1 | b0 | 509.1556 |
| 2 | b1 | 43.625 |
| 3 | b2 | 66.8417 |
| 4 | b12 | -67.375 |
| 5 | b11 | -99.7979 |
| 6 | b22 | -102.5104 |
Final equations in terms of coded factors
Y2=509.1656+43.625X1+66.8416X2-67.375X1X2-99.7979X12-102.5104X22
Contour plots
Contour plots were utilized to determine a suitable design space for particle size and zetapotential within the inferred values, as shown in Figure 10. The study created a design space that resulted in a workable operational series for articulating methocarbamol loaded nanoemulgel using a multimodal combination of particle size and Zetapotential. Predicted values were used to evaluate the produced formulation’s compositions, and contour plots made it possible to identify and optimize a variety of formulation designs. All other ingredients were kept the same, but castor oil and Smix were modified to 10%w/v and 40%w/v, in turn, for the best formulation. The standard error for each result was calculated using the predicted and exploratory values. Table 10 shows the results, which are 0.08 and 0.09, in that order. The model’s validity and predictability were demonstrated by the investigated data, which confirmed the predicted values.
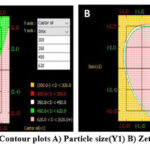 |
Figure 10: Contour plots A) Particle size(Y1) B) Zetapotential(Y2). Click here to View Figure |
Table 9: Absolute values of Counter diagram
| Sr. No. | X axis= Castor oil | Y axis= Smix | Particle size | Zetapotential |
| 1 | 10 | 40 | 314.5 | 19.5 |
| 2 | 15 | 40 | 584.9 | -18.7 |
| 3 | 10 | 45 | 616.3 | -27.6 |
| 4 | 10 | 35 | 393.5 | -19 |
Table 10: Comparison of experimental results with predicted response of nano emulsion
| Ingredients | Composition | Response | Predicted value |
Experimental value |
Standard Error |
| Castor oil | 10 | Y1 (particle size) | 314.5 | 313.6 | 0.09 |
| Smix | 40 | Y2 (zeta
Potential) |
19.5 | 19.2 | 0.08 |
Conclusion
The methocarbamol nanoemulgel was prepared successfully by using Ultrasonication method. The concentration of Castor oil and Smix was observed to have effect on the particle size and zetapotential as shown by the model obtained using central composite design. Concluding With fewer trials and higher-quality properties, the central composite design could be effectively used to develop methocarbamol nanoemulgel. nanoemulgel exhibited better permeation with the diffusion of drug to its targeted site without any negative effects.
Acknowledgement
The authors express their gratitude to the RIPER for its assistance.
Funding Sources
The author(s) received no financial support for the research, authorship, and/or publication of this article.
Conflict of Interest
The author(s) do not have any conflict of interest.
Data Availability Statement
This statement does not apply to this article.
Ethics Statement
This research did not involve human participants, animal subjects, or any material that requires ethical approval.
References
- Shaker, D. S.; Ishak, R. A.; Ghoneim, A.; Elhuoni, M. A. Sci Pharm. 2019, 87(3), 17-25.
CrossRef - De Oca-Ávalos, J. ; Candal, R. J.; Herrera, M. L. Curr Opin Food Sci. 2017, 16, 1-6.
CrossRef - Singh, G.; Singh, D.; Choudhari, M.; Kaur, S. D.; Dubey, S. K.; Arora, S.; Bedi, N. Pharm. Investig. 2021, 51, 701–714.
CrossRef - Lal, D. K.; Kumar, B.; Saeedan, A. S.; Ansari, M. N. Pharmaceutics. 2023, 15(4), 1187.
CrossRef - Anand, K.; Ray, S.; Rahman, M.; Shaharyar, A.; Bhowmik, R.; Bera, R.; Karmakar, S. Recent Pat Antiinfect Drug Discov. 2019, 14(1), 16-35.
CrossRef - Padhy, S.; Sahoo, B. M.; Kumar, B. V.; Patra, C. N. Nanomater. 2021, 6(1), 43-57.
CrossRef - Bernardo, J.; Valentao, P. Phytotherapy Research. 2024, 38(4), 1903-31.
CrossRef - Kumar, K. A.; Pramod, K.; Kumar, N. R.; Reddy, M. R. Journal for Innovative Development in Pharmaceutical and Technical Science (JIDPTS). 2024, 7(9).
- Sugumaran, A.; Mathialagan, V. J. Pharm. Edu. Res. 2022, 56(1), 144-52.
CrossRef - Sangshetti, J. N.; Deshpande, M.; Zaheer, Z.; Shinde, D. B.; Arote, R. Arab J Chem. 2017, 10, S3412-25.
CrossRef - Mazumder, S.; Pavurala, N.; Manda, P.; Xu, X.; Cruz, C. N.; Krishnaiah, Y. S. Int J Pharm. 2017, 527(1-2), 151-60.
CrossRef - Che Marzuki, N. H.; Wahab, R. A.; Abdul Hamid, M. Biotechnol Biotechnol Equip. 2019, 33(1), 779-97.
CrossRef - Souto, E. B.; Cano, A.; Martins-Gomes, C.; Coutinho, T. E.; Zielińska, A.; Silva, A. M. Bioengineering. 2022, 9(4), 158.
CrossRef - Garcia, C. R.; Malik, M. H.; Biswas, S.; Tam, V. H.; Rumbaugh, K. P.; Li, W.; Liu, X. Sci. 2022, 10(3), 633-53.
CrossRef - Thanushree, H. R.; Kumar, G. B. K.; Acharya, A. J. Pharm. Sci. Nanotechnol. 2017, 10, 3858–3865.
CrossRef - Alburyhi, M. M.; Hamidaddin, M. A.; Noman, M. A.; Saif, A. A.; Yahya, T. A.; Al-Ghorafi, M. A. European Journal of Pharmaceutical and Medical Research. 2024, 11(9), 370-404.
- Rojek, B.; Wesolowski, M. J. Anal. Calorim. 2023, 148(3), 845-58.
CrossRef - Ahire, K.; Gorle, A. P.; Maharashtra, I. World Journal of Pharmacy and Pharmaceutical Sciences. 2021, 10(8), 897-908.
- Chinthaginjala, H.; Bogavalli, V.; Hindustan, AA.; Pathakamuri, J.; Pullaganti, SS.; Gowni, A.; Baktha, B. J. Pharm. Edu. Res. 2024, 58(1),21-33.
CrossRef
- Dalmolin, L. F.; Lopez, R. F. Pharmaceutics. 2018, 10(4), 214.
CrossRef - Manure Hirakant, S.; Nagoba Shivappa, N. Biomech. Sci. Engineer. 2023, 84-99.
- Hussain, A.; Samad, A.; Singh, S. K.; et, al. Int J Nanomedicine. 2016, 11, 5621–5632.
- Giri, S.; Chakraborty, A.; Mandal, C.; Rajwar, T. K.; Halder J.; Irfan, Z.; Gouda, M. M. Gels. 2024, 10(9), 578.
CrossRef - Vani, YB.; Haranath C.; Reddy CS.; Bhargav E. J. Pharm. Sci. Drug Res. 2018,10(4), 227-32.
CrossRef - Alissa, M.; Hjazi, A.; Abusalim, G. S.; Aloraini, G. S.; Alghamdi, S. A.; Alharthi, N. S.; Rizg, W. Y.; Hosny, K. M.; Binmadi, N. Pharmacol. 2024, 15, 1347551.
CrossRef - Alam, P.; Shakeel, F.; Foudah, A. I.; Alshehri, S.; Salfi, R.; Alqarni, M. H.; Aljarba, T.M. Gels. 2022, 8(8), 511.
CrossRef - Bhattacharya, S. A.; Prajapati, B. G. Asian J. Pharm. Clin. Res. 2017, 10(8), 353-65.
CrossRef - Shekade, S. V.; Deshkar, S. S.; Shirolkar S. V. J. Pharm. Edu. Res. 2023, 57(1s), 75-84.
CrossRef - Algahtani, M. S.; Ahmad, M. Z.; Ahmad, J. Bioengineering. 2022, 9(8), 384.
CrossRef - Kotta, S.; Khan, A. W.; Ansari S. H.; Sharma, R. K.; Ali, J. Drug delivery. 2015, 22(4), 455-66.
CrossRef - Vahidmoghadam, F.; Pourahmad, R.; Mortazavi, A.; Davoodi, D.; Azizinezhad R. Food Sci. Technol. 2019, 39, 475-81.
CrossRef - Javed, H.; Shah, S.; Iqbal, F. M. AAPS pharmscitech. 2018, 19, 1730-43.
CrossRef - Sheshala, R.; Anuar, N. K.; Abu, Samah, N. H.; Wong, T. W. AAPS PharmSciTech. 2019, 20, 1-28.
CrossRef - Donthi, M. R.; Munnangi, S. R.; Krishna, K. V.; Saha, R. N.; Singhvi, G.; Dubey, S. K. Pharmaceutics. 2023, 15(1) 164.
CrossRef - Adem, A.; Belete, A.; Raorane, M. L.; Junker, B.; Neubert, R. H.; Gebre-Mariam, T. Drug Delivery Sci. Technol. 2024, 100, 105991.
CrossRef
Accepted on: 10 Sep 2025


![]()


