Highly Efficient and Selective Adsorption of Congo Red and Antibacterial Studies by Para Toulene Sulfonic Acid Functionalized Porous Polypyrrole@Mno2 Nanorods

Center of Nanotechnology, King Abdulaziz University, Jeddah, Saudi Arabia
Corresponding Author E-mail:phasan@kau.edu.sa
Download this article as:
ABSTRACT:Herein in situ polymerization was employed to prepare paratoulene sulfonic acid doped polypyrrole (pTSa-Ppy) and polypyrrole@MnO2 (pTSa-Ppy@MnO2). Morphological studies showed MnO2 nanorods embedded inside as well as over Ppy. The X-ray diffraction showed MnO2 and Ppy while the X-ray photon spectroscopy confirmed pTSa doping and showed peaks of Ppy and MnO2. Thus, formed pTSa-Ppy and pTSa-Ppy@MnO2 was studied for the removal of congo red (CR) and methylene blue (MB) by adsorption. It was found that MnO2, pTSa-Ppy and pTSa-Ppy@MnO2 showed affinity towards CR molecules. The fitting of the Elovich model supported by the highest coefficient of determination i.e. R² (0.928) and lowest root mean squared error i.e. RMSE (3.445) indicated that physisorption and chemisorption were involved in bonding between CR and pTSa-Ppy@MnO2. The antibacterial studies against E. Coli and B. cereus showed that control was found to be least effective, with most bacterial growth, followed by pTSa-Ppy and pTSa-PPy@MnO2.
KEYWORDS:Adsorption; Morphological Analysis; MnO2 nanorods; Polypyrrole
Introduction
Industrialization and modernization have resulted in the spills of toxic waste such as dyes, oils, radioactive materials, etc. into the ecosystem.1,2 It is estimated that over 100 thousand synthetic dyes are in commercial use with over 800 thousand tons of dye production annually worldwide.3 Textile dyeing is one of the major industrial polluters accountings for over 20% of wastewater generation globally. These highly toxic and non-biodegradable dyes threaten ecosystems by many ways such as: it restricts light penetration into water which affects photosynthesis process, has cytotoxic, neurogenic, teratogenic and carcinogenic effects which leads to skin sensitization, respiratory issues, kidney disorder, liver failure, neurological disturbances, etc.4 Amongst different dyes, congo red (CR) find a lot of usage in leather, cosmetics, foods, etc. and are discharged into the ecosystem through sewage water. CR due to the above-mentioned adverse properties needs to be efficiently removed for better water quality and economic benefits.
Fortunately, for dye removal, a range of techniques are used such as electro-precipitation, ion exchange, photo-catalysis, reverse osmosis and adsorption. Adsorption is one of the most effective means of dealing with the aforementioned problems associated with the adsorption of dyes because of its feasibility and low cost in preparing the adsorbent for selective adsorption.5 Conducting polymer-based composites has recently attracted attention as preferred potential adsorbents due to its ease of synthesis and low cost. Mohammad et al.6 reported methyl orange adsorption by Polypyrrole-polyethyleneimine. Similarly, Senguttuvan et al.7 reported that polyaniline-based composite can remove metals and dyes from aqueous systems. Among different conducting polymer polypyrrole (Ppy) has attracted considerable attraction due to its better chemical stability and high yield of synthesis. Apart from polymers, metal oxides have been widely employed as dye adsorbent. Hozefa Dhila et al.8 showed that metal oxide nanoparticles owing to their functionality and large surface area can enhance the adsorption properties when used as fillers. The report of Patra et al.9 showed that MnO2 is 98% effective in removing Reactive Blue 21 dye thus making it a highly effective adsorbent. Owing to the exceptional adsorption properties of Ppy and MnO2 as discussed above, it is believed that the composite of Ppy and MnO2 can be exploited for adsorptive removal of CR.
Thus, in this work MnO2 nanorods was prepared via hydrothermal methodology followed by its composite with Ppy and MnO2 nanorods and further doping with para toluene sulfonic acid (pTSA). Thus, prepared pTSa-Ppy@MnO2 was characterized for structural and morphological characterizations and further exploited for the removal of CG and methylene blue (MB).
Experimental
Materials required
Pyrrole 98% Sigma Aldrich, Ferric chloride Fe(Cl3 98%, p-Toluene sulphonic acid 99% otto chemicals, hydrochloric acid (35%) and potassium permanganate. For bacterial culture, Nutrient broth media (HiMedia, Mumbai, India), for media and glassware sterilization autoclave (JSAC 80, Daejeon, South Korea), for culture optimum growth incubator (JSGI-150T, Daejeon, South Korea) and calorimeter (Jenway, Stone, Staffordshire, England) and biosafety hood (ESCO, classII BSC, Singapore) was used.
Method
The surface morphology was investigated by field emission scanning electron microscope (FESEM) (model: JEOL, JSM-7600F, FESEM, Tokyo, Japan). X-ray diffraction was done by using monochromatized Al Kα X-ray source (λ 1/4 1486.6 eV) and X-ray photoelectron spectroscopy (XPS) by an ESCALAB 250 from Thermal Fisher Scientific, Warrington, UK.
Dyes removal studies
The selectivity of the fabricated materials was tested on the anionic CR and cationic MB dyes. For this small amount (0.025 g) of material and 25 mL of dye solution were mixed by shaking at 200 rpm. The variation of absorption was studied by varying the solution concentration from 25-200 mg/L, starting from 5 min to 240 min, and pH in the range between 3.0 and 9.0. The UV-visible spectrophotometer was used to analyze the concentrations of the CR and MB at 496 and 665 nm.
Bacterial Strain and Culture Preparation and Treatments
Escherichia coli and Baccillus cereus were cultured in nutrient broth under standard aerobic conditions at 37 °C with shaking at 170 rpm). A culture grown for ~12 hours were diluted until an initial OD₆₀₀ of approximately 0.05 before initiating the growth-curve experiment.
Three experimental groups were prepared for both E. coli and B. cereus. The control cultures did not contain any additional material, which were untreated controls. The second group consisted of cultures treated with pTSa-Ppy of fixed concentration of 100 µg/mL. Third group cultures were exposed to a mixture of pTSa-Ppy@MnO2 at 100 µg/mL for equal loading across treatments. At the start of incubation, all treatments were introduced without extra supplementation throughout the incubation.
Further, Bacterial growth was monitored by measuring optical density (O.D.) at 600 nm at variable time intervals over approximately 1000 minutes. Measurements were obtained using a microplate reader, and all experimental groups were analyzed in triplicate. The plotted growth curves represent the mean OD₆₀₀ values for each condition.
Synthesis of pTSa-Ppy and pTSa-Ppy@MnO2 composites
For MnO2 nanorods 1.316 g of KMnO4 and 3 mL of HCl was stirred on magnetic stirrer for 30 minutes. The whole reaction mixture was transferred to Teflon hydrothermal reactor and subsequently heated at 150 0C for 10 hours. Thus, obtained MnO2 nanorods was collected and washed by centrifugation, followed by drying at 90 0C for 10 hours. Ppy was synthesized by insitu oxidative polymerization of pyrrole using FeCl3 as oxidant. In a typical process, 0.5 mL of pyrrole was dispersed in 100 mL followed by the addition of oxidant solution FeCl3 (4.67 gm in 100 mL) was added to the dispersion of pyrrole. The whole dispersion slowly turned into black color thereby indicating the formation of Ppy. For the Ppy@MnO2, 0.05 gm of MnO2 was added to the pyrrole dispersion 15 minutes after the onset of polymerization and rest separation and washing was done similarly as in the case of MnO2. Thus, prepared Ppy and Ppy@MnO2 was doped with pTSA by dipping in 100 mL of 0.1 M pTSA solution. Finally, pTSa-Ppy and pTSa-Ppy@MnO2 was removed by centrifugation and subsequently dried at 80 0C for 12 hours.
Result and Discussion
XRD analysis
The XRD of pTSa-Ppy (Fig. 1) shows amorphous broadband at 2θ=25 associated with scattering in PPy chains at interplanar spacings.10,11 In the case of pTSa-Ppy@MnO2, apart from the broad 2θ=25 peak of Ppy, additional peaks at 12.6, 18.1, 28.6, 37.4, 41.9, 59.9, 60.5 and 64.9 2θ corresponds to (110), (200), (310), (211), (301), (411), (521) and (002) crystal planes of MnO2 respectively.
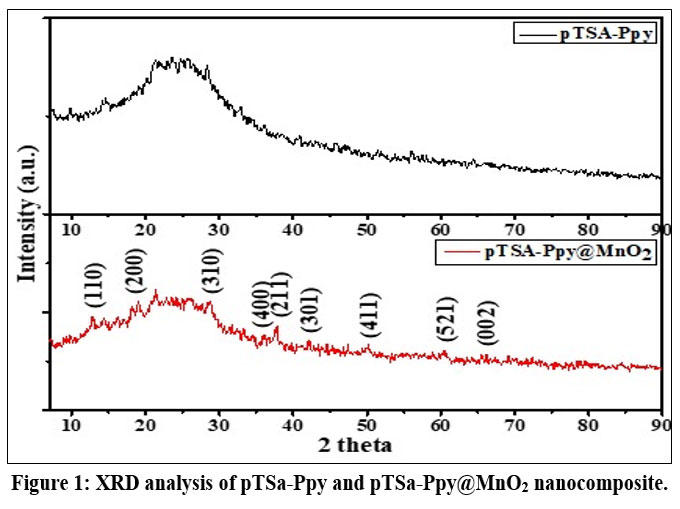 |
Figure 1: XRD analysis of pTSa-Ppy and pTSa-Ppy@MnO2 nanocomposite. Click here to View Figure |
XPS analysis
To further elucidate the surface elemental composition of pTSa-Ppy@MnO2 nanocomposite, XPS analysis was conducted. The survey spectra (Fig. 2) showed the presence of Mn2p and O1s peaks corresponding to the presence of MnO2 while the C1s and N1s corresponds to the Ppy polymer while S2p corresponds to its successful doping with pTSa.
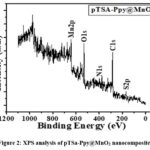 |
Figure 2: XPS analysis of pTSa-Ppy@MnO2 nanocomposite. Click here to View Figure |
Morphology analysis
The morphological analysis of pTSa-Ppy (Fig. 3) shows irregular globular structures of various diameters ~100-400 nm and the globules are interconnected with each other to form long and short chains.14 In the case of pTSa-Ppy@MnO2, along with Ppy globules, MnO2 nanorods can be easily seen embedded as well as on the surface of the polymeric structure.15
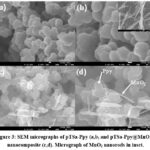 |
Figure 3: SEM micrographs of pTSa-Ppy (a,b) and pTSa-Ppy@MnO2 nanocomposite (c,d). Micrograph of MnO2 nanorods in inset. Click here to View Figure |
Dyes removal studies
MnO2, pTSa-Ppy, and pTSa-Ppy@MnO2 was tested for the decontamination of the CR and MB was tested to determine their selectivity for either anionic or cationic pollutants. From Fig. 4 it can be been that MnO2, pTSa-Ppy and pTSa-Ppy@MnO2 have an affinity for the cationic CR molecules. The positively charged amine group on the PPy enhances adsorption of anionic CR molecules compared to cationic MB.16 The positive change in the PPy and MB repel each other, and electrostatic repulsion was responsible for the lower MB adsorption. Following trend was observed for MB and CR removal: MnO2 < pTSa-Ppy < pTSa-Ppy@MnO2. This trend indicated that as the functionality of the material increases, the CR scavenging properties of the materials increase. Based on the primary results, CR and pTSa-Ppy@MnO2 were selected to explore the experimental conditions for optimum adsorption.
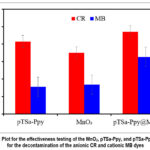 |
Figure 4: Plot for the effectiveness testing of the MnO2, pTSa-Ppy, and pTSa-Ppy@MnO2 for the decontamination of the anionic CR and cationic MB dyes Click here to View Figure |
Adsorption equilibrium shows the availability of the active sites in the adsorbent. The scavenging of the CR onto pTSa-Ppy@MnO2 as a function of equilibrium time shows that all the active sites on pTSa-Ppy@MnO2 were fully saturated by CR molecules within 150 min (Fig. 5). The CR interacted with pTSa-Ppy@MnO2 surface vacant sites quickly within five minutes and process got slower due to the availability of fewer empty sites.
The saturation of the pTSa-Ppy@MnO2 and the rate of the CR scavenging could be analysed by kinetic models by data fitting. Herein, the CR scavenging data was fitted to pseudo-first order, Pseudo-second order and Elovich models (Table 1). A non-linear plot for fitting the applied kinetic models is shown in Fig. 5a and the data obtained from their respective equations are included in Table 1. The pseudo-first order shows least fit due to lower R² and higher RMSE which means the control of the CR scavenging rate is not subjective to CR distribution over pTSa-Ppy@MnO2 surface.17 In contrast the R² and RMSE values showed better fit than pseudo-first order but less supportive compared to the Elovich model. Analyzing the results, it was interpreted that mainly chemisorption forces were involved in the CR scavenging onto pTSa-Ppy@MnO2. The best fitting of the Elovich model is supported by the highest R² (0.928) and lowest RMSE (3.445) values demonstrating that physisorption and chemisorption were involved in the bonding between the CR and pTSa-Ppy@MnO2.18
Table 1: Kinetics equation and their parameter’s values for Cr(III) adsorption onto pTSa-Ppy@MnO2
| Kinetic model | Parameters | values | |
| Pseudo-first order:
qt = qe(1- e(-k1t)) |
qe (exp.) | 95.64 mg/g | |
| qt (cal.) | 86.195 mg/g | ||
| k1 | 0.194 min−1 | ||
| R2 | 0.374 | ||
| RMSE | 10.213 | ||
| Pseudo-second order:
qt = qe2k2t/[k2(qe)t + 1]
|
qe (cal.) | 91.614 mg/g | |
| k2 | 2.712×10⁻³ mg min−1 | ||
| R2 | 0.684 | ||
| RMSE | 7.260 | ||
| Elovich:
qt = 1/β ln (βt)
|
α | 459.044 mg/g min−1 | |
| β | 97.927 x10⁻³ g/mg | ||
| R2 | 0.928 | ||
| RMSE | 3.445 | ||
| where: qe(exp.): experimental adsorption capacity; qt(cal.):calculated adsorption capacity k1: pseudo-first order rate constant; R²:coefficient of determination; RMSE:root-mean-square deviation | |||
The variation in the CR solution pH controls the adsorption process due to the change in the CR molecular structure and pTSa-Ppy@MnO2 surface change. The plot of the CR scavenging onto pTSa-Ppy@MnO2 at varying solution pH shows that with pH increase from 3 to 9, the CR scavenging reduces. The optimum CR adsorption was recorded at pH 3 (98.1 mg/g) while the lowest result was recorded at pH 9 (78.86 mg/g). The existence of the H⁺ and ⁻OH in the solution drove the binding of CR onto pTSa-Ppy@MnO2. The presence of the excessive H⁺ in the solution produces the net positive charge on pTSa-Ppy@MnO2, which facilitates electrostatic bonding forces with anionic CR molecules. The presence of ⁻OH in the solution with CR molecules reduces adsorption as in basic pH conditions due to the repulsive forces between anionic CR as well as deprotonated pTSa-Ppy@MnO2 surface.19 The results in Fig. 5b indicated that adsorption between pH 3 and 7 varied from 98.1 mg/g to 91.69 mg/g, suggesting that pTSa-Ppy@MnO2 is an effective material which can efficiently eliminate the CR dye at a wide pH range.20
The removal of the CR at various pH can be further explained on functionality on pTSa-Ppy@MnO2. The main constituents of pTSa-Ppy@MnO2 are carbon, nitrogen, oxygen, manganese, and sulfur. The aromatic rings are the main contributor to the binding of CR molecules through the π−π interaction. MnO2 can easily adsorb solution H⁺ in the acidic solution and have net positive change (Mn-O + 2H⁺→ Mn-OH₂⁺), which easily bind with the CR molecules (Mn-OH₂⁺ + CR → Mn-OH₂⁺ CR) [21]. PPy has the active -NH group which shows the deposition of the H⁺ in the acidic solution and deprotonation in the basic medium. In acidic medium, protonated amine group binds with the CR molecule through electrostatic interaction while formed H-bond under the basic conditions [22]. Therefore, pTSa-Ppy@MnO2 showed the effective removal of the CR under the acidic and basic medium.
The saturation of the pTSa-Ppy@MnO2 active site under the influence of the increasing CR molecules concentrations has been investigated and results are depicted in the Fig. 5c. On increasing the CR concentration from 25 to 200 mg/L, the scavenging capacity of the pTSa-Ppy@MnO2 for CR increases from 24.8 to 133.45 mg/g. This CR adsorption behavior is that rise in CR concentration in the solution augmented the driving force resulting from the concentration gradient, thereby improving CR scavenging. Moreover, a higher initial CR concentration eases a larger rate of collisions between the CR molecules and pTSa-Ppy@MnO2, which resulted in enhanced adsorption capacity.23 Although, % removal of CR decreased from 99.2 to 66.725%. At lower concentration of 25 mg/L, 99.2% CR removal was recorded owing to excess of active sites available for lower number of CR molecules. These results suggested that as the dye molecules concentration increase, the % removal decreases because active sites on pTSa-Ppy@MnO2 remain constant and become saturated with the rise in CR molecules in the solution.24
The equilibrium data at the varying concentrations is crucial for understanding the interactions between CR molecules and pTSa-Ppy@MnO2 in equilibrium isotherms. Fig. 5d illustrated the equilibrium adsorption isotherms (Langmuir, Freundlich and Temkin) of CR scavenging onto pTSa-Ppy@MnO2. The calculated parameters of applied isotherm for dye molecules are presented in Table 2. As the calculated constants of isotherms indicated that Temkin model showed give the highest regression coefficients value and lowest RMSE.25. These results supports that molecules of CR gets attached though physical as well as chemical forces onto the pTSa-Ppy@MnO2. Moreover, the heterogeneity factor ‘n’ value (Freundlich constant) for CR scavenging is 4.479 strongly supporting the favored adsorption process. These finding indicating that pTSa-Ppy@MnO2 has the heterogenous surface and CR formed multilayer on material’s surface.26,27
Table 2: Fitted isotherm models values for CR removal by pTSa-Ppy@MnO2
| Isotherm model | Parameters | Values |
| Langmuir
qe = qmKLCe / 1 + kLCe |
qm | 127. 324 mg/g |
| kL | 0.399 L/mg | |
| R2 | 0.880 | |
| RMSE | 12.617 | |
| Freundlich
qe = kFCe1/n |
n | 4.479 |
| kf | 50.881(mg/g)(L/mg)⁻¹/nF) | |
| R2 | 0.865 | |
| RMSE | 13.378 | |
| Temkin
qe =bT *In (KT * Ce) |
bt | 141.3489 J/mol |
| kt | 16.983 L/mg | |
| R2 | 0.910 | |
| RMSE | 12.049 | |
| where, qm:calculated adsorption capacity; kL:Langmuir constant; R2:coefficient of determination; RMSE:root-mean-square deviation; n:Freundlich constant; kf :Freundlich constant; bt:heat of adsorption; kt:binding constant; | ||
 |
Figure 5: (a) Plots for the analysis of CR adsorption kinetics onto pTSa-Ppy@MnO2, (b) Influence of the solution pH onto CR scavenging, |
Antibacterial Activity
The growth of Bacillus cereus under untreated and treated conditions shows apparent differences in its proliferation in response to pTSa-Ppy and pTSa-Ppy@MnO2. In the control, the B. cereus culture showed the most growth overall, showing a clear exponential phase that began within the first 200 minutes. The maximum O.D. reached 1.40–1.45, indicating steady progression of metabolic activity and unimpeded biomass growth.
pTSa-Ppy at 100 µg/mL reduces bacterial growth. The early growth pattern was like that of the control strain, but the exponential phase had a lower slope, and the final O.D. was about 1·05–1·10. This represents a significant attenuation of B. cereus, confirming that pTSa-Ppy inhibits cell division and biomass formation moderately and provides strong antimicrobial effects. Among all the cultures, the pTSa-Ppy@MnO2 (total 100 µg/mL) showed the most potent inhibitory effect. The slowest growth rate and the lowest final biomass were recorded in this. Their maximum O.D. values were only 0.95–1.00 and later gradually declined at the end of the measurement (Fig. 1a). The pTSa-Ppy@MnO2 may affect long-term cell integrity or viability as it not only reduces growth but also leads to decline. The increase in efficacy possibly arises from a synergistic interaction between pTSa-Ppy and MnO₂. This may happen through generating oxidative stress, disrupting membranes, or targeting critical metabolic processes. The control was found to be least effective, with most bacterial growth, followed by pTSa-Ppy and pTSa-PPy@MnO2. B. Cereus is more susceptible to the pTSa-Ppy@MnO2 than to pure pTSa-Ppy, providing evidence that integrating MnO₂ nanoparticles enhances the antibacterial properties of the polymeric system significantly. These results show that pTSa-Ppy@MnO2 composites can be effective antimicrobial agents, especially against Gram-positive bacteria such as B. cereus.
The growth curves show that the impact of pTSa-Ppy and pTSa-Ppy@MnO2 on E. coli over the monitored period does not change much. The growth of control untreated E. coli were sharply exponential after about 200 min, reaching a stationary-phase OD of 0.95–0.98, indicating normal, unhindered bacterial growth. In contrast, treatment with 100 µg/mL of pTSa-Ppy reduced bacterial growth. The culture followed a similar initial lag and early exponential phase as the control in Fig. 1b. However, the overall slope during the exponential phase was lower, and the final OD was approximately 0.67, indicating moderate growth inhibition by pTSa-Ppy. The reaction did not completely inhibit bacterial growth, but it affected the E. coli metabolic activity and cell division.
The culture treated with pTSa-Ppy@MnO2 (total: 100 µg/mL) shows the highest inhibitory action. This group grew more slowly than exponentially. Biomass was not growing as fast as in the case of control or pTSa-Ppy@MnO2. The culture reached an O.D. of approximately 0.55. However, this reading then began to slightly decrease towards the end of the measurement period. This suggests two things: first, that growth was inhibited; and second, that there may have been destabilization or a partial loss of viability after prolonged exposure. This shows that the combination of pTSa-Ppy and MnO2 has a synergistic effect against microbes. pTSa-Ppy works better with MnO2 nanoparticles, possibly by increasing oxidative stress or by promoting interactions across the bacterial membrane.
The growth curve analysis demonstrated that both E. coli and Bacillus cereus reacted differently to pure pTSa-Ppy and pTSa-Ppy@MnO2. B. Cereus has demonstrated superior biomass production when compared to E. coli under all conditions. In control conditions without treatment both bacteria occurred at a relatively consistent rate and also displayed free metabolic activity. When treated with pure pTSa-Ppy at 100 µg/mL, both species were moderately inhibited, although E. coli experienced a greater inhibitory effect while B.cereus tolerated PPy more effectively. In E. coli, the pTSa-Ppy@MnO2 at a total dose of 100 g/mL shows the most potent antimicrobial activity, reducing the final OD values to ~0.55. coli and ~0.95–1.00 in B. cereus. Both species exhibited slight declines in O.D. at later time points, suggesting growth inhibition and possible destabilization or partial loss of viability with prolonged exposure. Comparatively, E. coli was more sensitive to both pTSa-Ppy and pTSa-Ppy@MnO2 than B. cereus. Despite this, the same hierarchical trend was observed in this organism: Control > pTSa-Ppy > pTSa-Ppy@MnO2, indicating that MnO₂ nanoparticles enhanced antimicrobial activity. The research conducted showed that the combination of MnO₂ and Ppy has superior antimicrobial activity. In addition, it was found that E. coli was more susceptible than B. cereus.
 |
Figure 6: (a) The bacterial growth kinetics of B. cereus and (b) E.coli in the absence and presence of pTSa-Ppy and pTSa-Ppy@MnO2 nanocomposite. Click here to View Figure |
Conclusion
In summary, this work demonstrates that MnO2 insertion and doping with paratoulene sulfonic acid of Ppy improves the selective adsorption of cationic CR dye. The morphological analysis showed the features of both MnO2 nanorods and porous Ppy structures. The structural analysis by XRD and XPS showed that MnO2 is well interacted with Ppy and its successful doping with pTSa. The pTSa-Ppy and pTSa-Ppy@MnO2 showed selective adsorption of anionic CR in contrast to cationic MB dye which was poorly adsorbed. The highest R² of 0.928 and lowest RMSE of 3.445 suggested that adsorption was predominated by the physisorption as well as chemisorption forces. The antibacterial studies against E. Coli and B. cereus showed that the control was found to be least effective, with most bacterial growth, followed by pTSa-Ppy and pTSa-Ppy@MnO2. These results show that pTSa-PPy@MnO2 composites can be effective antimicrobial agents against Gram-positive and Gram-negative bacteria.
Acknowledgment
The author, P.M.Z. Hasan is grateful to the Centre of Nanotechnology, King Abdulaziz University for providing the research facilities.
References
- Fendi W.J.; Naser, J.A. Orient. J. Chem. 2018, 34 (6). http://dx.doi.org/10.13005/ojc/340628
CrossRef - Raj, A.K., Orient. J. Chem. 2025, 41(2), http://dx.doi.org/10.13005/ojc/410236
CrossRef - Yadav, S.; Jilani, A.; Sachan, S.; Kumar, P.; Ansari, S.A.; Afzal, M.; Ansari, M.O. Chemistry., 2024, 6(3), 489. https://doi.org/10.3390/chemistry6030028
CrossRef - Kumar, R.; Ansari, M.O.; Parveen, N.; Barakat, M.A.; Cho, M.H. RSC Adv. 2015, 5, 61486. https://doi.org/10.1039/C5RA10378A
CrossRef - Ansari, M.O.; Kumar, R.; Parveen, N.; Barakat, M.A.; Cho, M.H., NJC, New J. Chem. 2015, 39, 7004. https://doi.org/10.1039/C5NJ01443C
CrossRef - Mohamad, N.; Salleh, N.M.; Mahmud, H.N.M.E., J. Polym. Mater. 2024, 40, 165. https://doi.org/10.32381/JPM.2023.40.3-4.4
CrossRef - Senguttuvan, S.; Senthilkumar, P.; Janaki, V.; Kamala-Kannan, S., Chemosphere. 2021, 267, 129201. https://doi.org/10.1016/j.chemosphere.2020.129201
CrossRef - Dhila, H.; Bhapkar, A.; Bhame, S., Desalin Water Treat. 2025, 321, 101004. https://doi.org/10.1016/j.dwt.2025.101004
CrossRef - Patra, T.; Mohanty, A.; Singh, L.; Muduli, S.; Parhi, P.K.; Sahoo, T.R., Chemosphere. 2022, 288, 132472. https://doi.org/10.1016/j.chemosphere.2021.132472
CrossRef - Iqbal, J.; Numan, A.; Ansari, M.O.; Jagadish, P.R.; Jafer, R.; Bashir, S.; Mohamad, S.; Ramesh, K.; Ramesh, S., Electrochim. Acta. 2020, 348, 136313. https://doi.org/10.1016/j.electacta.2020.136313
CrossRef - Jafer, R.; Alsufyani, S.A.; Iqbal, J.; Ansari, M.O.; Numan, A.; Bashir, S.; Hasan, P.M.Z.; Wageh, S., Polymers. 2023 15(5), 1267. https://doi.org/10.3390/polym15051267
CrossRef - Iqbal, J.; Ansari, M.O.; Numan, A.; Wageh, S.; Al-Ghamdi, A.; Alam, M.G.; Kumar, P.; Jafer, R.; Bashir, S.; Rajpar, A.H., Polymers. 2020, 12(12):2918. 10.3390/polym12122918
CrossRef - Ansari, S.A.; Parveen, N.; Han, T.H.; Ansari, M.O.; Cho, M.H., Phys. Chem. Chem. Phys. 2016,18, 9053. https://doi.org/10.1039/C6CP00159A
CrossRef - Yuan, X.; Li, L.; Ma, Z.; Yu, X.; Wen, X.; Zi-Feng Ma; Zhang, L.; Wilkinson, D.P.; Zhang, J., Scientific Reports. 2016, 6, 20005. https://doi.org/10.1038/srep20005
CrossRef - Farrokhi, H.; Khani, O.; Nemati, F.; Jazirehpour, M., Synth. Met. 2016, 215, 142. https://doi.org/10.1016/j.synthmet.2016.02.016
CrossRef - Ansari, M.O.; Kumar, R.; Ansari, S.A.; Ansari, S.P.; Barakat, M.A.; Alshahrie, A.; Cho, J. Colloid Interface Sci. 2017, 496, 407. https://doi.org/10.1016/j.jcis.2017.02.034
CrossRef - Wang, T.; Jiang, M.; Yu, X.; Niu, N.; Chen, L., Sep. Purif. Technol. 2022, 302, 122116. https://doi.org/10.1016/j.seppur.2022.122116
CrossRef - Gamboa, D.M.P.; Abatal, M.; Lima, E.; Franseschi, F.A.; Ucán, C.A.; Tariq, R.; Elías, M.A.R.; Vargas, J., Int. J. Mol. Sci. 2024, 25(9), 4771. https://doi.org/10.3390/ijms25094771
CrossRef - Mousavi, S.H.; Yaghoobi, M.; Asjadi, F., Sci. Rep. 2024, 14, 18505 (2024); https://doi.org/10.1038/s41598-024-69432-1
CrossRef - Ali, H.; Ismail, A.M., J. Polym. Environ. 2022, 31, 976. https://doi.org/10.1007/s10924-022-02663-3
CrossRef - Yang, Q.; Song, H.; Li, Y.; Pan, Z.; Dong, M.; Chen, F.; Chen, Z., J. Mol. Liq. 2017, 234, 18. https://doi.org/10.1016/j.molliq.2017.03.028
CrossRef - Aigbe, U.O.; Khenfouch, M.; Ho, W.H.; Maity, A.; Vallabhapurapu, V.S.; Hemmaragala, N.M., Desalin. Water. Treat. 2018, 131, 328 (2018); https://doi.org/10.5004/dwt.2018.23028
CrossRef - Bounaas, M.; Bouguettoucha, A,; Chebli, D.; Derbal, K.; Benalia, A.; Pizzi, A., Appl. Sci. 2024, 14(22), 10365. https://doi.org/10.3390/app142210365
CrossRef - Gupta, V.K.; Kumar, R.; Nayak, A.; Saleh, T.A.; Barakat, M.A., Adv. Colloid. Interface Sci. 2013, 193, 24. https://doi.org/10.1016/j.cis.2013.03.003
CrossRef - Firmino, H.C.T.; Nascimento, E.P.; Costa, K.C.; Arzuza, L.C.C.; Araujo, R.N.; Sousa, B.V.; Neves, G.A.; Morales, M.A.; Menezes, R.R., Materials. 2025, 18(4), 754. https://doi.org/10.3390/ma18040754
CrossRef - Ige. A.O.; Ogunsile, B.O.; Ore, O.T.; Olawade, D.B., Discov. Chem. 2024, 1, 9. https://doi.org/10.1007/s44371-024-00010-0
CrossRef - Boahen, G.O.; Sewu, D.D.; Tran, H. N.; Woo, S. H., Colloids and Surfaces A: Physicochemical and Engineering Aspects. 2021, 625, 126911. https://doi.org/10.1016/j.colsurfa.2021.126911
CrossRef
Second Review by: Dr. Purushotham
Final Approval by: Dr. Tanay Pramanik


![]()


