Evaluating the Active Chemical Compounds in Extracts from Various Medicinal Herbs Used for the Treatment of Skin Rashes
 , Abdullah Faleh Albalawi1, Yahya Hamid Al-Maliki1, Hiatam Basheer Al-Huweti1, Hatem A. Al-Aoh1, Mohammad Zubair 2,3, Syed Khalid Mustafa1*
1Department of Chemistry, College of Science, University of Tabuk, Tabuk, Saudi Arabia
2Department of Medical Microbiology, Faculty of Medicine, University of Tabuk, Tabuk, KSA
3Molecular Microbiology and Infectious Diseases Research Unit, University of Tabuk, Tabuk, KSA
Corresponding Author E-mail: khalid.mustafa938@gmail.com
Download this article as:
ABSTRACT:Many countries use the herb to treat ailments. Antioxidants are beneficial for treating skin rashes. Calligonum comosum, Ziziphus spina-christi, and Ruta graveolens have historically treated skin rashes. Saudi Arabia and its neighbours utilise it extensively. The FTIR and GC-MS examined all three plant-specific water extracts. The three plants vary in phytosterol and phenolics. Numerous flavonoids and phenolic acids were identified. Ruta graveolens (N1), Calligonum comosum (N2), and Ziziphus spina-christi (N3) were tested for antibacterial activity utilising time-dependent growth inhibition. P. aeruginosa and Staphylococcus aureus growth curves treated with N1, N2, and N3 revealed bacterial growth and reproduction suppression. N1 and N3 inhibited test microorganisms’ concentration-dependently, with N2 inhibiting S. aureus by 94% and P. aeruginosa by 83% at MIC. N2 showed minimal effect at 0.5xMIC. S. aureus and P. aeruginosa are decreased by 91% and 85% at MIC and 65% and 61% at 0.5xMIC by N2 extract. In contrast, N1's 2xMIC and MIC against P. aeruginosa and S. aureus dropped 91%, 87%, 72%, and 59%. This research may reveal Calligonum comosum, Ziziphus spina-christi, and Ruta graveolens' bioactive substances, molecular processes, and therapeutic impacts on human health. This discovery has increased plant bioactivity understanding and medical uses.
KEYWORDS:FTIR; GC-MS; Identified; Phytochemical; Quantified; Skin Rash
Introduction
Ruta graveolens (N1), Calligonum comosum (N2), and Ziziphus apina-christi (N3) are three herbs that have been used throughout history for the treatment of skin rashes. It is also used in Saudi Arabia and the neighbouring countries.
Calligonum comosum (N2)
The plant in question has been traditionally used medicinally. The polygonaceous perennial shrub, Calligonum comosum, grows in the sandy deserts of North Africa, Western Asia, and the Middle East. This plant, called “Arta” in certain places, has been used in folk medicine to cure numerous diseases in dry climates. C. comosum’s antioxidant polyphenol concentration makes it a valuable medicinal plant in Saudi Arabia and other Middle Eastern nations. This Egyptian desert plant includes bioactive components that boost its medicinal properties.1-3 Medical professionals in Oman use C. comosum to treat inflammation, tooth pain, gum lesions, and ulcers. Rural Tunisians have used this plant to treat microbiological diseases. The physiological properties of this plant include antibacterial, antioxidant, anti-inflammatory, anti-gastric ulcer, and anti-hyperglycaemic effects. Additionally, it treats gastrointestinal issues and tooth discomfort.4,5 In addition, it is utilised in traditional medicine to treat skin diseases.6
Ruta graveolens (N1)
The plant known as rue, or Ruta graveolens L., has a long history of traditional usage and a wide range of pharmacological qualities. A member of the Rutaceae family, this plant is known for its strong bitter taste and unique smell. Numerous communities have utilised it for medicinal purposes to cure diseases ranging from gynaecological issues to pain relief. These effects are affected by the plant’s phytochemical composition, which includes flavonoids, coumarins, alkaloids, and essential oils. Among these are the alkaloids gravacridondiol, rutacridone, and rutacridone epoxide. Coumarins consist of psoralen, methoxypsoralen, bergapten, isoimperatorin, isopimpinellin, and xanthotoxin. Quercetin and rutin are flavonoids. Essential oils: The main monoterpene components are 1,8-cineole, limonene, and α-pinene. The major ingredients of volatile oils extracted from plant aerial sections are 2-ketones, namely undecanone-2, 2-nonanone, 2-acetoxy tetradecanone, and nonyl cyclopropane carboxylate.7-10
Ziziphus spina-christi (N3)
Christian Thorn Jujube, also known as Ziziphus spina-christi (L.) Desf., is a tree native to the Middle East’s tropics and subtropics. It is well-known for its delicious fruits, as well as its health advantages. The medicinal properties of this widely distributed plant make it an important subject for research in the Middle East, South Asia, and East Asia. The plant has been linked to diabetes, malaria, typhoid fever, liver problems, skin infections, urinary issues, obesity, diarrhoea, and fatigue. Traditional uses include treating asthma, fever, pain, wounds, ulcers, eye problems, and dandruff. The traditional usage of Z. spina-christi has prompted more investigation into its pharmacological and bioactive chemical characteristics. Z. spina-christi is one of 193 chemicals discovered in different sections of plants. It has an abundance of polyphenols and flavonoids. These chemicals are beneficial to plants, making them an ideal target for medication. A recent study confirms Z. spina-christi’s antibacterial, antifungal, antioxidant, antihyperglycemic, and antinociceptive properties. The present scientific research examines the phytochemical constitution, and bioactivities of Z. spina-christi to see if they may be employed for medicinal reasons.11-14
Materials and Methods
The first step of chemical analysis is to collect and prepare plant samples. The Tabuk area is utilised to collect different components of Ruta graveolens (N2), Calligonum comosum (N1), and Ziziphus spina-christi (N3), such as leaves, fruits, seeds, and roots, for the research.15 To maximise extraction efficiency and improve preservation, plant material is usually dried after collection to reduce moisture content.16 Researchers employed the oven-drying approach to speed up the drying process by working at controlled temperatures (such as 40-60°C). To increase the surface area for solvent extraction, the dried plant material is ground into a fine powder. Each extract sample was prepared for examination by dissolving 80 milligrams (mg) of dried or finely powdered plant material in 250 millilitres of water as a solvent. Until further study, the powdered material is stored in airtight containers that are protected from moisture and light. HPLC and gas chromatography-mass spectrometry (GC-MS) have been employed to identify bioactive components.17 The researchers employed the GC-MS [Shimadzu of the United States] Method 8260 to analyse volatile organic chemicals and the Method 8270 to investigate semi-solid organic compounds.
Bioactivity
The antibacterial activity of Ruta graveolens (N1), Calligonum comosum (N2), and Ziziphus apina-christi (N3) was determined using a time-dependent growth inhibition experiment.
Bacterial Strains Used
We use P aeruginosa and S aureus from laboratory stock. We selected well-characterized, pre-identified strains, cefoxitin-resistant, ESBL positive P. aeruginosa, and methicillin-resistant S. aureus from the stock culture. The P. aeruginosa was reassessed as cefoxitin resistant and ESBL positive, while S. aureus was for methicillin resistance using CLSI guidelines. The standard strains used were P. aeruginosa ATCC 27853 and S aureus ATCC 25923.
Biofilm Formation in 96-Well Microtiter Plates
Biofilm formation was evaluated qualitatively using the method previously published18 using the technique in 96-well flat-bottom plates. Biofilm experiments were done in triplicate, and the average biofilm absorbance value was calculated. Biofilm formation was categorized as weak (OD590 0.1-0.400), moderate (OD590 > 0.400), and strong (OD590 > 0.800).
Minimum Inhibitory Concentration (MIC) Activity of Extracts
Using the conventional CLSI micro-broth dilution method, the MIC of Ruta graveolens (N1), Calligonum comosum (N2), and Ziziphus apina-christi (N3) against drug-resistant biofilm-positive strains of P. aeruginosa and S. aureus was ascertained [19]. The extract possesses initial concentrations of 66000mg/L for N1, 33000 mg/L for N2, and 33000 mg/L for N3. To investigate the bacterial growth curve and inhibition on a microtiter plate, inoculations were derived from fresh colonies on MHA plates into 10 ml of Luria Bertani (LB) culture media. Growth was permitted until the optical density attained 0.1 at 580 nm, which corresponds to 108 CFU/ml of media. Subsequently, 2×10⁸ CFU/ml from the aforementioned was added to 1.5 ml of liquid LB media supplemented with 0, 0.5x, 0.25x, 0.125x, and 0.0625x of the initial concentrations of Ruta graveolens (N1), Calligonum comosum (N2), and Ziziphus apina-christi (N3) extracts. Bacterial growth was assessed by measuring optical density every 2 hours. The minimum concentration at which no exponential phase was observed after 18-22 hours of incubation at 37°C and 580nm was designated for the antibiofilm experiment, utilizing this concentration (MIC) and 0.5xMIC with minor modifications.
Effect of Extract on Biofilm Formation
In the inhibition assays, bacteria seeded on microtiter plates were subjected to MIC and 0.5xMIC. The treated mixes were incubated for 48 hours at 37 degrees Celsius. To measure biofilm inhibition, the procedures outlined in the previous section were used. While negative control wells were filled solely with Tryptic Soy Broth (TSB), positive control wells were devoid of extracts. Immediately following the incubation, the plates were carefully rinsed with 1X phosphate-buffered saline (PBS, pH 7.4) and stained for 30 minutes at room temperature with 100 μl of 0.1% crystal violet solution (Sigma-Aldrich, St. Louis, MO). The crystal violet was subsequently solubilized in 95% ethanol, and surplus dye was eliminated via washing. Finally, the optical density of the biofilm’s supernatant was assessed at 590 nm (OD590 nm).19 Every experiment was carried out three times.
Results and Discussions
The FTIR Results and Discussions
The FTIR analysis of these three plants consistently finds significant functional groups that represent their phytochemical diversity. Common results include:
Alkane (C-H) stretches often emerge at 2918-2851 cm⁻¹, suggesting the presence of saturated hydrocarbons and fatty acids.
Carbonyl (C=O) stretches at 1729 cm⁻¹ indicate esters, ketones, and conjugated carbonyls.
Amine and amide groups (N-H) occur at varying frequency based on hydrogen bonding patterns.
Identify aromatic compounds using C=C stretching vibrations in the 1500-1600 cm⁻¹ region. • Identify phenolic and alcoholic (O-H) groups. Broad absorption bands at 3000-3500 cm⁻¹.20
FT-IR spectra results
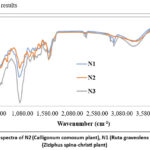 |
Figure 1: FT-IR spectra of N2 (Calligonum comosum plant), N1 (Ruta graveolens plant), and N3 (Ziziphus spina-christi plant). Click here to View Figure |
FTIR examination of Ruta graveolens (N1) plant extracts shows functional groups of secondary metabolites such hydroxyl (-OH), carbonyl (C=O), aliphatic nitriles (CN), and amides, which contribute to the plant’s therapeutic properties. For distinct functional groups, the FTIR spectrum shows separate absorption peaks at particular wavenumbers. Ruta graveolens, or rue, is a phenolic-rich plant having therapeutic benefits. Plants contain furanocoumarins and flavonoids.
Calligonum comosum (N2) FTIR indicates alkanes, aromatics, aliphatic amines, and carboxylic acids. FTIR shows that C. comosum’s ethyl acetate fraction includes several phytochemical profiles and bioactive classes. The spectral data showed C-I stretch, C=O stretch, C-H stretch, and C-N bond peaks, indicating plant chemical structures.
FTIR analysis of Ziziphus spina-christi (N3) revealed functional groups, suggesting bioactive chemicals. Spectroscopic analysis identified hydroxyl groups, carbonyl functionalities, and aromatic compounds connected to the plant’s antioxidant and anti-inflammatory properties. Figure -1 illustrates one for each herb.
The fingerprint region (600-1500 cm⁻¹) of FTIR spectra helps distinguish these three substances. Identification and quality control are achievable since each plant has unique absorption patterns that reflect its phytochemical composition. The region also provides information on C-O-C, C=O, and C-N stretching vibrations, which highlight secondary metabolite structure.
FTIR shows hydroxyl and carbonyl functionalities, which indicate antibacterial, antioxidant, and anti-inflammatory action. The spectroscopic characterisation of all three species supports their traditional medicinal uses and indicates the presence of molecules responsible for their pharmacological properties [20].
GC- MS Results and Discussions
Different chemical compounds were found in GC-MS analysis of Calligonum comosum (N2), Ruta graveolens (N1), and Ziziphus spina-christi (N3) Terpenoids, lipid molecules, alcohol compounds, and ketones were found in this investigation at various quantities. One may be seen in Tables 1 to 6.
The GC-MS investigation of Calligonum comosum (N2) yielded a large number of volatile and non-volatile chemical compounds with different concentrations. The main components are viridiflorol, palmitic acid, and 9-octadecenoic acid. The principal ingredients of the essential oil were found to be sesquiterpenes, monoterpenes, and aliphatic hydrocarbons. Additionally, the plant’s protective volatile oil includes a significant amount of benzaldehyde derivative. The GC-MS investigation of Ziziphus spina-christi stem bark extracts revealed a large number of volatile and non-volatile chemical compounds with different concentrations, including of alkaloids, tannins, flavonoids, glycosides, phenols, and terpenoids, and phytol. Gallic acid, ellagic acid, quercetin, phenol 2,5-bis(1,1-dimethylethyl), and decane, 2-methyl were found. The major components of essential oils were found to be trans-caryophyllene, alpha-pinene, and beta-caryophyllene. These three plant species contain a variety of bioactive compounds with great therapeutic potential, according to FTIR and GC-MS examinations. Functional group identification via FTIR detects phenolic compounds, flavonoids, and terpenoids, whereas GC-MS quantifies substances. These findings support the plants’ historic use and its pharmacological and nutraceutical potential.21,22
Table 1: Volatile organic compounds (VOCS) analysis Sample code: Q1 Teucrium polumBio Activity
| S.No. | Compounds detected | Results &unit: mg /l |
| 1 | Benzene | 0.5877 |
| 2 | Ethane, 1,1-dichloro- | 0.5797 |
| 3 | p-Isopropylbenzene (o-Cymene) | 0.5007 |
| 4 | Ethylbenzene | 0.403 |
| 5 | Ethylene, 1,2-dichloro-, (Z)- | 0.3915 |
| 6 | o-Xylene | 0.3742 |
| 7 | Benzene, 1,2-dichloro- | 0.0411 |
| 8 | Propane, 1,2,3-trichloro- | 0.0001 |
| 9 | Methane, bromodichloro- | 0.0001 |
| 10 | Methane, dibromo- | 0.0001 |
| 11 | Methane, dibromochloro- | 0.0001 |
| 12 | Methylene chloride | 0.0001 |
| 13 | m-Xylene | 0.0001 |
| 14 | Naphthalene | 0.0001 |
| 15 | Propane, 1,2-dibromo-3-chloro- | 0.0001 |
| 16 | Isopropylbenzene | 0.0001 |
| 17 | Propane, 1,2-dichloro- | 0.0001 |
| 18 | Propane, 1,3-dichloro– | 0.0001 |
| 19 | Propene, 1,1-dichloro- | 0.0001 |
| 20 | p-Xylene | 0.0001 |
| 21 | Sec- butylbenzene | 0.0001 |
| 22 | Trichloroethylene | 0.0001 |
| 23 | Toluene | 0.0001 |
| 24 | trans-1,2-dichloro Ethene | 0.0001 |
| 25 | trans-1,3-Dichloropropene | 0.0001 |
| 26 | Methylene chloride | 0.0001 |
| 27 | Ethene, 1,1-dichloro- | 0.0001 |
| 28 | Hexachlorobutadiene | 0.0001 |
| 29 | Benzene, chloro- | 0.0001 |
| 30 | 2-Chlorotoluene | 0.0001 |
| 31 | 2-Pentanone | 0.0001 |
| 32 | Benzene, 1,2,3-trichloro- | 0.0001 |
| 33 | Benzene, 1,2,4-trichloro- | 0.0001 |
| 34 | Benzene, 1,2,4-trimethyl- | 0.0001 |
| 35 | Benzene, 1,2,5-trimethyl- | 0.0001 |
| 36 | Benzene, 1,3-dichloro- | 0.0001 |
| 37 | Benzene, bromo- | 0.0001 |
| 38 | Benzene, propyl- | 0.0001 |
| 39 | cis-1,3-Dichloro-Propene | 0.0001 |
| 40 | Benzene, propyl- | 0.0001 |
| 41 | Benzene, tert-butyl- | 0.0001 |
| 42 | Bromoform | 0.0001 |
| 43 | Chloroform | 0.0001 |
| 44 | Cyclopentane, methyl- | 0.0001 |
| 45 | Ethane, 1,1,1-trichloro- | 0.0001 |
| 46 | Ethane, 1,1,2-trichloro- | 0.0001 |
| 47 | Ethane, 1,2-dibromo- | 0.0001 |
| 48 | Tetrachloroethylene | 0.0001 |
Table 2: Semi Volatile Organic Compounds (SVOCs) Analysis Report Q1 – Teucrium polum
| S. No. | Compounds | Concentration (mg/l) |
| 1 | Benzo[a]pyrene | 0.0271 |
| 2 | Benzo[k]fluoranthene | 0.0135 |
| 3 | Dimethyl phthalate | 0.0102 |
| 4 | Di-n-octyl phthalate | 0.0099 |
| 5 | Naphthalene, 2-methyl- | 0.0093 |
| 6 | Diethyl Phthalate | 0.0083 |
| 7 | Anthracene | 0.0049 |
| 8 | 4-Nitroaniline | 0.0044 |
| 9 | Azobenzene | 0.0012 |
| 10 | 2-Nitroaniline | 0.0015 |
| 11 | Carbazole | 0.0013 |
| 12 | Phenol, 2-nitro- | 0.0014 |
| 13 | Dibutyl phthalate | 0.0010 |
| 14 | 2,4-Dinitrotoluene | 0.0010 |
| 15 | Isophorone | 0.0008 |
| 16 | Phenol, 4-methyl (p-Cresol) | 0.0007 |
| 17 | Phenanthrene | 0.0007 |
| 18 | Naphthalene | 0.0006 |
| 19 | Benzene, 1,2-dichloro- | 0.0003 |
| 20 | Benzene, 1,4-dichloro- | 0.0003 |
| 21 | Bis(2-ethylhexyl) phthalate | 0.0003 |
| Undetectable Compounds (<0.0001 mg/l) | < 0.0001 | |
| 22 | 1,1′-Biphenyl, 2-methyl- | < 0.0001 |
| 23 | 2,6-Dinitrotoluene | < 0.0001 |
| 24 | 3-Nitroaniline | < 0.0001 |
| 25 | 4-Bromophenyl ether | < 0.0001 |
| 26 | 4-Chloroaniline | < 0.0001 |
| 27 | Acenaphthene | < 0.0001 |
| 28 | Acenaphthylene | < 0.0001 |
| 29 | Benz[a]anthracene | < 0.0001 |
| 30 | Benzene, 1,3,4-trichloro- | < 0.0001 |
| 31 | Benzene, 1,3-dichloro- | < 0.0001 |
| 32 | Benzene, 1-chloro-3-phenoxy- | < 0.0001 |
| 33 | Benzene, hexachloro- | < 0.0001 |
| 34 | Benzene, nitro- | < 0.0001 |
| 35 | Benzo[b]fluoranthene | < 0.0001 |
| 36 | Benzo[ghi]perylene | < 0.0001 |
| 37 | Benzyl butyl phthalate | < 0.0001 |
| 38 | Bis(2-chloroethyl) ether | < 0.0001 |
| 39 | Chrysene | < 0.0001 |
| 40 | Dibenzofuran | < 0.0001 |
| 41 | Ethane, hexachloro- | < 0.0001 |
| 42 | Fluoranthene | < 0.0001 |
| 43 | Fluorene | < 0.0001 |
| 44 | Hexachlorobutadiene | < 0.0001 |
| 45 | Hexachlorocyclopentadiene | < 0.0001 |
| 46 | Indeno[1,2,3-cd]pyrene | < 0.0001 |
| 47 | Methane, bis(2-chloroethoxy)- | < 0.0001 |
| 48 | Naphthalene, 2-chloro- | < 0.0001 |
| 49 | Pentacene | < 0.0001 |
| 50 | Phenol | < 0.0001 |
| 51 | Phenol, 2,4,5-trichloro- | < 0.0001 |
| 52 | Phenol, 2,4,6-trichloro- | < 0.0001 |
| 53 | Phenol, 2,4-dichloro- | < 0.0001 |
| 54 | Phenol, 2,4-dimethyl- | < 0.0001 |
| 55 | Phenol, 2,4-dinitro- | < 0.0001 |
| 56 | Phenol, 2-chloro- | < 0.0001 |
| 57 | Phenol, 2-methyl- | < 0.0001 |
| 58 | Phenol, 2-methyl, 4,6-dinitro- | < 0.0001 |
| 59 | Phenol, 4-chloro-3-methyl- | < 0.0001 |
| 60 | Phenol, pentachloro- | < 0.0001 |
| 61 | Pyrene | < 0.0001 |
| 62 | Tetradecane | < 0.0001 |
Table 3: Volatile Organic Compounds (VOCs) Analysis Report Q2 – Salvia officinalis
| S.No. | Compounds detected | Result (mg/l) |
| 1 | Benzene | 0.5867 |
| 2 | Ethane, 1,1-dichloro- | 0.5787 |
| 3 | p-Isopropylbenzene (o-Cymene) | 0.5015 |
| 4 | Benzene, tert-butyl- | 0.4739 |
| 5 | Benzene, propyl- | 0.4294 |
| 6 | Ethylbenzene | 0.4034 |
| 7 | o-Xylene | 0.3748 |
| 8 | Propane, 1,2,3-trichloro- | 0.2658 |
| 9 | 2-Chlorotoluene | 0.2445 |
| 10 | Benzene, 1,2,5-trimethyl- | 0.1202 |
| 11 | Benzene, 1,2-dichloro- | 0.0403 |
| 12 | Benzene, chloro- | 0.0219 |
| 13 | Propane, 1,2-dichloro- | <0.0001 |
| 14 | Propane, 1,3-dichloro- | <0.0001 |
| 15 | Propene, 1,1-dichloro- | <0.0001 |
| 16 | p-Xylene | <0.0001 |
| 17 | Sec- butylbenzene | <0.0001 |
| 18 | Tetrachloroethylene | <0.0001 |
| 19 | Toluene | <0.0001 |
| 20 | trans-1,2-dichloro Ethene | <0.0001 |
| 21 | trans-1,3-Dichloropropene | <0.0001 |
| 22 | Trichloroethylene | <0.0001 |
| 23 | Ethene, 1,1-dichloro- | <0.0001 |
| 24 | cis-1,3-Dichloro-Propene | <0.0001 |
| 25 | 2-Pentanone | <0.0001 |
| 26 | Benzene, 1,2,3-trichloro- | <0.0001 |
| 27 | Benzene, 1,2,4-trichloro- | <0.0001 |
| 28 | Benzene, 1,2,4-trimethyl- | <0.0001 |
| 29 | Benzene, 1,3-dichloro- | <0.0001 |
| 30 | Benzene, bromo- | <0.0001 |
| 31 | Benzene, n-butyl- | <0.0001 |
| 32 | Bromoform | <0.0001 |
| 33 | Chloroform | <0.0001 |
| 34 | Cyclopentane, methyl- | <0.0001 |
| 35 | Ethane, 1,1,1-trichloro- | <0.0001 |
| 36 | Ethane, 1,1,2-trichloro- | <0.0001 |
| 37 | Ethane, 1,2-dibromo- | <0.0001 |
| 38 | Ethylene, 1,2-dichloro-, (Z)- | <0.0001 |
| 39 | Hexachlorobutadiene | <0.0001 |
| 40 | Isopropylbenzene | <0.0001 |
| 41 | Methane, bromochloro- | <0.0001 |
| 42 | Methane, bromodichloro- | <0.0001 |
| 43 | Methane, dibromo- | <0.0001 |
| 44 | Methane, dibromochloro- | <0.0001 |
| 45 | Methylene chloride | <0.0001 |
| 46 | m-Xylene | <0.0001 |
| 47 | Naphthalene | <0.0001 |
| 48 | Propane, 1,2-dibromo-3-chloro- | <0.0001 |
Table 4: Semi Volatile Organic Compounds (SVOCs) Analysis Report Q2 – Salvia officinalis
| S. No. | Compounds | Concentration (mg/l) |
| 1 | Di-n-octyl phthalate | 0.0338 |
| 2 | Dimethyl phthalate | 0.0046 |
| 3 | 4-Nitroaniline | 0.0021 |
| 4 | Carbazole | 0.0018 |
| 5 | Fluoranthene | 0.0007 |
| 6 | 2-Nitroaniline | 0.0006 |
| 7 | Pyrene | 0.0006 |
| 8 | Naphthalene | 0.0005 |
| 9 | Bis(2-ethylhexyl) phthalate | 0.0005 |
| 10 | Diethyl Phthalate | 0.0004 |
| 11 | Phenol, 2-nitro- | 0.0003 |
| 12 | Dibutyl phthalate | 0.0003 |
| 13 | Benzene, 1,2-dichloro- | 0.0002 |
| 14 | Benzene, 1,4-dichloro- | 0.0002 |
| 15 | Isophorone | 0.0002 |
| 16 | Benzo[k]fluoranthene | <0.0001 |
| 17 | Benzene, 1,3-dichloro- | <0.0001 |
| 18 | Acenaphthylene | <0.0001 |
| 19 | Anthracene | <0.0001 |
| 20 | Azobenzene | <0.0001 |
| 21 | Dibenzofuran | <0.0001 |
| 22 | Benz[a]anthracene | <0.0001 |
| 23 | Chrysene | <0.0001 |
| 24 | Benzene, 1,3,4-trichloro- | <0.0001 |
| 25 | Ethane, hexachloro- | <0.0001 |
| 26 | Benzo[ghi]perylene | <0.0001 |
| 27 | Bis(2-chloroethyl) ether | <0.0001 |
| 28 | Benzene, 1-chloro-3-phenoxy- | <0.0001 |
| 29 | Benzene, hexachloro- | <0.0001 |
| 30 | Benzene, nitro- | <0.0001 |
| 31 | Benzyl butyl phthalate | <0.0001 |
| 32 | Benzo[a]pyrene | <0.0001 |
| 33 | Acenaphtherne | <0.0001 |
| 34 | Benzo[b]fluoranthene | <0.0001 |
| 35 | Fluorene | <0.0001 |
| 36 | 4-Chloroaniline | <0.0001 |
| 37 | Phenol, 2,4-dinitro- | <0.0001 |
| 38 | Hexachlorocyclopentadiene | <0.0001 |
| 39 | Indeno[1,2,3-cd]pyrene | <0.0001 |
| 40 | Methane, bis(2-chloroethoxy)- | <0.0001 |
| 41 | Naphthalene, 2-chloro- | <0.0001 |
| 42 | Naphthalene, 2-methyl- | <0.0001 |
| 43 | Pentacene | <0.0001 |
| 44 | Phenanthrene | <0.0001 |
| 45 | Phenol, 2,4,5-trichloro- | <0.0001 |
| 46 | Phenol, 2,4,6-trichloro- | <0.0001 |
| 47 | Phenol, 2,4-dichloro- | <0.0001 |
| 48 | Phenol, 2,4-dimethyl- | <0.0001 |
| 49 | Phenol, 2-chloro- | <0.0001 |
| 50 | Hexachlorobutadiene | <0.0001 |
| 51 | Phenol, 2-methyl- | <0.0001 |
| 52 | Phenol, 2-methyl, 4,6-dinitro- | <0.0001 |
| 53 | Phenol, 4-chloro-3-methyl- | <0.0001 |
| 54 | Phenol, 4-methyl (p-Cresol) | <0.0001 |
| 55 | Phenol, pentachloro- | <0.0001 |
| 56 | Tetradecane | <0.0001 |
| 57 | Phenol | <0.0001 |
| 58 | 1,1′-Biphenyl, 2-methyl- | <0.0001 |
| 59 | 2,4-Dinitrotoluene | <0.0001 |
| 60 | 2,6-Dinitrotoluene | <0.0001 |
| 61 | 3-Nitroaniline | <0.0001 |
| 62 | 4-Bromophenyl ether | <0.0001 |
Table 5: Volatile Organic Compounds (VOCs) Analysis Q3 – Artemisiaherba alba
| S. No. | Compounds detected | Result(mg/l) |
| 1 | Benzene | 0.5841 mg/l |
| 2 | Isopropylbenzene | 0.4666 mg/l |
| 3 | Ethylbenzene | 0.4007 mg/l |
| 4 | o-Xylene | 0.3726 mg/l |
| 5 | Benzene, 1,2,5-trimethyl- | 0.121 mg/l |
| 6 | Benzene, 1,2-dichloro- | 0.0367 mg/l |
| 7 | Ethene, 1,1-dichloro- | 0.0001 mg/l |
| 8 | cis-1,3-Dichloro-Propene | 0.0001 mg/l |
| 9 | 2-Chlorotoluene | 0.0001 mg/l |
| 10 | 2-Pentanone | 0.0001 mg/l |
| 11 | Benzene, 1,2,3-trichloro- | 0.0001 mg/l |
| 12 | Benzene, 1,2,4-trichloro- | 0.0001 mg/l |
| 13 | Benzene, 1,2,4-trimethyl- | 0.0001 mg/l |
| 14 | Benzene, 1,3-dichloro- | 0.0001 mg/l |
| 15 | Benzene, bromo- | 0.0001 mg/l |
| 16 | Benzene, chloro- | 0.0001 mg/l |
| 17 | Benzene, n-butyl- | 0.0001 mg/l |
| 18 | Benzene, propyl- | 0.0001 mg/l |
| 19 | Benzene, tert-butyl- | 0.0001 mg/l |
| 20 | Bromoform | 0.0001 mg/l |
| 21 | Chloroform | 0.0001 mg/l |
| 22 | Cyclopentane, methyl- | 0.0001 mg/l |
| 23 | Ethane, 1,1,1-trichloro- | 0.0001 mg/l |
| 24 | Ethane, 1,1,2-trichloro- | 0.0001 mg/l |
| 25 | Ethane, 1,1-dichloro- | 0.0001 mg/l |
| 26 | Ethane, 1,2-dibromo- | 0.0001 mg/l |
| 27 | Ethylene, 1,2-dichloro-, (Z)- | 0.0001 mg/l |
| 28 | Hexachlorobutadiene | 0.0001 mg/l |
| 29 | Methane, bromochloro- | 0.0001 mg/l |
| 30 | Methane, bromodichloro- | 0.0001 mg/l |
| 31 | Methane, dibromo- | 0.0001 mg/l |
| 32 | Methane, dibromochloro- | 0.0001 mg/l |
| 33 | Methylene chloride | 0.0001 mg/l |
| 34 | m-Xylene | 0.0001 mg/l |
| 35 | Naphthalene | 0.0001 mg/l |
| 36 | p-Isopropylbenzene (o-Cymene) | 0.0001 mg/l |
| 37 | Propane, 1,2,3-trichloro- | 0.0001 mg/l |
| 38 | Propane, 1,2-dibromo-3-chloro- | 0.0001 mg/l |
| 39 | Propane, 1,2-dichloro- | 0.0001 mg/l |
| 40 | Propane, 1,3-dichloro- | 0.0001 mg/l |
| 41 | Propene, 1,1-dichloro- | 0.0001 mg/l |
| 42 | p-Xylene | 0.0001 mg/l |
| 43 | Sec-butylbenzene | 0.0001 mg/l |
| 44 | Tetrachloroethylene | 0.0001 mg/l |
| 45 | Toluene | 0.0001 mg/l |
| 46 | trans-1,2-dichloro Ethene | 0.0001 mg/l |
| 47 | trans-1,3-Dichloropropene | 0.0001 mg/l |
| 48 | Trichloroethylene | 0.0001 mg/l |
Table 6: Semi volatile Organic Compounds (SVOCs) Analysis Report Sample Code: Q3 – Artemisia Erba alba
| S. No. | Compounds detected | Result (mg/l) |
| 1 | Nitroaniline | 0.0402 |
| 2 | Naphthalene,2-methyl- | 0.0400 |
| 3 | Fluorene | 0.0275 |
| 4 | Di-n-octyl phthalate | 0.0225 |
| 5 | Diethyl Phthalate | 0.0216 |
| 6 | Isophorone | 0.0111 |
| 7 | Phenol, 2-nitro- | 0.0108 |
| 8 | Acenaphthylene | 0.0088 |
| 9 | Dibutyl phthalate | 0.0050 |
| 10 | Azobenzen | < 0.0044 |
| 11 | Phenol, 4methyl (p-Cresol) | < 0.0027 |
| 12 | Phenol | 0.0022 |
| 13 | chloroaniline | 0.0022 |
| 14 | Dimethyl phthalate | 0.0017 |
| 15 | Phenol, 2,4-dimethyle | 0.0017 |
| 16 | Benzene, nitro- | 0.0013 |
| 17 | Bis(2-ethylhexyl) phthalate | 0.0013 |
| 18 | Naphthalene, 2-chloro- | 0.0013 |
| 19 | 2,4-Dinitrotoluene | 0.0012 |
| 20 | Anthracene | 0.0004 |
| 21 | Bis(2-chloroethyle) ether | 0.0003 |
| 22 | Naphthalene | 0.0003 |
| 23 | Benzyl butyl phthalate | 0.0001 |
| 24 | 1,1′-Biphenyl, 2-methyl- | < 0.0001 |
| 25 | 2,6-Dinitrotoluene | < 0.0001 |
| 26 | 2-Nitroaniline | < 0.0001 |
| 27 | 3- Nitroaniline | < 0.0001 |
| 28 | 4-Bromophenyl ether | < 0.0001 |
| 29 | Acenaphthene | < 0.0001 |
| 30 | Acenaphthylene | < 0.0001 |
| 31 | Benz[a]anthrance | < 0.0001 |
| 32 | Benzene, 1,2-dichloro- | < 0.0001 |
| 33 | Benzene, 1,3,4-trichloro- | < 0.0001 |
| 34 | Benzene, 1,3-dichloro- | < 0.0001 |
| 35 | Benzene, 1,4-dichloro- | < 0.0001 |
| 36 | Benzene, 1-chloro-3-phenoxy | < 0.0001 |
| 37 | Benzene, hexachloro- | < 0.0001 |
| 38 | Benzo[a] pyrene | < 0.0001 |
| 39 | Benzo[b] fluoranthene | < 0.0001 |
| 40 | Benzo[ghi] perylene | < 0.0001 |
| 41 | Benzo[k] fluoranthene | < 0.0001 |
| 42 | Carbazole | < 0.0001 |
| 43 | chrysene | < 0.0001 |
| 44 | Dibenzofuran | < 0.0001 |
| 45 | Ethane, hexachloro | < 0.0001 |
| 46 | fluoranthene | < 0.0001 |
| 47 | Hexachlorobutadiene | < 0.0001 |
| 48 | Hexachlorocyclopentadiene | < 0.0001 |
| 49 | Indeno[1m2,3-cd]pyrene | < 0.0001 |
| 50 | Methane, bis(2-chloroethoxy)- | < 0.0001 |
| 51 | Naphthalene,2-methyl- | < 0.0001 |
| 52 | Pentacene | < 0.0001 |
| 53 | phenanthrene | < 0.0001 |
| 54 | Phenol, 2,4,5-trichloro- | < 0.0001 |
| 55 | Phenol, 2,4,6-trichloro- | < 0.0001 |
| 56 | Phenol, 2,4-dichloro- | < 0.0001 |
| 57 | Phenol, 2,4-dinitro- | < 0.0001 |
| 58 | Phenol, 2-chloro- | < 0.0001 |
| 59 | Phenol, 2-methyl- | < 0.0001 |
| 60 | Phenol, 2-methyl, 4,6-dinitro- | < 0.0001 |
| 61 | Phenol, 4-chloro-3-methyl- | < 0.0001 |
| 62 | Phenol, pentachloro | < 0.0001 |
| 63 | Pyrene | < 0.0001 |
| 64 | Tetradecane | < 0.0001 |
MIC by Growth curve time assay
The antibacterial activity of Ruta graveolens (N1), Calligonum comosum (N2), and Ziziphus apina-christi (N3) was tested utilizing a time-dependent growth inhibition assay. The growth curves of P aeruginosa and Staphylococcus aureus treated with N1, N2, and N3 showed that these extracts have the capacity to inhibit bacterial growth and reproduction. Table – 7 and Figure-2 shows the growth of P. aeruginosa in LB broth inoculated with 108 CFU/mL and exposed to 0.5x, 0.25x, 0.125x, and 0.0625x concentrations of N1 (66000 mg/L), N2 (33000 mg/L), and N3 (33,000 mg/L). There was a delay in exponential and growth at all concentrations: lag, exponential, and stabilization; however, decline phases were absent, as OD580 values included both viable and non-viable bacteria. In the absence of extract, P. aeruginosa rapidly entered the exponential growth phase with control; however, treatment with 0.0625x of N1, 0.5x of N2 and 0.25x N3 delayed growth for up to 4-5 hours, demonstrating significant bacteriostatic action at lower doses and bactericidal effects at higher concentrations. Similarly for S. aureus, treatments with 0.125x N2 and 0.5x N3 show decline and stagnation of growth, respectively. While N1 shows variable results without any clear sign of inhibition or stagnant phase, which indicates no effect at these concentrations [Table – 8] and (Figure -2). Doubling the concentration of N1 at 2x MIC shows a decline in the exponential phase, suggesting higher concentrations.
 |
Table 7: Pseudomonas aeruginosa growth time assay with MIC analysis. Click here to View Table |
 |
Table 8: S aureus growth time assay with MIC analysis. Click here to View Table |
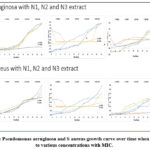 |
Figure 2: Pseudomonas aeruginosa and S aureus growth curve over time when exposed to various concentrations with MIC. Click here to View Figure |
Biofilm Inhibition assay
Herbal extracts of Ruta graveolens (N1), Calligonum comosum (N2), and Ziziphus apina-christi (N3) was suppress biofilm formation at MIC and 0.5xMIC levels, according to antimicrobial growth curves. Figure 3 & 4 illustrates the outcomes of the biofilm inhibition investigation. N1, N2, and N3 had concentration-dependent effects on test microorganisms, with N2 inhibiting S. aureus by 94% and P. aeruginosa by 83% at MIC. In contrast, there were not much difference at 0.5xMIC for N2. The N2 extract exhibits a reduction of 91% & 85% at the MIC and 65% and 61% at the 0.5xMIC for S aureus and P seruginosa respectively. In contrast, the 2xMIC and MIC of N1 against P. aeruginosa and S aureus exhibited reductions of 91% & 87% at the 2xMIC and 72% and 59% at the MIC, respectively. Can be seen in the Table -9.
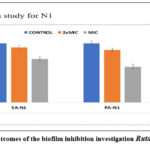 |
Figure 3: The outcomes of the biofilm inhibition investigation Ruta graveolens (N1), Click here to View Figure |
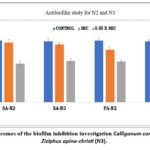 |
Figure 4: The outcomes of the biofilm inhibition investigation Calligonum comosum (N2), and Ziziphus apina-christi (N3). Click here to View Figure |
Table 9: Pseudomonas aeruginosa, and S aureus Biofilm Inhibition assay in microtiter plate.
| NO GRWOTH BY MIC AT CONCENTRATION | ||||||
| PS | SA | |||||
| C1 | 0.5x MIC | 0.5x MIC | ||||
| C2 | 0.125x MIC | 0.25x MIC | ||||
| C3 | 0.0625x MIC | 0.25x MIC | ||||
| Percent (%) reduction of biofilm PRODUCTION | ||||||
| Mean | Mean | Mean | SD | SD | SD | |
| CONTROL | MIC | 0.50 X MIC | CONTROL | MIC | 0.50 X MIC | |
| SA-O1 | 91 | 74 | 54 | 3.21 | 2.95 | 2.9 |
| SA-O2 | 95 | 88 | 63 | 5.21 | 3.45 | 2.56 |
| SA-O3 | 91 | 69 | 42 | 3.14 | 4.58 | 2.99 |
| PA-O1 | 93 | 87 | 55 | 4.12 | 3.54 | 3.01 |
| PA-O2 | 94 | 88 | 60 | 5.01 | 2.98 | 1.98 |
| PA-O3 | 96 | 79 | 64 | 3.54 | 4.32 | 3.74 |
Conclusions
FTIR and GC-MS studies reveal that Ziziphus spina-christi, Calligonum comosum, and Ruta graveolens contain bioactive compounds that may treat skin rashes. GC-MS quantifies compounds, whereas FTIR functional group identification identifies phenolic molecules, flavonoids, and terpenoids. P. aeruginosa proliferated rapidly in the absence of extract, while 0.0625x N1, 0.5x N2, and 0.25x N3 suppressed growth for 4-5 hours, indicating bacteriostatic and bactericidal effects at lower doses and higher concentrations. S. aureus growth plateaus around 0.125x N2 and 0.5x N3. Despite mixed effects, no inhibition, or stationary phase, N1 has no effect at these concentrations. The result of a biofilm inhibition experiment. S. aureus was suppressed by 94% and P. aeruginosa by 83% at the concentration-dependent MIC of N2. N2 changed very little at 0.5xMIC. The N2 extract lowers S aureus and P seruginosa by 91%, 85%, 65%, and 61%, respectively, at MIC and 0.5xMIC. However, N1’s 2xMIC and MIC against P. aeruginosa and S. aureus decreased by 91%, 87%, and 72%, 59%, respectively. This study may illuminate Calligonum comosum, Ziziphus spina-christi, and Ruta graveolens’ bioactive compounds, molecular mechanisms, and therapeutic effects on human health, and clarified the plant’s bioactivities and expanded medicinal applications.
Acknowledgement
It is with great pleasure that the authors would like to express their gratitude to the Department of Chemistry, Department of Medical Microbiology and Molecular Microbiology and Infectious Diseases Research Unit, University of Tabuk, K. S. A.
Funding Sources
The author(s) received no financial support for the research, authorship, and/or publication of this article.
Conflict of Interest
The author(s) do not have any conflict of interest.
Data Availability Statement
This statement does not apply to this article.
Ethics Statement
This research did not involve human participants, animal subjects, or any material that requires ethical approval.
References
- Chouikh, A. “Phytochemical study, nutritive value, antioxidant and anti-inflammatory activities of phenolic extracts from desert plant Calligonum comosum L’Hér.”. Algerian Journal of Biosciences. 2020. 1(2), 068–075. https://doi.org/10.57056/ajb.v1i2.29
CrossRef - Chouikh, A. and Rebiai, A. “The influence of extraction method on the composition and analgesic activity of Calligonum comosum phenolic extracts”. Ovidius University Annals of Chemistry. 2020. Vol.31 (1). 33 – 37. https://doi.org/10.2478/auoc-2020-0007
CrossRef - Abdo, W., Hirata, A., Shukry, Mostafa, Kamal, T., Abdel-sattar, E., Mahrous, E., and Yanai, T. “Calligonum comosum extract inhibits diethylnitrosamine-induced hepatocarcinogenesis in rats.”. Oncology Letters. 2015. Vol.10 (2). 716-722. https://doi.org/10.3892/ol.2015.3313
CrossRef - Sivakumar, N., Sherwani, Neelam, and Mahrouqi, Mohamed Abdullah Al. “Evaluation of Antioxidant, Antibiofilm, Cytotoxic and AntimicrobialActivities of Calligonum Comosum”. Zeitschrift für Naturforschung C. 62c, 656-660. 2007. https://doi.org/10.1515/znc-2007-9-1005
CrossRef - Hammami, Riadh, Farhat, Imen, Zouhir, A., and Fedhila, S. “Detection and extraction of anti-Listerial compounds from Calligonum comosum, a medicinal plant from arid regions of Tunisia.”. African Journal of Traditional Complementary and Alternative Medicines. 2012 Dec 31;10(2):386. https://pmc.ncbi.nlm.nih.gov/articles/PMC3746587/
- Phondani, P.C., Bhatt, A., Elsarrag, E., Horr, Y.A., Ethnobotanical magnitude towards sustainable utilization of wild foliage in Arabian Desert. J. Tradit. Complement. Med. 2016. 6 (3), 209–218. https://doi.org/10.1016/j.jtcme.2015.03.003.
CrossRef - Szopa, A., Ekiert, H., Szewczyk, A., and Fugas, Elżbieta. “Production of bioactive phenolic acids and furanocoumarins in in vitro cultures of Ruta graveolens L. and Ruta graveolens ssp. divaricata (Tenore) Gams. under different light conditions”. Plant Cell Tissue and Organ Culture. 2012. Volume 110, pages 329–336. https://doi.org/10.1007/s11240-012-0154-5
CrossRef - Ekiert, H. and Gomółka, E.”Effect of light on contents of coumarin compounds in shoots of Ruta graveolens L. cultivated in vitro”. Acta Societatis Botanicorum Poloniae. 2014. https://doi.org/10.5586/ASBP.1999.026
CrossRef - Aremu, Adeyemi O. and Pendota, S.C.. “Medicinal Plants for Mitigating Pain and Inflammatory-Related Conditions: An Appraisal of Ethnobotanical Uses and Patterns in South Africa”. Frontiers Media. 2021. Volume 12. https://doi.org/10.3389/fphar.2021.758583
CrossRef - Szewczyk, A., Marino, A., Molinari, Jessica, Ekiert, H., and Miceli, N.. “Phytochemical Characterization, and Antioxidant and Antimicrobial Properties of Agitated Cultures of Three Rue Species: Ruta chalepensis, Ruta corsica, and Ruta graveolens”. Antioxidants. 2022. 11(3), 592;https://doi.org/10.3390/antiox11030592
CrossRef - Karar, M., Quiet, Laura, Rezk, Ahmed, Jaiswal, Rakesh, Rehders, Maren, Ullrich, M., Brix, K., and Kuhnert, N.. “Phenolic Profile and In Vitro Assessment of Cytotoxicity and Antibacterial Activity of Ziziphus spina-christi Leaf Extracts”. Medicinal Chemistry. 2016. , 6:3 . https://doi.org/10.4172/2161-0444.1000339
CrossRef - El-Shahir, A., El-Wakil, D., Latef, A. A. Abdel, and Youssef, N.. “Bioactive Compounds and Antifungal Activity of Leaves and Fruits Methanolic Extracts of Ziziphus spina-christi L.”. Plants. 2022. 11(6), 746;https://doi.org/10.3390/plants11060746
CrossRef - Asgarpanah, J. and Haghighat, Elaheh. “Phytochemistry and pharmacologic properties of Ziziphus spina christi (L.) Willd.”. African Journal of Pharmacy and Pharmacology. 2012. 6(31) https://doi.org/10.5897/ajpp12.509
CrossRef - Abdulrahman, M., Zakariya, A. M., Hama, H., Hamad, S., Al-Rawi, Sawsan S., Bradosty, Sarwan W., and Ibrahim, A.. “Ethnopharmacology, Biological Evaluation, and Chemical Composition of Ziziphus spina-christi (L.) Desf.: A Review”. Advances in pharmacological and pharmaceutical sciences. 2022. 29: 4495688. https://doi.org/10.1155/2022/4495688
CrossRef - Souheila NAGHMOUCHI1, Moodi ALSUBEIE. Biochemical profile, antioxidant capacity and allelopathic effects from five Ziziphyus spina-christi (L.) provenances growing wild in Saudi Arabia. Notulae Botanicae Horti Agrobotanici Cluj-Napoca. 2020. 48(3):1600-1612 DOI:10.15835/nbha48312025
CrossRef - Rialdi, Azzahra Putri, Prangdimurti, E., and Saraswati, S. “Effect of Different Solvent on The Antioxidant Capacity of Bidara Leaves Extract (Ziziphus Spina-Christi)”. Devotion Journal of Community Service. 2023. 4(6):1222-1233.https://doi.org/10.59188/devotion.v4i6.483
CrossRef - Hussain, M. A., Nathar, V. N., and Mushtaq, Roohi. “In vitro plant regeneration and metabolite profiling of an aromatic medicinal plant Ruta graveolens L. by using GC-MS”. Current Botany. 2022. Vol.13. https://doi.org/10.25081/cb.2022.v13.6856
CrossRef - Zubair, M.; Fatima, F.; Rahman, S.; Alrasheed, T.; Alatawy, R.;Mesaik, M.A. Disruption of Biofilm Formation by Dead Sea Soil Extracts: A Novel Approach Against Diabetic Foot Wound Isolates. Microbiol. Res.2024(a), 15, 2535–2554.
CrossRef - Zubair M, Husain FM, Al-Amri M, Hasan I, Hassan I, Albalawi T, Fatima F, Khan A, Arshad M, Alam P, Ahmad N, Alatawy R, Begum S, Mir R, Alshadfan H, Ansari AA, Al-Anazi ABAA. In vitro inhibition of biofilm and virulence factor production in azole-resistant strains of Candida albicans isolated from diabetic foot by Artemisia vulgaris stabilized tin (IV) oxide nanoparticles. Front Cell Infect Microbiol. 2024 (b) 25;13:1322778.
CrossRef
- M. Dev and M. Mukadam, “Functional group profiling of medicinal plants using FTIR spectroscopy,” World Journal of Biology Pharmacy and Health Sciences, 2025, 21(01), 243-249. https://doi.org/10.30574/wjbphs.2025.21.1.0039
CrossRef - L. Nahar, H. R. ElSeedi, S. A. M. Khalifa, M. Mohammadhosseini, and S. D. Sarker, “Ruta essential oils: Composition and bioactivities, Molecules.2021, 26(16), 4766;https://doi.org/10.3390/molecules26164766
CrossRef - Odeh, Imad M. A., Abu-Lafi, S., and Al-Najjar, I. “Determination of unifloral honey volatiles from Centaurea iberica and Zizyphus spinachristi by solid-phase microextraction and gas chromatography-mass spectrometry”. Acta Chromatographica. 2014. https://doi.org/10.1556/ACHROM.26.2014.3.7
CrossRef
Second Review by: Dr. Jewish Norwa
Final Approval by: Dr. Harja Maria


![]()


