Development and Validation of UV Spectrophotometric Techniques Using Zero-order, Derivative, and AUC Approaches to Determine Dapagliflozin in Plasma
 , Akhila C1, Fayaz Basha S1, Siva Sanker Reddy L1* , Shirisha K1, Akash Reddy B1, Varshitha T1, Chamundeshwari B1, Kumaraja J2 and Meena D3
1Department of Pharmaceutical Analysis, Santhiram College of Pharmacy, Nandyal, Andhra Pradesh, India
2Department of Pharmaceutical Analysis, Mother Teresa Pharmacy College, Sathupalli, Telangana, India
3Department of Pharmaceutical Analysis, Seven Hills College of Pharmacy, Tirupathi, Andra Pradesh, India.
Corresponding Author E-mail:shiva_s_rl@yahoo.co.in
DOI : http://dx.doi.org/10.13005/ojc/420118
Download this article as:
![]()
Objective: To develop and validate a novel, sensitive, and precise UV spectrophotometric method for quantifying dapagliflozin in plasma. Method: Four UV spectroscopic approaches zero-order (Method-A), first-order derivative (Method-B), second-order derivative (Method-C) and AUC were employed by utilizing a protein precipitation technique, with distilled water selected as the optimal solvent. Results: The linearity range to all four methods is 5-25ug/ml. The λmax and r2 for all methods were, Method A (zero-order, λmax = 278 nm, r² = 0.996), Method B (first-order derivative, λmax = 278 nm, r² = 0.9963), Method C (second-order derivative, λmax = 239 nm, r² = 0.9951), and Method D (area under the curve (AUC), λmax = 268–288 nm, r² = 0.9945). The method demonstrated excellent precision, robustness (% RSD < 2), and recovery rates ranging from 98% to 102%, including quantification limits (LOQ) and detection limits (LOD) were established. Conclusion: All four validated methods met ICH criteria, confirming the method’s suitability for routine quality control and bioanalytical analysis of dapagliflozin in both pure and pharmaceutical dosage forms.
KEYWORDS:Dapagliflozin; Daparyl 10; Plasma; Spectrophotometric Analysis; Validation
Introduction
Dapagliflozin is a white to off-white crystalline powder, the medication dissolves in solvents such methanol, ethanol, dimethyl sulfoxide (DMSO), and dimethylformamide (DMF). A reversible, highly specific oral inhibitor of the human sodium-glucose co-transporter 2 (SGLT2), a crucial protein that the kidneys use to reabsorb glucose. Dapagliflozin efficiently reduces blood sugar levels in individuals with type 2 diabetes mellitus by blocking SGLT2, which increases glucose excretion and inhibits glucose reabsorption.
Despite the fact that its pharmacological characteristics have been thoroughly investigated, especially by LC-MS analysis of biological fluids such as human plasma, no UV-spectrophotometric technique for bulk quantification has been published.
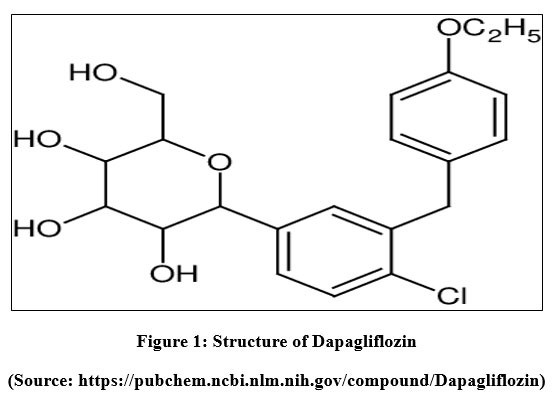 |
Figure 1: Structure of Dapagliflozin Click here to View Figure |
(Source: https://pubchem.ncbi.nlm.nih.gov/compound/Dapagliflozin)
Materials and Methods
Materials
A gift sample of dapagliflozin API (99.9% purity) was acquired from JLS Laboratories Pvt. Ltd and all the solvents purchased were analytical grade and used shimadzu double beam UV spectrophotometer-UV-1800 model (Serial number-A11635581266).
Method Validation
Standard Stock Solution (1000 µg/ml) preparation
Weighed a 10 mg sample of pure dapagliflozin transferred into a dry, clean 10 ml volumetric flask, dissolved in a small volume of distilled water, and the final volume was adjusted to 10 ml, resulting in a concentration of 1000 µg/ml.
General Procedure for Preparation of Plasma Samples
A solution of dapagliflozin was added to a 1.0 ml aliquot of the plasma that had been placed into a vortex tube for one minute, the solution was vortexed for another 30 seconds until a precipitate developed after adding 1.0 ml of methanol to precipitate the proteins. The mixture was centrifuged for 10 minutes at 4°C at 5000 rpm. Following centrifugation, the precipitate was kept undisturbed by carefully collecting the supernatant, then the absorbance of the solution was analysed by UV Spectroscopy.
Linearity
Zero-Order Spectroscopy
Measured volumes of the plasma sample solution were moved among several 10 mL volumetric flasks. After that, distilled water was added to each flask until it reached the 10 mL threshold, resulting in dapagliflozin concentrations ranging from 5 to 25 µg/ml. The generated solutions absorbance values were analysed using a UV-Vis spectrophotometer at wavelength 278nm with distilled water serving as the blank. Calibration curves could be created by plotting concentration on the X-axis and corresponding absorbance on the Y-axis.
First order and second order derivative spectroscopy
The instrument’s built-in software was used to convert the dapagliflozin zero-order spectrum into its first-order and second-order derivative spectra. The linearity absorbance values of method-A was measured at 239 nm and the linearity absorbance values of Method-B was measured at 278 nm.
Area under curve
The dapagliflozin zero-order spectrum, which was acquired using the previously mentioned approach, was converted into its area under curve using the instrument’s built-in software. The wavelength range was discovered between 268-288 nm. Plotting absorbance vs concentration for each approach yielded a calibration curve.
Precision
At a concentration of 15 µg/ml, precision was evaluated at 278nm for Method-A, 278 nm for Method-B, 239 nm for Method-C and 268-288nm wavelength range for Method-D and percentage relative standard deviation was computed.
Accuracy
Accuracy was carried out by adding sample solution at 50%, 100% and 150% level to the 15 µg/ml standard solution, and the percentage relative standard deviation (RSD) was calculated.
Assay of Dapagliflozin tablets
Ten tablets were weighed, determined the average weight of the tablets and weighed the powdered tablet equalent to 10 mg of dapagliflozin, it was put into a 10 ml volumetric flask, added few ml of water, sonicated and bring the final volume down to 10 ml by adding water.
Results and discussion
For the analysis of dapagliflozin, four novel techniques have been created. The absorption maxima for methods A, B, C and D are 278 nm, 278 nm, 239 nm, and 268-288 nm respectively.
Zero order spectroscopy
Dapagliflozin’s absorption spectrum has a λmax at 278 nm. Dapagliflozin conforms to Beer-Lambert’s law for all methods within the 5–25 μg/ml concentration range (Table 1). The equations for linear regression at zero order were determined to be y = 0.044x – 0.148 (R2 = 0.996). All four methods’ precision and accuracy studies’ percentage RSD was tallied and determined to be less than 2, demonstrating the methods’ were accurate and precise.
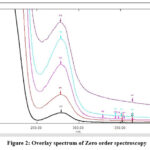 |
Figure 2: Overlay spectrum of Zero order spectroscopy Click here to View Figure |
First order derivative spectroscopy
Dapagliflozin’s absorption spectrum has a λmax at 278nm. The equations for linear regression at first order were determined to be y = -0.221x + 0.0769 (R2 = 0.9963). The precision percentage RSD was calculated and found to be less than 2, demonstrating that the method was accurate and precise.
Second order derivative spectroscopy
Dapagliflozin’s absorption spectrum reveals a λmax at 239nm. Regression value was determined as 0.9973, linear regression equations for second order, which are y = -0.001x – 0.001. The precision percentage RSD was calculated and found to be less than 2, demonstrating the method was accurate and precise.
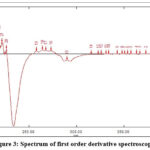 |
Figure 3: Spectrum of first order derivative spectroscopy Click here to View Figure |
Area under curve (AUC)
Dapagliflozin’s absorption spectra was found to be in the 268–288nm range. The linear regression equations were determined to be y =.0.1251x – 0.3744 (R2 = 0.9947). The precision and accuracy of the procedures are demonstrated by the % RSD values, which was less than 2.
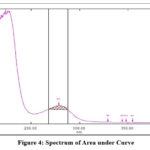 |
Figure 4: Spectrum of Area under Curve Click here to View Figure |
Table 1: Results of Linearity
| Conc.
(µg/ml) |
Absorbance Values of Method-A | Absorbance Values of Method-B | Absorbance Values of Method-C | Absorbance Values of Method-D |
| 5 | 0.094 | -0.042 | 0.058 | 0.299 |
| 10 | 0.261 | -0.129 | 0.157 | 0.762 |
| 15 | 0.517 | -0.254 | 0.314 | 1.555 |
| 20 | 0.742 | -0.376 | 0.462 | 2.176 |
| 25 | 0.958 | -0.470 | 0.577 | 2.720 |
Note: Coefficient of determination of all four methods were within the limits.
Table 2: Results of Intraday precision
| Conc.
(µg/ml) |
Absorbance Values of Method-A | Absorbance Values of
Method-B |
Absorbance Values of Method-C | Absorbance
Values of Method-D |
|
15 µg/ml
|
0.515 | -0.255 | 0.316 | 1.505 |
| 0.517 | -0.257 | 0.3181 | 1.499 | |
| 0.521 | -0.256 | 0.3174 | 1.511 | |
| 0.524 | -0.260 | 0.3222 | 1.544 | |
| 0.515 | -0.262 | 0.3246 | 1.546 | |
| 0.517 | -0.262 | 0.3240 | 1.548 | |
| Average | 0.518166 | -0.25866 | 0.3203 | 1.5255 |
| SD | 0.003600 | 0.003076 | 0.0036 | 0.02281 |
| %Rsd | 0.6949 | 1.1894 | 1.1467 | 1.4952 |
| Limits | % RSD: <2.0 | % RSD: <2.0 | % RSD: <2.0 | % RSD: <2.0 |
Note: Intraday Precision % RSD to all four methods were less than 2.
Table 3: Results of Interday precision
| Conc.
(µg/ml) |
Absorbance Values of Method-A | Absorbance Values of Method-B | Absorbance Values of Method-C | Absorbance
Values of Method-D |
|
15
|
0.521 | -0.253 | 0.3127 | 1.46 |
| 0.524 | -0.254 | 0.3140 | 1.492 | |
| 0.523 | -0.255 | 0.3160 | 1.505 | |
| 0.531 | -0.254 | 0.3140 | 1.492 | |
| 0.535 | -0.257 | 0.3181 | 1.499 | |
| 0.536 | -0.253 | 0.3120 | 1.46 | |
| Average | 0.52833 | -0.25433 | 0.314466 | 1.48466 |
| SD | 0.0065 | 0.00150 | 0.002244 | 0.019714 |
| %Rsd | 1.2305 | -0.5919 | 0.7138 | 1.32788 |
| Limits | % RSD: <2.0 | % RSD: <2.0 | % RSD: <2.0 | % RSD: <2.0 |
Note: Interday Precision % RSD to all four methods were less than 2.
Table 4: Results of LOD & LOQ
| S.No | Method-A | Method-B | Method-C | Method-D | ||||
| LOD
µg/ml |
LOQ
µg/ml |
LOD
µg/ml |
LOQ
µg/ml |
LOD
µg/ml |
LOQ
µg/ml |
LOD
µg/ml |
LOQ
µg/ml |
|
| 1 | 0.48759 | 1.4774 | 0.51996 | 1.5747 | 0.2247 | 0.6847 | 0.2747 | 0.8327 |
Note: LOD & LOQ values were 1:3 range.
Table 5: Assay results
| Label claim
(mg) |
Weight found | % Assay | |||||||
| Method A | Method B | Method C | Method D | Method A | Method B | Method C | Method D | ||
| 10mg | 10.077mg | 10.1574mg | 10.1910mg | 10.1256mg | 100.77% | 101.54% | 101.9% | 101.25% | |
Discussion
This study presents the development and validation of a new analytical method for the quantification of dapagliflozin in bulk and pharmaceutical formulations using multi-technique UV spectrophotometry, including zero-order, first-order, second-order derivative, and area under the curve (AUC) methods. The methods demonstrated precision, and robustness meeting the validation criteria outlined in the ICH Q2 (R1) guidelines. Recovery studies confirmed that the method is free from interference caused by excipients present in the formulation. Therefore, the methods have potential, to be utilized in future quality control analyses for dapagliflozin formulations.
Acknowledgement
The authors are thankful to principal and management of Santhiram College of Pharmacy for the utilization of facilities.
Funding Sources
The author(s) received no financial support for the research, authorship, and/or publication of this article.
Conflict of Interest
The author(s) do not have any conflict of interest.
Data Availability Statement
This statement does not apply to this article.
Ethics Statement
This research did not involve human participants, animal subjects, or any material that requires ethical approval.
References
- John Wiley, and Sons.; Combined antidiabetic benefits of exenatide and dapagliflozin in diabetic mice., 2014, 16, 376-380.
CrossRef - Manasa, S.; Dhanalakshmi, K.; Nagarjuna Reddy, G.; Kavitha, B.; Method Development and Validation of Dapagliflozin API by UV Spectroscopy., Int J Pharm Sci Rev Res. 2014, 27, 270-272.
CrossRef - Gajanan Vithoba, M.; Krishna, Radheshyam, G.; Tryambakrao, Hemke, A.; Estimation of Dapagliflozin from its Tablet Formulation by UV-Spectrophotometry. Methods. 2017, 8, 102-107.
CrossRef - Shilpi P.; Development and Validation of UV-Spectroscopy Method for the Determination of Dapagliflozin, 2020, 9, 128-133.
- Sufiyan, Ahmad.; Rageeb, Usman, Md.; Tanvir, S.; Rashid, A.; Development and validation of uv spectrophotometric method for estimation of saxagliptin and dapagliflozin in bulk and dosage form. 2021, 12, 2185-2192.
- Saipranavi, V.; Vaishnavi, P.; Saipriya, N.; Sowmaya, B.; Neelima, K.; Estimation Method for Dapagliflozin in Bulk and Marketed Dosage Form: Development and Validation by UV-Spectroscopy. J. Pharm. Phytopharm. Res. 2023, 13, 1-6.
CrossRef - Lohiya, G. V.; Mahima, Jadhav.; Rohini, G.; Shivnechari, P.; Birajdar, M. J.; Kulkarni, Y. P.; Satpute, K. L.; RP HPLC Method Development and Validation on Dapagliflozin. J. Pharm. Sci. 2024, 2, 1766-1779.
- Kutar, C.; Patel, P.; Spectrophotometric Estimation of Dapagliflozin and Vildagliptin in Pharmaceutical Dosage form by First Order Derivative Method. IJBPAS. 2024, 13(3), 1212-1220.
CrossRef - Shivani, S.; Swamy, M., , Anil Kumar, S. M.;, Lavanya, Patil, M.; Development and Validation of UV Spectrophotometric method for Simultaneous Estimation of Dapagliflozin and Teneligliptin in bulk Drug and Pharmaceutical Formulation. JETIR. 2024, 11(11), 539-548.
Accepted on: 07 Sep 2025
Second Review by: Dr. Salih Hadi Kadhim
Final Approval by: Dr. Tawkir Sheikh


ISSN Online: 2231-5039

![]()


