Colorimetric Strip Based on Anthocyanin Extracts from Alugbati (Basella alba L.) Fruits for Monitoring Shrimp Freshness
 and Jennica Villaviza Jove*
Natural and Applied Sciences Department, College of Arts and Sciences, Nueva Ecija University of Science and Technology, Cabanatuan City, Philippines,
Corresponding Author E-mail:jennicavjove0320@ineust.ph.education
DOI : http://dx.doi.org/10.13005/ojc/420125
Download this article as:
![]()
The rising demand for smart packaging drives interest in anthocyanins which changes colors depending on different conditions. Anthocyanins were extracted from Alugbati fruits using acidified ethanol, yielding a total monomeric anthocyanin content (TMAC) of 223.59 mg/L. The extract was incorporated into chitosan/polyvinyl alcohol films, and its interaction with the polymer matrix was evaluated via FTIR spectroscopy. The developed films were tested for sensitivity to pH conditions and ammonia vapor. Results indicated that C/PVA10 film demonstrated color change from reddish-pink to yellow in alkaline conditions. Exposure to ammonia vapor caused notable color transitions from purple (1 hr) to reddish-brown (4 hrs) and pale brown (7 hrs), with corresponding increases in SRGB% values, indicating progressive shrimp spoilage. FTIR analysis confirmed interactions between the anthocyanin and chitosan matrix. The findings suggest that colorimetric film from anthocyanin extracts of Alugbati fruits have significant potential as freshness indicators for shrimp packaging
KEYWORDS:Anthocyanin-based Film; Alugbati extract; Colorimetric indicator; Intelligent packaging; Shrimp freshness monitoring
Introduction
Shrimp is highly perishable because of its elevated moisture and protein levels, with refrigerated shelf life generally limited to 4–6 days after harvest. Quality and sensory deterioration occurs as a result of chemical, enzymatic, and microbial processes. Microbial degradation of nitrogen-containing compounds in shrimp during storage results in the accumulation of trimethylamine, dimethylamine, and ammonia, which are quantified as total volatile basic nitrogen (TVB-N)1. Lately, numerous researchers in intelligent packaging gave light on colorimetric indicator films due to their ability to monitor shelf life, food safety, and product quality through visible responses to changes in the package environment2,3.
Alugbati, (Basella alba L.), is known in the Philippines as Alugbati and is widely cultivated in Asia. It is believed to exhibit a wide range of biological functions4. Originating in India and Indonesia, Alugbati naturally grows in tropical Asia and tropical Africa. Alugbati has fruits that are fleshy, stalkless, spherical in shape, and purple in color. The natural color pigment anthocyanin is present in its fruits5. A study by Chaurasiya (2021)5, its fruit extract functions as a natural indicator in acid–base titration, as it exhibits a distinct color transition when the pH changes. The extract initially appears violet and has a pH of approximately 4.9.
Anthocyanins are flavonoid-derived plant pigments that impart orange, red, purple, and blue hues to a wide range of fruits and vegetables6. The potential of natural plant pigments as visual indicator for food freshness has been demonstrated by different studies6,7. For a natural colorant to serve effectively as an indicator, it must exhibit stable color changes in response to acidic and basic conditions7.
The aim of this research was to develop a colorimetric strip using Chitosan/PVA (C/PVA) and anthocyanin extracts from Alugbati fruits. The study involves the development of films with different ratios of Alugbati fruit extract that are sensitive to different pH The potential use of Alugbati fruits as a colorimetric strip to monitor shrimp freshness was also investigated.
Materials and Methods
Extraction of Anthocyanin from Alugbati Fruits
Alugbati fruit extraction approach was designed from previously reported pigment isolation techniques by Agunos et. al. (2020)8. Approximately 100 g of deseeded fruit pulp of Alugbati was weighed, and 500 mL of a 70% ethanol solution (1:5) was added. Addition of HCl (1mol/L) was done to adjust the pH of the sample to 2.08. Maceration was carried out under chilled conditions (5 °C) for 24 hours. The extract was manually squeezed through a fine cloth to remove residue and then centrifuged at 2000 rpm for 10 minutes9. The top layer is filtered through Whatman paper No. 1. Amber bottles were used to protect the supernatant from potential photooxidation. Rotary evaporator was used to concentrate the resulting filtrate in slightly elevated temperature (40°C) for one hour8. Finally, the concentrated extract was kept in a cold (4°C), dark area prior to its analysis.
Characterization of extracts
Color change in acidic and basic solution
Color change tests for anthocyanins were conducted to help determine the presence of anthocyanins in the sample. The method was followed from the study of Agunos et. al. (2020) with some modifications8. To evaluate the color response of the extract under acidic conditions, 1 mL of HCl (1mol/L) was mixed with 2 mL of the extract7. For basic conditions, 2 drops of NaOH (1mol/L) were released to a separate 2 mL aliquot of the extract8. The color change in both acid and base conditions was noted.
Total Monomeric Anthocyanin content
The samples were prepared by incorporating aliquots of the Alugbati extract into 0.025 mol/L KCl and 0.4 mol/L Sodium Acetate buffer solutions at pH 1.0 and 4.5 respectively10. The absorbance of each sample was measured at 520 nm and 700 nm with a Shimadzu UV-1900i UV–Vis spectrophotometer10. Using the formula below, the TMA was computed9:
Where Absorbance was being calculated as A = [(A520-A700)pH1.0 – (A520 – A700)pH4.5]”.11 “MW referred to the molecular weight of anthocyanins, which was 449.2 g/mol, DF was the dilution factor, ε was the molar extinction coefficient of anthocyanins at 26,900 L/mol·cm, and L was the path length of the cuvette in centimeters1,9.
Development and Characterization of Colorimetric Films
Polyvinyl alcohol (PVA) combined with chitosan forms the structural matrix of the anthocyanin-based film. PVA was prepared by dissolving 10 g of polymer powder in 100 mL of distilled water under continuous stirring at 70 °C, whereas chitosan was prepared by dissolving 1 g of chitosan powder in 100 mL of 1% acetic acid with continuous stirring at room temperature until it was fully dissolved8,9. The matrix was formed by mixing chitosan and PVA in a 7:3 ratio (v/v), followed by the addition of anthocyanin extract into the mixture at 10% concentration (C/PVA10). To further support cross-linking of the matrix, 1.5% solution of sodium tripolyphosphate (Na₅P₃O₁₀) was incorporated at 0.1% (w/v) based on the total volume of the mixture8,9. A 90-mm petri dish with 15 mL of the previously cast mixture was placed in a moderate temperature (35°C) for 72 hours before peeling them off from the glass8. The films were stored in sealed bags at 4°C, away from the light before it was used and analyzed.
Sensitivity of C/PVA10 Film to Varying pH Condition
The films were cut into sections of 1.5 cm x 1 cm12. Buffer solutions with pH levels of 2, 4, 6, 8, 10, and 12 were used to soak the films for 2 minutes12,13. The resulting color change was then compared9.This test was done to determine if color changes would appear in different pH range.
Sensitivity of C/PVA10 Film to Ammonia
Different methods were used to assess the sensitivity of the film to volatile amines8,12. Square-shaped, 1 × 1-cm colorimetric films were hung in a 250 mL Erlenmeyer flask, positioned 1 cm above a 20 mL of 15-mM ammonia solution at 25°C for a duration of 7 hours8,9.The flask was placed in a lightbox and captured using Canon EOS3000D (18M Megapixel), the camera was set with flash off, ISO 100 and white balance adjusted for white fluorescent lighting8. Observation of color change in colorimetric films were done every hour. Measurement of R, G, and B values were done using ImageJ software, followed by subsequent calculation of percentage change in colors using the formula below9.

Where;
R = red, G = green, and B = blue; Ri, Gi, and Bi = the R, G, and B values before the ammonia test; Rf, Gf, and Bf = the R, G, and B values of the C/PVA10 film after the ammonia test was conducted9.
FTIR Analysis of C/PVA10 Film
The C/PVA0 control film and the colorimetric C/PVA10 film were analyzed using a SHIMADZU IRPrestige-21 spectrophotometer at a spectral range of 500–4000 cm− 1 to investigate and confirm if chemical interactions exist between the films’ components8,9,12.
Shrimp Freshness Monitoring
The C/PVA film measuring 1.5 cm2 was secured beneath the cover of a transparent vessel, positioned above 10 g of shrimp without physical contact12.The film was allowed to be exposed with the volatile compounds released from the shrimp during storage. The prepared samples were then stored separately at room temperature (25⁰C) for 5 hours and in a chilled condition (5⁰C) for five days. Samples in ambient temperature was observed hourly, while samples under chilled conditions were observed daily9.
Results and Discussion
Different observations on the characteristics of the anthocyanin extracts and C/PVA10 films were recorded.
pH Sensitivity of Anthocyanin Extract from Alugbati Fruit
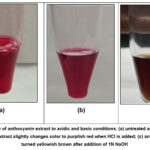 |
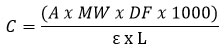
Figure 1: Sensitivity of anthocyanin extract to acidic and basic conditions. (a) untreated anthocyanin extract; (b) anthocyanin extract slightly changes color to purplish red when HCl is added; |
Figure 1 shows the comparison in colors from the untreated (Figure 1a) and treated (Figure 1b and 1c) anthocyanin extract. Color slightly changed from reddish to purplish red (Figure 1b), while the color transitioned to a yellowish-brown upon the addition of NaOH (Figure 1c). This was because anthocyanin transformed into different molecular forms14. In acidic conditions, it exists as a flavylium cation and converts to a carbinol base. At neutral pH (6–8), it forms an anhydrous quinoid structure, giving a purple color, while in alkaline conditions, it transforms into a chalcone, resulting in a yellow hue9.
Total Monomeric Anthocyanin content of Alugbati extracts
The total monomeric anthocyanin content (TMAC) in the plant samples was quantified using the pH-differential method and expressed as mg/L of cyanidin-3-glucoside, the predominant monomeric anthocyanin in nature15,16,17. In this study, the concentration of anthocyanins was found to be 223.59 mg/L, which could be attributed to the use of 70% ethanol and HCl as the extraction solvent. Other studies revealed that the total anthocyanin content in Alugbati fruit with pure methanol measured an anthocyanin concentration of 160.81 mg/L18. These values show the effectivity of ethanol than methanol in the extraction of anthocyanins from Alugbati.
Sensitivity C/PVA10 films to different pH conditions
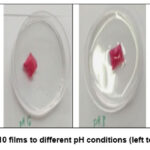 |
Figure 2: Sensitivity C/PVA10 films to different pH conditions (left to right: pH 2, 4, 6, 8, 10, 12) Click here to View Figure |
C/PVA10 film exhibited pronounced and rapid color changes, displaying a noticeable shift in just a few seconds. As illustrated in Figure 2, when immersed in a pH 12 solution, the film initially presented a bluish-purple color. However, prolonged exposure to pH solutions caused the film to dissolve. In this study, the extract initially appeared purple at pH 12; however, continuous increases in pH led to the breakdown of the anthocyanin structure, resulting in the formation of a yellow chalcone. Figure 2 demonstrates the potential of the developed film for monitoring shrimp freshness, as indicated by color changes from red to yellow. Fresh shrimp exhibited an initial pH of approximately 7.4, which gradually increased as their quality deteriorated during storage9.
Film Sensitivity in Ammonia and Water Vapor
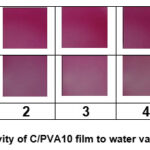 |
Figure 3: Color Change and Sensitivity of C/PVA10 film to water vapor and ammonia from 0 to 7 hours Click here to View Figure |
Figure 3 illustrated the color transition of the films over a time from zero to seven (7) hours. The C/PVA10 film changed color from reddish-pink to brownish-purple. Within the first hour of exposure to ammonia, the C/PVA10 film began to shift to a purple color, indicating a pH level higher than 10. This observation aligned with the properties of the ammonia solution used, which had a pH greater than 10.64. This suggested a significant increase in pH due to exposure to ammonia. After four hours of exposure, the color of the film started to change to a brownish-red, eventually shifting to a much paler brown by the seventh hour. This simulated how sensitive the film was to basic compounds related to shrimp spoilage. Ammonia diffused into the film and created an alkaline environment, which caused the pH-sensitive dye in the film to change color19.
In a study by Agunos et. al. (2020) 8, they examined the effects of exposure to both water vapor and ammonia vapor on a film containing 25% anthocyanin extract. The primary goal of their research was to assess whether the presence of water vapor moist food products, could lead to false-positive results. As illustrated in Figure 3, the results for the C/PVA10 film exposed to water vapor showed no observable color change. This finding confirmed that any color change in the C/PVA10 film was solely attributed to its absorption of ammonia vapor8.
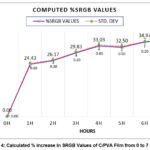 |
Figure 4: Calculated % increase in SRGB Values of C/PVA Film from 0 to 7 hours. Click here to View Figure |
Photographic images of the films were analyzed using ImageJ software, allowing measurement of the RGB values. Significant color change from reddish-pink to purple after 1 hour of exposure to ammonia vapor was displayed by the C/PVA10 film. Figure 4 charts the % increase in SRGB over time, which verifies the colorimetric film’s sensitivity to ammonia vapor17. The SRGB% increase from the first to the seventh hour was 24.43±0.65%, 26.17±0.38%, 29.83±0.37%, 33.03±0.65%, 32.50±0.52%, 34.97±0.26%, and 35.87±0.381%, respectively. The color-change process began with the unstable ammonia (NH3) reacting with the colorimetric film’s free water (H2O) to form NH3·H2O8,9. This compound subsequently underwent hydrolysis, generating NH₄⁺ and OH⁻ ions, with the increase in hydroxide ions responsible for the observed color change due to the rise in pH8,9. The structure of anthocyanin was being modified by this process, and causes it to become chalcone, changing the betacyanin structure to betalamic acid, which leads to color changes9.
The results showed that the colorimetric films exhibited noticeable changes in color after one hour of exposure to ammonia, as both visual observations and calculated SRGB%9. However, the films showed low sensitivity to ammonia, as evidenced by the slow appearance of yellow or brownish-yellow hues even after prolonged exposure. the method used for film preparation significantly influenced the responsiveness of the indicator. For instance, the indicators produced through electrospinning exhibited a quicker color change (within 10 seconds) compared to those prepared via the solvent-casting method, which required 15 to 40 minutes. Despite these limitations, the C/PVA10 film in this study was evidently sensitive and effectively responded to real-time pH changes20.
FTIR Analysis
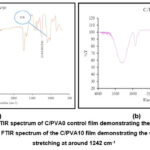 |
Figure 5: FTIR Results (a) FTIR spectrum of C/PVA0 control film demonstrating the peak of the C-N stretching at around 1244 cm-1; (b) FTIR spectrum of the C/PVA10 film demonstrating the smaller peak of the C-N stretching at around 1242 cm-1 |
FTIR analysis was employed to investigate and compare changes in the functional groups of the chitosan/PVA film following the incorporation of anthocyanin extract8. The FTIR spectra for both the Control (Figure 5a) and C/PVA10 films (Figure 5b) exhibited comparable patterns, indicating structural similarities. The results in figure 5a and 5b showed the subtle spectral changes caused by the addition of 10% anthocyanin into the C/PVA polymer matrix, which resulted in reduction in C–N stretching8. This implied that chitosan-anthocyanin were evidently formed when C/PVA engaged into aquaphobic interaction with the Alugbati anthocyanin extract8. Moreover, findings from previous studies21 indicate that anthocyanins are incorporated into the C/PVA matrix primarily through physical interactions, without modifying the chemical structure of the matrix or forming covalent bonds21.
Monitoring Shrimp Freshness
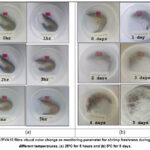 |
Figure 6: C/PVA10 films visual color change as monitoring parameter for shrimp freshness during storage at different temperatures. (a) 25⁰C for 5 hours and (b) 5⁰C for 5 days. |
The visual color changes of the C/PVA10 indicator films in relation to the quality of shrimp during storage was illustrated in Figure 6. The films, along with shrimp packaging, were subjected to two different storage conditions: Room Temperature (25 °C) for 5 hours and Chilled (5 °C) for 5 days. This approach was applied to evaluate the effectiveness of the colorimetric indicators in representing the quality attributes of shrimp22.
In Figure 6a, the C/PVA10 indicator film initially appeared pink. Over the course of 5 hours, it transitioned to pinkish-purple between the 2nd and 4th hours and ultimately turned reddish-brown by the 5th hour. When stored for 5 days (Figure 6b), the C/PVA10 indicator film exhibited a broader range of color changes, starting from pink, then changing to pinkish-purple on day 1, pale red on day 2, pale yellow-orange on days 3 and 4, and finally to grayish-brown by day 5, These changes were readily distinguishable by the naked eye. Cold storage effectively delayed shrimp deterioration, which also resulted in a reduction in the production of volatile compounds and minimized significant color changes in indicator films used to monitor freshness. In contrast, high storage temperatures led to a quicker breakdown of shrimp. The C/PVA10 film appeared pink when detecting fresh shrimp and as spoilage progressed, the film color shifted to purple and ultimately turned yellow under advanced spoilage condition. The C/PVA10 film changed color due to the release of ammonia during the shrimp deterioration process.7 The accumulation of ammonia led to the increase of pH in the surroundings of the film, which caused its change of color as the emission of volatile compounds increases and accelerates shrimp degradation8,9. This analysis demonstrated that the C/PVA10 indicator film was capable of effectively and in real-time monitoring the freshness of shrimp. Consequently, this rapid deterioration caused noticeable color changes in colorimetric indicator films1. Other studies reported the same color change.
Conclusion
This study successfully developed a colorimetric film by incorporating anthocyanin extracts from Alugbati (Basella alba L.) fruits into the C/PVA matrix, demonstrating its potential as a freshness indicator. The film C/PVA10 demonstrated pronounced sensitivity to pH conditions. The film exhibited its sensitivity through its color change from reddish-pink to purplish-brown upon exposure to ammonia vapor, as confirmed through analysis using ImageJ software. FTIR analysis showed interactions between anthocyanin and the chitosan polymer matrix, suggesting the formation of a chitosan-anthocyanin complex. The developed film proved effective in monitoring shrimp freshness at different storage conditions, reinforcing its potential as an intelligent packaging material. These findings highlighted the promising application of the Alugbati-based colorimetric film for monitoring shrimp freshness. This developed technology can benefit food industries and consumers in monitoring shrimp’s freshness prior to opening of the package to facilitate easy interpretation and feedback.
Acknowledgement
The authors would like to express their sincere gratitude to the Nueva Ecija University of Science and Technology for its continued support of research initiatives and faculty development. We also extend our appreciation to Dr. Danilet Vi M. Mendoza, for her valuable insights and meaningful contributions to this research.
Funding Sources
The authors received no financial support.
Conflict of Interest
The authors declare that there is no conflict of interest regarding the publication of this research.
Data Availability
This treatment does not apply to this article
Ethical Approval
This research did not involve human participants, animal subjects or any material that requires ethical approval
Author Contribution
Author Bernadette Escamilla Victorio was responsible for conceptualization, methodology, investigation, formal analysis, and writing (original draft), while author Jennica Villaviza Jove was responsible for conceptualization, supervision, and writing manuscript (review and editing).
References
- Kaewprachu, P., Jaisan, C., Rawdkuen, S., & Osako, K, Heliyon 2024, 10(11)e31527
CrossRef - Qi Y & Li Y, Polymers (Basel), 2024, 10;16(4), p. 495
CrossRef - Xiaowei, H., Liuzi, D., Zhihua, L., Jin, X., Jiyong, S., Xiaodong, Z., Junjun, Z., Ning, Z., Holmes, M., & Xiaobo, Z, J. Biol. Macromol. 2023, 239, p. 124198
CrossRef - Garza, D. L., Arcilla, R. G., Enriquez, L. D., Tan, M. S., & Noel, M. G, Jordan J. Biol. Sci. 2019, 12, p. 161-165
- Chaurasiya, A., Pal, R. K., Verma, P. K., Katiyar, A., R., & Kumar, N, Journal of Pharmacognosy and Phytochemistry, 2021, 10(2), p. 1201-1207
CrossRef - Oladzadabbasabadi, N., Mohammadi Nafchi, A., Ghasemlou, M., Ariffin, F., Singh, Z., & Al-Hassan, A, Food Packaging and Shelf Life, 2022, 33, p. 100872
CrossRef - Listyarini, A., Sholihah, W., & Imawan, C, IOP Conference Series: Mater. Sci. Eng., 2018, 367, p. 012045
CrossRef - Agunos, R.I.F., Mendoza, D.V.M., & Rivera, M.A.S, Hindawi Int. J. Food Sci., 2020, 1(2020), 1672851
CrossRef - Pramitasari, R., Gunawicahya, L. N., & Anugrah, D. S, Polymers, 2022, 14(19), p. 4142
CrossRef - Lee, Y., Lee, J.K., Kim, J.G., Park, S.H., Kim, Y.E., Park, S.K., Kim, M.S., J Appl Biol Chem, 2020, 63(4), p. 297−303
CrossRef - Wang Y., Zhang C., Dong B., Huang Y., Bao Z., Zhao H., Am. Soc. Hort. Sci., 2018, 143(3), p. 184-193
CrossRef - Santoso, V.R., Pramitasari, R., Anugrah, D.S.B., Polymers, 2023, 15(17), p. 3609
CrossRef - Ma, Y., Luo, S., Xiong, Y., Journal of Food Measurement and Characterization, 2024, 18, p. 10202-10218
CrossRef - Bao Y., Cui H., Tian J., Ding Y., Tian Q., Zhang W., Wang M., Zang Z., Sun X., Li D., Si X, & Li B., Food Control 2022, 131, p. 108441
CrossRef - Khoo, H. E., Azlan, A., Tang, S. T., & Lim, S. M, Food Nut. Res., 2017, 61(1), p. 1361779
CrossRef - Aquino, A., & Morales, D, Food Res., 2020, 5(1), p. 108-113
CrossRef - Alizadeh-Sani, M., Tavassoli, M., Mohammadian, E., Ehsani, A., Khaniki, G.J., Priyadarshi, R., Rhim, J.W., Int J Biol Macromol, 2021, 166, p. 741-750
CrossRef - Mejica, G. F., Unpaprom, Y., Balakrishnan, D., Dussadee, N., Buochareon, S., & Ramaraj, R, Sustainable Energy Technologies and Assessments, 2022, 51, p. 101971
CrossRef - Zhang, J., Zou, X., Zhai, X., Huang, X., Jiang, C., & Holmes, M, Food Chem. 2019, 272, p. 306-312.
CrossRef - Forghani, S., Zeynali, F., Almasi, H., & Hamishehkar, H, Food Chem., 2022, 388, p. 133057
CrossRef - Amaregouda, Y., & Kamanna, K, Food Tech., 2023, 1(5), p. 738-749
CrossRef - Mohammadalinejhad, S., Jensen, I.J., Kurek, M., Lerfall, J., LWT, 2024, 199, p. 116127
CrossRef
Accepted on: 17 Sep 2025
Second Review by: Dr. Sumit Kumar
Final Approval by: Dr. Luigi Campanella


![]()


