Isolation, Characterization and Molecular Docking Studies of Bioactive Phytoconstituents from the Seeds of Mucuna pruriens
 , Md. Sakhaoyat Hossain1, Pair Ahmed1, Md. Nazrul Islam1, Md. Emdad Hossain2
1Department of Chemistry, Chittagong University of Engineering and Technology, Chattogram, Bangladesh.
2Wazed Miah Science Research Center, Jahangirnagar University, Savar, Dhaka, Bangladesh.
Corresponding Author Email: rksutradhar2002@yahoo.com
DOI : http://dx.doi.org/10.13005/ojc/410528
Download this article as:
![]()
Phytochemical investigation on the isopropyl alcohol extract of Mucuna pruriens seeds led to the isolation of four new bioactive natural products (1–4). Their chemical structures were identified by spectroscopic techniques. Compounds 1 showed potential antibacterial activities with inhibition values of 19.3 ± 0.6, 19.0 ± 1.0 and 21.3 ± 0.6 against S. aureus, E. Coli and S. typhimurium respectively. Compound 3 showed significant inhibition value of 26.3 ± 0.6 against B. subtilis. Compound 2 exhibited excellent antifungal activities with inhibition values of 18.7 ± 1.3 against T. harzianum and 10.7 ± 1.5 against A. niger. Antioxidant activities of isolated compounds (1-4) were also performed by DPPH and ABTS radical scavenging methods, compound 3 displayed significant antioxidant activities with IC50 values of 171.46 and 156.02 respectively. Molecular docking studies and ADME prediction of the compounds (1-4) were performed. Compound 2 showed good binding affinity ranging between -7.5 to -9.0 kcal/mol with targeted receptors. It is expected that the compounds have a good drug score and contribute to the development of a more potent drug in the future.
KEYWORDS:ADME prediction; Bioactivity; Mucuna pruriens; Molecular Docking; Phytoconstituents
Introduction
The species Mucuna pruriens, family Fabaceae and genus Mucuna, is one of the important medicinal plants of Bangladesh. Locally, it is known as Alkushi1.Mucuna pruriens possesses a wide range of pharmacological activities against several diseases2-4. Previous studies have reported that Mucuna pruriens exhibits anti-Parkinson5, antidiabetic6, antioxidant7,8, antibacterial activities9, antimicrobial activity10, and antivenomactivity11. The seeds of Mucuna pruriens are rich in diverse phytochemicals, including amino acids and carbohydrates, along with anti-nutritional compounds such as tannins, phytates, saponins, polyphenols12,13 and alkaloids14. To date, no proper chemical investigation has been attempted to evaluate the phytochemical constituents of the seeds of Mucuna pruriens. So, the current investigation aimed to evaluate the chemical composition of the seeds of Mucuna pruriens using chromatography and to screen its isolated metabolites for antioxidant and antimicrobial properties. This paper reported the isolation of four new natural products (1–4) from the seeds of Mucuna pruriens. It was demonstrated that compound 2 a very potent antifungal agent and compound 3 is significant antioxidant agent.
Materials and Methods
Collection of Mucuna pruriens seeds
Seeds of Mucuna pruriens were collected from hillside areas of Chittagong district, located in the southeastern part of Bangladesh, in January 2020 for experimental purposes. The species was taxonomically verified by Prof. Dr. Md. Kamrul Huda of the Dept. of Botany, University of Chittagong, Chittagong, Bangladesh.
Extracting and isolating processes
The seeds of Mucuna pruriens (3 kg) were sequentially extracted with Petroleum ether (3×72 hrs.), Dichloromethane (3×72 hrs.) and Isopropyl alcohol (3×72 hrs.) respectively. On removal of solvent, the Petroleum ether extract gave a deep green mass 55 g, the Dichloromethane extract gave a green mass 62 g and the Isopropyl alcohol extract gave a brown mass 68 g. The isopropyl alcohol extracts (5 g) were chromatographed on a silica gel column, eluted with n-hexane-EtOAc (5:1) to give compound 1 (125 mg), compound 2 (220 mg) and a mixture of mass 3.5 g. Solid mass 3.5 g was rechromatographed on a silica gel column and eluted with n-hexane-EtOAc (2:1) to give compound 3 (150 mg) and compound 4 (240 mg). Four compounds (1-4) were purified by repeated crystallization from solvent system n-hexane-EtOAc (3:1).
Antioxidant Screening
DPPH radical scavenging assay
Antioxidant studies of isolated compounds (1-4) were observed using the DPPH free radical scavenging method15,16. In this experiment, solution of different concentrations (250, 500 and 1000 µg/ml) of test samples were prepared. As positive control, Ascorbic acid was used. The absorbance at a specific wave length of 760 nm was measured after the addition of a DPPH solution to each sample following incubation. The IC50 values and the percentage inhibition of DPPH were determined by the equation:
![]()
Here, A0 and A1=Absorbance of control and extract solution, DPPH = 2, 2-diphenyl-1-picrylhydrazyl.
ABTS radical scavenging assay
Antioxidant activities of isolated compounds (1-4) were also performed by ABTS radical scavenging method17. Compounds (1- 4) were assessed at multiple concentrations (250, 500 and 1000 µg/ml) against a previously prepared ABTS solution. As positive control, Ascorbic acid was used. The decrease in color intensity was measured spectrophotometrically and the percentage inhibition of ABTS was calculated. IC50 values were also obtained for this study as follows.
![]()
Here, Ac and As= absorbance of control and extract solution, ABTS = 2, 2′-azino-bis-(3-ethylbenzothiazoline-6-sulfonate).
Antimicrobial assays
In vitro antimicrobial assays were screened for the isolated compounds (1-4) using the agar disc diffusion method18. Sterile, uncontaminated plates (Potato Dextrose Agar and Mueller Hinton Agar Plates) were inoculated with test organisms using a cotton swab. Sample discs (25μL of 300μg compound solution in DMSO were placed on pre-inoculated agar plates. DMSO acted as the negative control, while ceftriaxone (50μg/disc) and amphotericin B (50μg/disc) served as positive control. Incubation of Agar plates were performed aerobically at 37°C for 24 hours (antibacterial testing) and at 26°C for 48 hours (antifungal testing)followed by the measurement of zones of inhibition in millimeter.
Molecular Docking Analysis
In silico docking analyses were conducted to aid the design of novel drug candidates for effective inhibition of target disease-related proteins. Molecular docking of the compounds (1-4) was carried out by Gaussian 09, PyRx0.8 and Pymol software package19. Structure optimization of the compounds was performed by Gaussian 09 software. The non-covalent interactions between the compounds (1-4) and target receptors (2D and 3D) are illustrated in Fig. 5 and 6.
Protein Preparation
Target proteins for the docking analyses were taken from Protein data bank database20. To eliminate non-protein components, ligands and water molecules, the Discovery Studio program was used and polar hydrogen atoms and Kollman charges were allocated to the receptor protein. Auto Dock Vina21 was used to calculate the energy and create a 3D grid, while PyRx software was used to examine the ligand-protein interactions. Subsequently, all docked complexes were assessed for the lowest binding energy (Kcal/mol) values and analyzed for hydrogen and hydrophobic interactions with Discovery Studio.
Frontier molecular orbital analysis
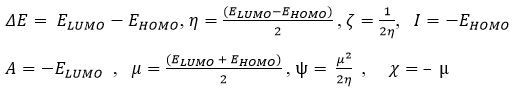
Frontier molecular orbital (FMO) analysis plays a pivotal role in unraveling a compound’s molecular properties and biological activity. The biological activity is intricately linked to the transition between the highest occupied molecular orbital (HOMO) and the lowest unoccupied molecular orbital (LUMO), which is represented by the energy gap (ΔE). Key parameters such as hardness (η), softness (ζ), ionization potential (I), electron affinity (A), chemical potential (μ), electrophilicity (ψ), and electronegativity (χ) can also be derived from FMO analysis.
All chemical reactivity parameters were calculated using the following equations:
In silico ADMET prediction
In silico ADMET analysis performed by using the Quantitative Structure Activity Relationship (QSAR) method. ADMET stands for absorption, distribution, metabolism, excretion, and toxicity, is a crucial aspect of drug development. In silico ADMET prediction, a modern and cutting-edge computational method is used to evaluate the essential properties of a drug molecule22. It can predict the four phases of pharmacokinetic properties and toxicity. It serves as a primary screening method, significantly minimizing time and resources before the clinical phase. The pharmacokinetics analysis of the isolated compounds (1-4) was observed with Lipinski’s rule of five and Veber’s rule. The percentage of absorption (% ABS) was calculated using the following formula:
ABS (%) = 109 ─ (0.3459 × TPSA)
Results and Discussion
Chemistry
Four new natural products (1-4) have been successfully identified from the isopropyl alcohol extract of the seeds of Mucuna pruriens and structures were elucidated by IR, NMR, COSY, HSQC, HMBC and Mass spectroscopic analysis.
Compound 1(Fig. 1): M.p: 130-131°C; IR: ῡmaxcm-11742(>C=O), 3442(-OH).1H and 13C NMR spectral values in CDCl3 are summarized in Table 1. In the mass spectrum (EI-MS),m/z 687.4860 [M+1]+was observed as highest molecular ion peak that was compatible with the molecular formula C41H66O8. Analysis of all spectral data structure 1 is suggested for compound 1 and was characterized as [(8ʹZ,8ʹʹZ)-10,13-dimethyl-2,3,4,7,8,9,10,11,12,13,14,15,16,17-tetradecahydro-1H-cyclopenta[ᾳ]phenanthrene-17-yl(2ʹ,10ʹ-dihydroxy-3ʹ-methyldec-8ʹ-enoate)-3-yl(2ʹʹ,10ʹʹ-dihydroxy-3ʹʹ-methyldec-8ʹʹ-enoate)] (1).
Compound 2 (Fig. 1): M.p:125-126°C; IR: ῡmaxcm-11742 (>C=O), 3460(-OH).The chemical shifts of protons and carbons in 1H and 13C NMR spectral data in CDCl3 are summarized in Table 2. In the mass spectrum (EI-MS), 687.4862 [M+1]+ was observed as highest molecular ion peak that was compatible with the molecular formula C41H66O8. Analysis of all spectral data structure 2 is suggested for compound 2 and was characterized as [(4ʹZ,4ʹʹZ)-10,13-dimethyl-2,3,4,7,8,9,10,11,12,13,14,15,16,17-tetradecahydro-1H-cyclopenta[ᾳ]phenanthrene-17-yl(2ʹ,10ʹ-dihydroxy-3ʹ-methyldec-4ʹ-enoate)-3-yl(2ʹʹ,10ʹʹ-dihydroxy-3ʹʹ- methyldec-4ʹʹ-enoate)] (2).
Compound 3 (Fig. 1): M.p: 156-157°C; IR: ῡmaxcm-1 1742 (>C=O), 3442(-OH).The chemical shifts of protons and carbons in 1H and 13C NMR spectral data in CDCl3 are summarized in Table 3. In the mass spectrum (EI-MS), m/z 711.4058 [M+1]+ was observed as highest molecular ion peak that was compatible with the molecular formula C41H58O10. Analysis of all spectral data structure 3 is suggested for compound 3 and was characterized as [6[{(E)-3ʹʹʹ,11ʹʹʹ-dihydroxy-4-methylundec-1ʹʹʹ-en-1ʹʹʹ-yl}oxy]-3-(4ʹ-[{(E)-3ʹʹ,11ʹʹ-dihydroxy-4-methylundec-1ʹʹʹ-en-1ʹʹʹ-yl}oxy] -phenyl)-5, 7–dimethoxy-4H-chromen- 4-one] (3).
Compound 4 (Fig. 1): M.p:162-163 °C;IR: ῡmaxcm-11632 (>C=O), 3364 (-OH).The chemical shifts of protons and carbons in 1H and 13C NMR spectral data in CDCl3 are summarized in Table 4. In the mass spectrum (EI-MS), m/z 805.9246 [M+1]+ was observed as highest molecular ion peak that was compatible with the molecular formula C42H60O15. Analysis of all spectral data structure 4 is suggested for compound 4 and was characterized as [17((3ʹE, 5ʹZ)-8ʹ-hydroxy-4ʹ,6ʹ,-dimethylocta-3ʹ,5ʹ-diene-1ʹ-yl)-3-((1ʹʹS,2ʹʹR,4ʹʹS,5ʹʹR)-2ʹʹ,3ʹʹ,4ʹʹ-trihydroxy-6ʹʹ-(((1ʹʹʹR,2ʹʹʹR, 3ʹʹʹS, 4ʹʹʹS,5ʹʹʹR) 2ʹʹʹ,3ʹʹʹ,4ʹʹʹ-trihydroxy-6ʹʹʹ-hydroxy methyl)tetrahydro-2H-pyran-1ʹʹ-yl)oxy) methyl)tetrahydro-2H-pyran-1ʹʹʹ-yl)-13-methyl-7,8,9,11,12,13,14,15,16,17-decahydro-6H-cyclopenta [α]phenanthrene-3,17-dicarboxylate] (4).
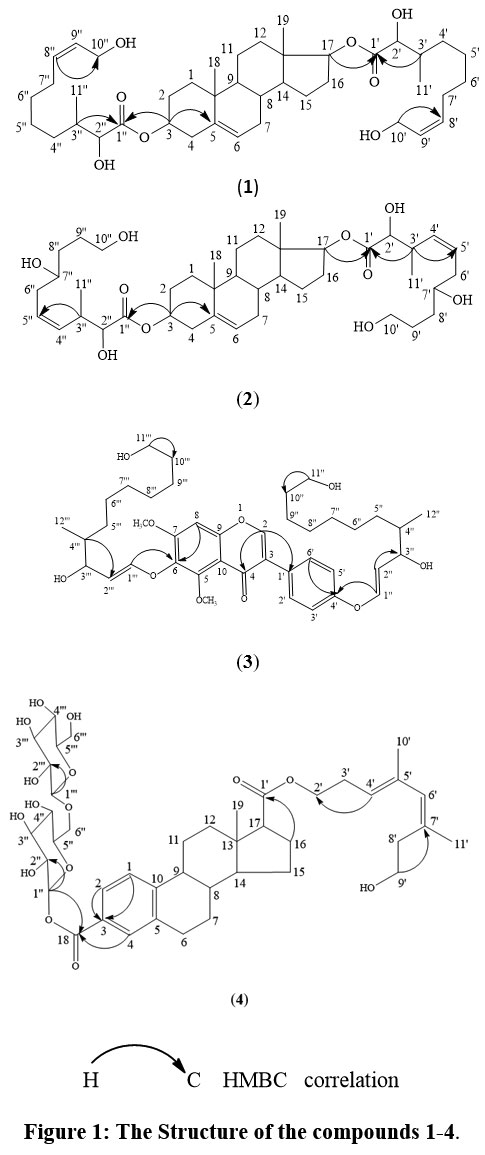 |
Figure 1: The Structure of the compounds 1-4. |
Table 1: H1 and 13C NMR spectral data for compound 1 (CDCl3 , δ, ppm, J/Hz)
| C No. | Carbon-13, δ | Proton, δ | COSY | C No. | Carbon-13, δ | Proton, δ | COSY |
| 1 | 29.4 | 1.30;1.26 (m) | 3ʹ | 31.7 | 2.04 (m) | ||
| 2 | 29.6 | 1.61;1.26 (m) | 4ʹ | 29.0 | 1.30 (m) | ||
| 3 | 65.5 | 4.14 (m) | 5ʹ | 29.2 | 1.30 (m) | ||
| 4 | 31.5 | 1.61;1.26 (m) | 6ʹ | 29.1 | 2.07 (m) | ||
| 5 | 131.8 | – | 7ʹ | 24.8 | 1.30 (m) | ||
| 6 | 130.1 | 5.26 (t, J = 4.8) | H-7 | 8ʹ | 129.9 | 5.28 (t, J = 4.8) | H-7ʹ,9ʹ |
| 7 | 34.0 | 2.04;1.61 (m) | H-6,8 | 9ʹ | 127.8 | 5.32 ((t, J = 4.8) | H-8ʹ,10ʹ |
| 8 | 33.9 | 2.31 (m) | 10ʹ | 62.0 | 4.12 (t, J = 6.0) | H-9ʹ | |
| 9 | 33.8 | 2.35 (m) | 11ʹ | 14.2 | .90 (d, J = 4.0) | H-3ʹ | |
| 10 | 31.8 | – | 1ʹʹ | 173.1 | – | ||
| 11 | 31.9 | 1.30;1.26 (m) | 2ʹʹ | 68.5 | 4.28 (d, J = 4.4) | H-3ʹʹ | |
| 12 | 29.6 | 1.30;1.26 (m) | 3ʹʹ | 31.8 | 2.06 (m) | ||
| 13 | 29.3 | – | 4ʹʹ | 29.0 | 1.30 (m) | ||
| 14 | 31.8 | 2.06 (m) | 5ʹʹ | 29.1 | 1.30 (m) | ||
| 15 | 29.6 | 1.30;1.26 (m) | 6ʹʹ | 29.1 | 2.04 (m) | ||
| 16 | 34.1 | 2.04;1.61 (m) | 7ʹʹ | 24.8 | 1.30 (m) | ||
| 17 | 65.4 | 4.14 (m) | 8ʹʹ | 129.9 | 5.38 (t, J = 4.8) | H-7ʹʹ, 9ʹʹ | |
| 18 | 14.0 | .88 (s) | 9ʹʹ | 128.0 | 5.34 ((t, J = 4.8) | H-8ʹʹ,10ʹʹ | |
| 19 | 14.0 | .86 (s) | 10ʹʹ | 64.9 | 4.17 (t, J = 6.0) | H- 9ʹʹ | |
| 1ʹ | 173.2 | – | 11ʹʹ | 14.1 | .89 (d, J = 4.0) | H-3ʹʹ | |
| 2ʹ | 68.9 | 4.31 (d, J = 4.4) |
Table 2: H1 and 13C NMR spectral data for compound 2 (CDCl3 , δ, ppm, J/Hz)
| C No. | Carbon-13, δ | Proton, δ | COSY | C No. | Carbon-13, δ | Proton, δ | COSY |
| 1 | 29.4 | 1.35;1.31 (m) | 3ʹ | 31.7 | 2.04 (m) | ||
| 2 | 29.6 | 1.61; 1.26 (m) | 4ʹ | 129.7 | 5.28 (t, J = 4.8) | H-3ʹ,5ʹ | |
| 3 | 73.55 | 4.14 (m) | 5ʹ | 127.7 | 5.32 ((t, J = 4.8) | H-5ʹ,6ʹ | |
| 4 | 31.5 | 2.07;.61 (m) | 6ʹ | 31.7 | 2.81 (m) | ||
| 5 | 133.0 | – | 7ʹ | 72.0 | 3.43(m) | ||
| 6 | 131.2 | 5.48 (t, J = 4.8) | H-7 | 8ʹ | 30.8 | 2.07 (m) | |
| 7 | 34.0 | 2.07;.61 (m) | 9ʹ | 29.4 | 1.31 (m) | ||
| 8 | 33.7 | 2.30 (m) | 10ʹ | 61.9 | 3.32 (t, J = 6.0) | H-9ʹ | |
| 9 | 33.5 | 2.32 (m) | 11ʹ | 13.1 | .92 (d, J = 4.0) | H-3ʹ | |
| 10 | 30.5 | – | 1ʹʹ | 173.9 | – | ||
| 11 | 32.8 | 1.35;1.31 (m) | 2ʹʹ | 69.2 | 4.28 (d, J = 4.4) | H-3ʹʹ | |
| 12 | 29.6 | 1.35;1.31 (m) | 3ʹʹ | 31.8 | 2.06 (m) | ||
| 13 | 29.3 | – | 4ʹʹ | 129.5 | 5.38 (t, J = 4.8) | H-3ʹʹ,5ʹʹ | |
| 14 | 31.8 | 2.00 (m) | 5ʹʹ | 127.7 | 5.34 ((t, J = 4.8) | H-4ʹʹ,6ʹʹ | |
| 15 | 29.0 | 1.35;1.31 (m) | 6ʹʹ | 31.3 | 2.84 (m) | ||
| 16 | 33.7 | 2.07;.61 (m) | 7ʹʹ | 71.9 | 3.43(m) | ||
| 17 | 74.8 | 4.14 (m) | 8ʹʹ | 30.8 | 2.09 (m) | ||
| 18 | 13.2 | .98 (s) | 9ʹʹ | 29.4 | 1.31 (m) | ||
| 19 | 19.5 | .97 (s) | 10ʹʹ | 64.6 | 3.32 (t, J = 6.0) | H-9ʹʹ | |
| 1ʹ | 176.3 | – | 11ʹʹ | 13.1 | .92 (d, J = 4.0) | H-3ʹʹ | |
| 2ʹ | 73.2 | 4.31 (d, J = 4.4) | H-3ʹ |
Table 3: H1 and 13C NMR spectral data for compound 3 (CDCl3 , δ, ppm, J/Hz)
| C No. | Carbon-13, δ | Proton, δ | COSY | C No. | Carbon-13, δ | Proton, δ | COSY |
| 2 | 129.7 | 5.38 (s) | 7ʹʹ | 28.7 | 1.30 (m) | ||
| 3 | 127.6 | – | 8ʹʹ | 26.7 | 1.30 (m) | ||
| 4 | 183.3 | – | 9ʹʹ | 24.6 | 1.30 (m) | ||
| 5 | 129.5 | – | 10ʹʹ | 33.9 | 2.34 (m) | ||
| 6 | 149.0 | – | 11ʹʹ | 65.0 | 3.32 (t, J = 2.8) | H-10ʹʹ | |
| 7 | 129.3 | – | 12ʹʹ | 13.0 | .92 (d, J = 3.6) | H-4ʹʹ | |
| 8 | 110.3 | 7.23 s | 1ʹʹʹ | 140.4 | 7.58 (d, J = 11.6) | H-2ʹʹʹ | |
| 9 | 127.7 | – | 2ʹʹʹ | 122.7 | 5.35 (t, J = 6.0) | H-1ʹʹʹ | |
| 10 | 129.6 | – | 3ʹʹʹ | 68.6 | 3.93 (s) | ||
| 1ʹ | 127.1 | – | 4ʹʹʹ | 22.2 | 2.03 (m) | ||
| 2ʹ | 115.1 | 6.85 (d, J = 6.8) | H-3ʹ | 5ʹʹʹ | 31.6 | 1.30 (m) | |
| 3ʹ | 115.6 | 7.23 | 6ʹʹʹ | 29.2 | 1.30 (m) | ||
| 4ʹ | 148.0 | – | 7ʹʹʹ | 28.9 | 1.30 (m) | ||
| 5ʹ | 115.4 | 7.13 (d, J = 6.8) | H-6ʹ | 8ʹʹʹ | 25.1 | 1.30 (m) | |
| 6ʹ | 114.8 | 6.83 (d, J = 6.8) | H-5ʹ | 9ʹʹʹ | 24.8 | 1.30 (m) | |
| 1ʹʹ | 140.7 | 7.51 (d, J = 11.6) | H-2ʹʹ | 10ʹʹʹ | 33.6 | 2.34 (m) | |
| 2ʹʹ | 122.5 | 5.36 (t, J = 6.0) | H-1ʹʹ | 11ʹʹʹ | 64.5 | 3.33 (t, J = 2.8) | H-10ʹʹʹ |
| 3ʹʹ | 69.2 | 3.93 (s) | 12ʹʹʹ | 12.9 | .91 (d, J = 3.6) | H-4ʹʹʹ | |
| 4ʹʹ | 22.3 | 2.03 (m) | 5-OCH3 | 55.0 | 3.93 (s) | ||
| 5ʹʹ | 31.2 | 1.30 (m) | 7-OCH3 | 55.1 | 3.93 (s) | ||
| 6ʹʹ | 29.3 | 1.30 (m) |
Table 4: H1 and 13C NMR spectral data for compound 4 (CDCl3 , δ, ppm, J/Hz)
| C No. | Carbon-13, δ | Proton, δ | COSY | C No. | Carbon-13, δ | Proton, δ | COSY |
| 1 | 114.3 | 6.67 (d, J = 8.0) | H-2 | 3ʹ | 38.3 | 2.07 (m) | |
| 2 | 115.6 | 6.69 (d, J = 8.0) | H-1 | 4ʹ | 127.6 | 5.48 (m) | |
| 3 | 126.0 | – | 5ʹ | 129.3 | – | ||
| 4 | 116.0 | 6.55 (s) | 6ʹ | 128.5 | 5.36 (s) | ||
| 5 | 129.6 | – | 7ʹ | 129.8 | – | ||
| 6 | 39.8 | 2.07 (m) | 8ʹ | 37.3 | 2.07 (m) | ||
| 7 | 36.5 | 1.30 (m) | 9ʹ | 63.3 | 3.32 (m) | ||
| 8 | 36.6 | 1.91 (m) | 10ʹ | 18.8 | .91 (s) | ||
| 9 | 31.5 | 1.91 (m) | 11ʹ | 18.4 | .91 (s) | ||
| 10 | 130.4 | – | 1ʹʹ | 103.2 | 4.15 (d, J = 6.0) | H-2ʹʹ | |
| 11 | 36.0 | 1.30 (m) | 2ʹʹ | 74.8 | 3.68(m) | ||
| 12 | 31.8 | 1.30 (m) | 3ʹʹ | 70.8 | 3.32 (m) | ||
| 13 | 34.4 | – | 4ʹʹ | 69.7 | 3.32 (m) | ||
| 14 | 25.8 | 1.91 (m) | 5ʹʹ | 73.5 | 3.43 (m) | ||
| 15 | 30.8 | 1.30 (m) | 6ʹʹ | 62.5 | 3.32 (m) | ||
| 16 | 30.7 | 1.30 (m) | 1ʹʹʹ | 101.2 | 4.19 (d, J = 6.0) | H-2ʹʹʹ | |
| 17 | 45.9 | 2.23 (m) | 2ʹʹʹ | 74.1 | 3.43 (m) | ||
| 18 | 176.3 | – | 3ʹʹʹ | 70.3 | 3.32 (m) | ||
| 19 | 18.8 | .91 (s) | 4ʹʹʹ | 69.2 | 3.32 (m) | ||
| 1ʹ | 174.8 | – | 5ʹʹʹ | 73.6 | 3.43 (m) | ||
| 2ʹ | 63.5 | 3.68 (m) | 6ʹʹʹ | 62.6 | 3.32 (m) |
Antioxidant activity
DPPH screening
The antioxidant screening of compounds (1-4) was tested using the DPPH free radical scavenging assay, which involves one-electron reduction, indicating the free radical-reducing capacity of antioxidants. Antioxidant activity were analyzed of those compounds (1-4) with the concentration of 250µg/mL, 500µg/mL and 1000µg/mL to compare with the control, compounds (1-4) didn’t show a significant p-value in one-way ANOVA analysis. The results indicated that compound 3 showed potent antioxidant activity, with an IC50 value of 171.46 μg/mL. Compounds 1, 2 and 4 exhibited good antioxidant activities, with IC50 values of 185.54 μg/mL, 179.39 μg/mL and 199.87 μg/mL respectively. The antioxidant screening results are summarized in Table 5. A brief activity of those compounds is shown in Fig. 2 and 4.
Table 5: Antioxidant activities of compounds 1-4 by DPPH screening with ANOVA
| Conc./Compd.
(µg/mL) |
Compd.1 | Compd.2 | Compd.3 | Compd.4 | AA(Control) | p (ANOVA) |
| 250 | 49.78±2.3 | 49.98±0.3 | 50.25±2 | 49.71±1.5 | 53.78±3.5 | 0.19 |
| 500 | 64.14±1.4 | 64.26±8.4 | 64.35±4 | 63.15±1.9 | 67.54±2.38 | 0.79 |
| 1000 | 76.19±3.3 | 76.21±5.3 | 76.18±2.4 | 76.14±3.7 | 80.01±0.9 | 0.58 |
| IC50(µg/mL) | 185.54 | 179.39 | 171.46 | 199.87 | 73.04 |
AA = Ascorbic Acid
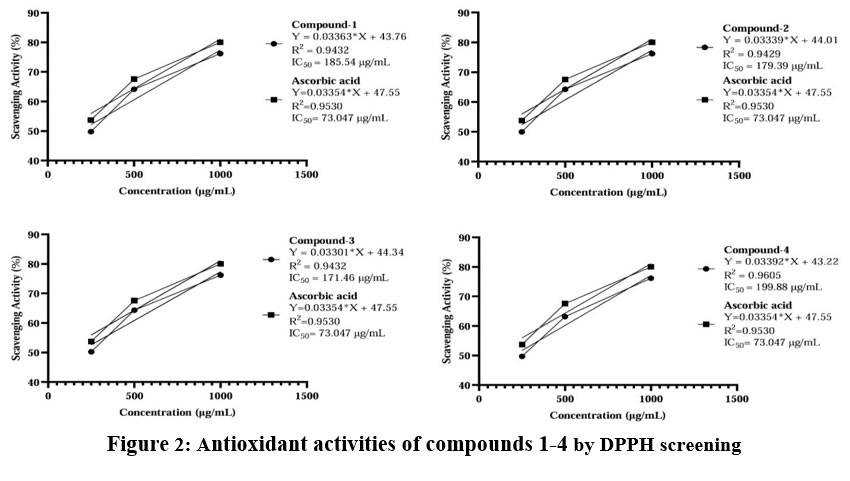 |
Figure 2: Antioxidant activities of compounds 1-4 by DPPH screening |
ABTS screening
The antioxidant activity was also evaluated using the ABTS radical scavenging test. In this test, compounds (1-4) were compared with the control; they didn’t show significant p-values in one-way ANOVA at different concentrations (250µg/mL, 500µg/mL and 1000µg/mL). The results indicated that compound 3 showed potent antioxidant activity, with an IC50 value 156.02 μg/mL (Table 6). Compounds 1, 2 and 4 exhibited good antioxidant activities, with IC50 values 181.81 μg/mL, 167.57 μg/mL and 197.41 μg/mL respectively (Fig. 3 and 4).
Table 6: Antioxidant activity of compounds (1-4) by ABTS scavenging assay
| Conc./Compd.
(µg/mL) |
Compd. 1 | Compd. 2 | Compd. 3 | Compd. 4 | AA (Control) | ANOVA
p-value |
| 250 | 50.37±0.8 | 50.47±1.8 | 50.46±2.2 | 49.71±1.9 | 54.56±5 | 0.27 |
| 500 | 62.26±2.1 | 63.56±1.2 | 64.56±1.1 | 62.24±0.8 | 67.26±4.3 | 0.12 |
| 1000 | 74.08±0.9 | 74.98±1.4 | 75.31±4.8 | 73.88±1.6 | 80.03±2.1 | 0.08 |
| IC50(µg/mL) | 181.81 | 167.57 | 156.02 | 197.41 | 55.55 |
AA = Ascorbic Acid
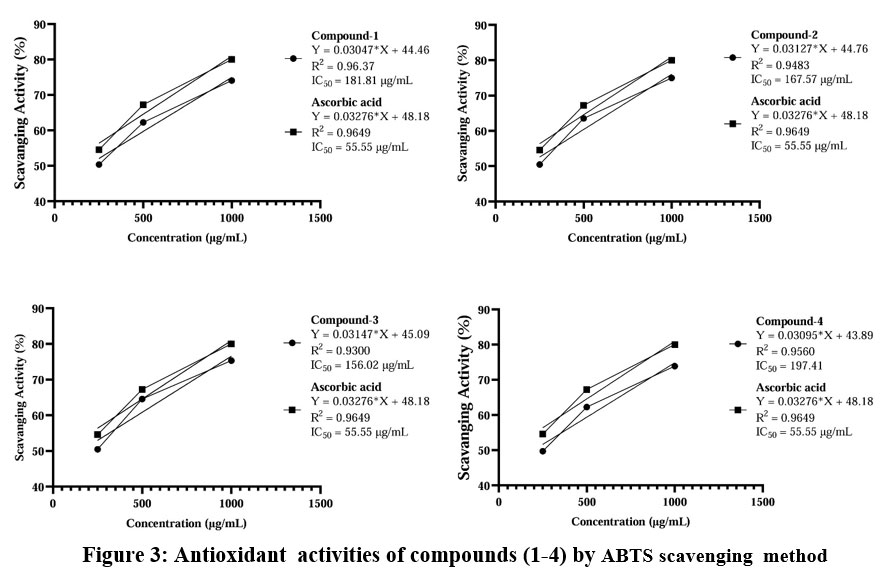 |
Figure 3: Antioxidant activities of compounds (1-4) by ABTS scavenging method |
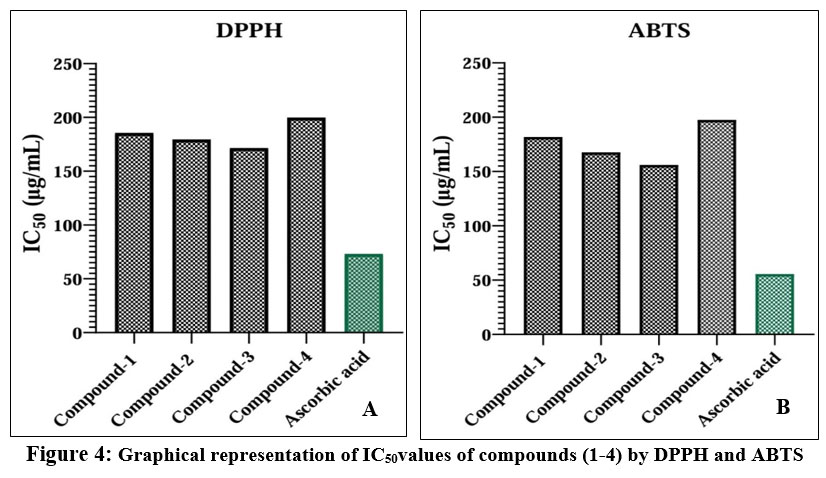 |
Figure 4: Graphical representation of IC50values of compounds (1-4) by DPPH and ABTS |
Antimicrobial activity
In vitro antimicrobial activities of the compounds (1-4) were screened against four bacterial strains along with two fungal strains (Tables 7 and 8). All the tested compounds showed activity against bacterial and fungal strains. In one-way ANOVA statistical analysis, we find that all compounds against four bacteria (B. subtilis, S. aureus, E.coli, S. typhimurium) showed significant (p-value <0.001) antimicrobial activities compared to the standard Ceftriaxone and also showed significant (p-value <0.001) antifungal activities against T. harzianum and A. niger compared to the standard Amphotericin B (Fig. 5).
Table 7: Antimicrobial studies of compounds (1- 4)
| Microorganisms | Compd. 1 | Compd. 2 | Compd. 3 | Compd. 4 | Cef
DMSO |
ANOVA
(p-value) |
| B. subtilis | 18 ± 0.9 | 12.3 ±0.2 | 26.3 ± 2.4 | 11.3 ± 2.02 | 50.0 ±2.73 | <0.001 |
| S. aureus | 19.3 ±2.4 | 11.3 ± 0.8 | 12 ± 2.3 | 10.3 ± 0.6 | 40.3 ± 2 | <0.001 |
| E.Coli
S. typhimurium |
19.0 ±2.4
21.3 ± 0.7 |
13.0 ±1.4
13.3 ± 0.6 |
17.0 ±0.9
19 ± 0.9 |
10.0 ±0.4
12.3 ±0.9 |
37.3 ±0.8
42.7 ± 2.2 |
<0.001
<0.001 |
The data are mean ± SD (standard deviation) and one-way ANOVA
Table 8: Antifungal studies of compounds (1- 4)
| Microorganisms | Compd. 1 | Compd. 2 | Compd. 3 | Compd. 4 | Amp. B
DMSO |
ANOVA
(p-value) |
| T. harzianum | 7.0 ±0.2 | 18.7±0.9 | 8.3±0.6 | 9.0±0.4 | 17.7 ± 1.2 | <0.001 |
| A. niger | 6.3±0.3 | 10.3±2.2 | 5.0±0.5 | 7.3±0.4 | 8.3 ± 0.5 | <0.001 |
The data are mean ± SD (standard deviation) and one-way ANOVA
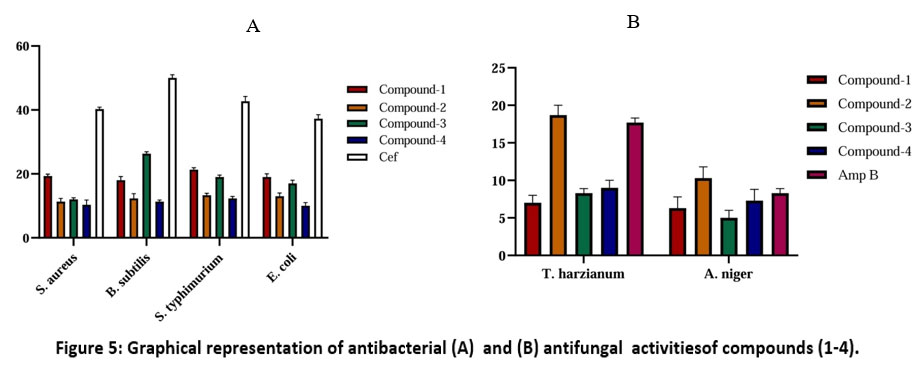 |
Figure 5: Graphical representation of antibacterial (A) and (B) antifungal activitiesof compounds (1-4). |
Molecular Docking Analysis
In silico molecular docking study was performed to study the interaction of isolated compounds with target protein receptors. Molecular docking studies of compound 2 to investigate the anti-bacterial activity against COX-2 (PDB ID: 1CX2) showed maximum binding score of -9.0. Compound 2 was also docked with the antifungal protein receptors T. harzianum (PDB ID: 5JBO) and A. niger (PDB ID: 1UKC) to assess its potential antifungal activity. There is a moderate interaction between the compound and receptors, as indicated by the values of the inhibition constant and free energy of binding. Compound 2, however, appears to have good effectiveness against fungi, according to the theoretical analysis of its antimicrobial potential (Table 9 and Fig. 6).
Table 9: Intra-molecular interactions of compound 2 and receptor proteins
| Name of the compound | Protein PDB ID | Binding affinity (kcal/mol) | Residues with H-bond interaction | Hydrophobic interaction |
| 2 | 1CX2 | -9.0 | Arg534 | Ala641(Alkyl) |
| Glu274 | Pro639(alkyl) | |||
| Glu274 | ||||
| 2 | 1EQG | -8.4 | Asn107 | Val108(alkyl) |
| Asp706 | Leu180(alkyl) | |||
| Asn107 | ||||
| Gly181 | ||||
| 2 | 5JBO | -8.3 | Arg242 | Trp334(pi-sigma) |
| Gln297 | Tyr166(pi-alkyl) | |||
| Trp415 | Tyr166(pi-alkyl) | |||
| Gln16 | Trp334(pi-alkyl) | |||
| His113 | ||||
| Asp227 | ||||
| Trp334 | ||||
| Trp415 | ||||
| 2 | 1UKC | -7.5 | Asn107 | |
| Thr391 | ||||
| Asp379 | ||||
| Gly101 | ||||
| Asp408 |
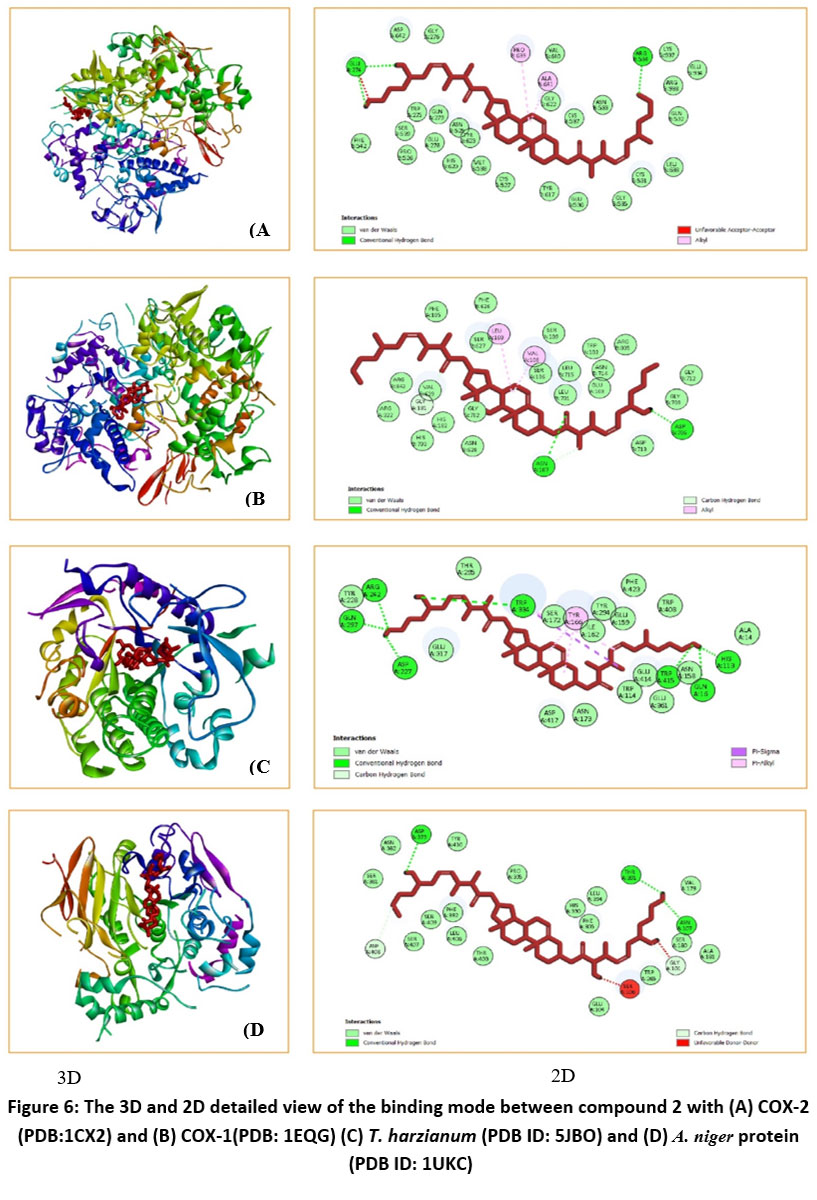 |
Figure 6: The 3D and 2D detailed view of the binding mode between compound 2 with (A) COX-2 (PDB:1CX2) and (B) COX-1(PDB: 1EQG) (C) T. harzianum (PDB ID: 5JBO) and (D) A. niger protein (PDB ID: 1UKC). |
Frontier molecular orbital analysis
Compound 2 exhibited the lowest HOMO–LUMO gap, the highest softness and the largest electron affinity, indicating greater reactivity and electron accepting ability. In contrast, compound 3, with the highest energy gap and hardness, is the most stable and least reactive. Overall, these results suggest compound 2 is the most chemically reactive, while compound 3 is the most stable within the series. The properties of the isolated compounds (1-4) are summarized in Table 10.
Table 10: HOMO-LUMO energy gap and global reactivity descriptors of isolated compounds(1-4)
| Chemical reactivity indices (eV) | Compd.1 | Compd.2 | Compd.3 | Compd.4 |
| EHOMO | -6.17 | -5.6 | -6.70 | -6.41 |
| ELUMO | -0.67 | -1.5 | -0.71 | -1.30 |
| Energy gap, ΔE | 5.50 | 4.16 | 5.98 | 5.11 |
| Hardness, η | 2.75 | 2.08 | 2.99 | 2.55 |
| Softness, ζ | 0.18 | 0.24 | 0.16 | 0.19 |
| Ionization potential, I | 6.17 | 5.69 | 6.70 | 6.41 |
| Electron affinity, A | 0.67 | 1.53 | 0.71 | 1.30 |
| Chemical potential, µ | -3.42 | -3.61 | -3.71 | -3.85 |
| Electrophilicity, ψ | 2.13 | 3.13 | 2.30 | 2.90 |
| Electronegativity, χ | 3.42 | 3.61 | 3.71 | 3.85 |
In silico ADMET prediction:
The in silico ADMET analysis (Tables 11 and 12) revealed that all isolated compounds (1-4) had one Lipinski’s rule violation, primarily due to their higher molecular weights. Compounds (1-3) displayed moderate oral bioavailability, while compound 4 showed reduced absorption due to its high polar surface area. Toxicity predictions indicated low mutagenic and tumorigenic risks, with compounds 1 and 3 being highly irritant and compound 2 showing higher reproductive toxicity. The drug-likeness scores for the isolates were lower than Ceftriaxone but comparable to Amphotericin B and Ascorbic Acid. Importantly, the results suggest that the isolated compounds possess significant drug-like potential.
Table 11: Predicted pharmacokinetic properties of isolated compounds (1-4)
| Sample
Compd. |
Lipinski’s
Violations (≤1) |
Lipinski’s rule | Veber’s rule | logSg | %ABSh | ||||
| MWa
(≤500) |
HBAb
(≤10) |
HBDc
(≤5) |
clogPd
(≤5) |
NROTBe
(≤10) |
TPSAf
(140 Å2) |
||||
| 1 | 1 | 686 | 8 | 4 | 7.63 | 20 | 133.5 | -7.2 | 62.82 |
| 2 | 1 | 686 | 8 | 4 | 7.63 | 20 | 133.5 | -7.2 | 62.82 |
| 3 | 1 | 710 | 10 | 4 | 7.42 | 25 | 144.1 | -8.2 | 59.15 |
| 4 | 1 | 804 | 15 | 8 | 3.22 | 15 | 242.1 | -5.1 | 25.25 |
| Cef | 2 | 554.0 | 14 | 4 | -2.95 | 8 | 287.3 | -2.95 | 9.62 |
| Amp B | 3 | 924.0 | 17 | 12 | 0.32 | 3 | 319.6 | –5.08 | -1.55 |
| AA | 0 | 176.12 | 6 | 4 | -1.40 | 2 | 107.22 | -0.55 | 72.00 |
aMolecular weight, bNumber of hydrogen bond acceptors, cNumber of hydrogen bond donor, dLipophilicity, eNumber of rotatable bonds, fTopological polar surface area, gSolubility parameter, hPercentage of absorption
Table 12: In silico toxicity effects and drug likeness values of compounds (1-4)
| Compounds | Toxicity effects | Drug-Likeness |
Drug-Score |
|||
| M | T | I | R | |||
| 1 | Low | Low | High | Medium | -8.36 | 0.04 |
| 2 | Low | Low | Low | High | -4.67 | 0.04 |
| 3 | Low | Low | High | High | -14.58 | 0.03 |
| 4 | Low | Low | Medium | High | -6.14 | 0.08 |
| Cef. | Low | Low | Low | Low | 16.69 | 0.63 |
| Amp B | Low | Low | Low | Low | -0.14 | 0.18 |
| AA | High | High | Low | High | 0.02 | 0.16 |
Conclusion
Four new compounds (1-4) were isolated from the seeds of M. pruriens and their structures were elucidated by using different spectral analyses. Biological screening of the isolated compounds showed that compounds 1 and 3 exhibited potential antibacterial activities with inhibition values of 21.3 ± 0.6 against S. aureus and 26.3 ± 0.6 against B. subtilis respectively. Compound 2 showed the highest antifungal activities with inhibition values of 18.7 ± 1.3 against T. harzianum and 10.7 ± 1.5 against A. Niger, which is also verified by molecular docking analysis. Compound 3 showed good antioxidant activities with IC50 value of 171.46 in DPPH method, 156.02 in ABTS radical scavenging method. These findings highlight the selective efficacy of the isolated compounds against different microbial pathogens and suggest their potential as lead molecules for further development. In silico molecular docking, ADMET predictions and Frontier Molecular orbital analysis were studied for isolated compounds (1-4) to determine the potential drugs formulations. In docking studies, compound 2 was observed as good binding affinity with COX-2 (PDB ID: 1CX2) protein (-.90 kcal/mol) and also showed a variety of strong interactions with the effective binding sites of the target receptors. In silico studies support the antimicrobial results very well. It is expected that the compounds (1-4) have a good drug score and contribute to the development of a more potent drug in the future.
Acknowledgement
The authors express their deep gratitude to the administration of Chittagong University of Engineering and Technology, Bangladesh, for supplying the necessary funding to complete the study.
Funding Sources
The author(s) received no financial support for the research, authorship, and/or publication of this article.
Conflict of Interest
There are no conflicts of interest among the authors regarding this article.
References
- Rahmatullah, M.; Azam, N.K.; Rahman, M.; Seraj, S.; Mahal, M.J.; Mou, S.M., American-Eurasian J. SustAgri, 2011, 5(3), 350-357.
- Sadh, P.K.; Chawla, P.; Duhan, J.S.; Food Biosci., 2018, 22, 113-120, https://doi.org/ 10.1016/j.fbio.2018.01.011
CrossRef - Majekodunmi, S.O.; Oyagbemi, A.A.; Umukoro, S.; Odeku, O.A., Asian. Pac. J .Trop. Med, 2011, 4(8), 632-636. https://doi.org/10.1016/S1995-7645(11)60161-2
CrossRef - Rajeshwar, Y.; Gupta, M; Mazumder, U.K., Iranian J of Pharma and Thera., 2005, 4(1), 46-50.
- Johnson, S.L.; Park, H.Y.; DaSilva, N.A.; Vattem, D.A.; Ma, H; Seeram, N.P., Nutrients 2018, 10, 1139, https://doi:10.3390/nu10091139
CrossRef - Laviada-Castillo, R.E.; Segura-Campos, M.R.; Chan-Zapata, I.; Torres-Romero, J.C.; Guillermo-Cordero, J.L.; Arana-Argáez, V.E., J. Food Biochem. 2009, 43, e12834, https://doi.org/10.1111/jfbc.12834
CrossRef - Jimoh, M.A.; Idris, O.A.; Jimoh, M.O., Plants2020, 9, 1249, https://doi:10.3390/plants9091249
CrossRef - Dhanani, T.; Singh, R.; Shah, S.; Kumari, P.; Kumar, S., Green Chem. Lett. Rev. 2015, 8, 43–48, DOI:10.1080/17518253.2015.1075070
CrossRef - Shanmugavel, G.; Krishnamoorthy, G., Int. J. Herb. Med. 2015, 2, 7–9.
- Rayavarapu, A.K.; Kaladhar, D.S., Asian J. Biochem Pharm Res. 2011, 12, 593-600.
- Tan, N.H.; Fung, S.Y.; Sim, S.M.; Marinello.E.; Guerranti, R.; Aguiyi, J. C., J Ethnopharmacol. 2009, 123, 356-358, DOI:10.1016/j.jep.2009.03.025.
CrossRef - Tavares, R.L.; Silvo, A.S.; Campo, A.R.N.; Schuler, A.R.P.; Aquino, J. S., Afr. J. Biotechnol. 2015, 14, 676–682.
CrossRef - Das, D.; Das, S.; Pandey, M.; Bhattacharyay, D., EJMP 2020, 31, 19–24.
CrossRef - Misra, L.; Wagner, H., Phytochemistry, 2004, 65(18), 2565–2567. DOI: 10.1016/j.phytochem.2004.08.045
CrossRef - Kedare, S.B.; Singh, R.P., J. Food Sci. Tech, 2011, 48(4), 412– 422. https://doi.org/10.1007/s13197-011-0251-1
CrossRef
- Shah, P.; Modi, H., IJRASET, 2015, 3(VI), 636-641.
CrossRef - Re, R.; Pellegrini. N.; Proteggente, A.; Pannala, A.; Yang, M.; Rice-Evans, C., Free Radic Biol Med, 1999, 26(9–10), 1231–1237. https://doi.org/10.1016/S0891-5849(98)00315-3
CrossRef - Bauer, A.W.; Kirby, W.M.; Sherris, J.C., Am J Clin Pathol, 1966, 45(4), 493–496.
CrossRef - Goodsell, D.S.; Sanner, M.F.; Olson, A.J.; Forli, S., Protein Sci, 2021, 30(1), 31– 43.https://doi.org/10.1002/pro.3934
CrossRef - Berman, H.M., Nucleic Acids Res, 2000, 28(1), 235–242.
CrossRef - Trott, O.; Olson, A.J., J. Comput.Chem, 2010, 31(2), 455–61.
CrossRef - Alnoman, M.M.; Parveen, S.; Alnoman, R.B.; Khan, A.; Khaleil, M.M.; Jaremko, M.; Al-Younis, I.; Emwas, A.H.; J.Molec.Str., 2024,1307,Article 138021. https://doi.org/ 10. 1016/j. molstruc. 2024.138021
CrossRef
Accepted on: 02 Oct 2025
Second Review by: Dr. Shreya Shanyal
Final Approval by: Dr. Tanay Pramanik


![]()


