Formulation and Optimization of Buccal Films of Piroxicam by Using Central Composite Design
 , Haranath Chinthaginjala*, Suryaprathap Thippeswamy Gari, Nishanth Goud Gadwala Vajagouni, Lakshmi Sampada Jayanthi and Mohammad Rizwan Boyeekati
Department of Pharmaceutics, Raghavendra Institute of Pharmaceutical Education and Research (RIPER) -Autonomous, KR Palli cross, Chiyyedu (PO), Anantapur, Andhra Pradesh, India
Corresponding Author E-mail: haranathriper@gmail.com
DOI : http://dx.doi.org/10.13005/ojc/410515
Download this article as:
![]()
The current study is concerned with the formulation and optimization of buccal films of Piroxicam employing central composite design. Solvent casting was used to create the Piroxicam buccal films. Utilising FT-IR analysis, drug excipient compatibility tests were carried out. The concentration of polymers such as Sodium alginate and Polyvinylpyrrolidone K30 were selected as independent variables. Drug release and mucoadhesion time were selected as dependent variables. The model was found to be nonlinear. As a result, the central composite design system was recommended. Research using FT-IR showed that there isn't much of an interaction between the drug and the excipients. Mucoadhesion time of prepared formulations varied from 5 hr to 8 hr. Percentage drug release of all formulations were in the range of 90% to 99.3%. It was determined to produce Piroxicam mucoadhesive buccal films with fewer trails and greater quality characteristics using the central composite design.
KEYWORDS:Buccal films; Central Composite design; Contour plots; Sodium alginate; Polyvinylpyrrolidone.
Introduction
Transmucosal medication delivery offers greater benefits for systemic impact than oral administration among the many drug delivery routes. When it comes to local and systemic medication administration via different transmucosal channels, buccal mucosa is the most appropriate1. Because of its special characteristics, such as its ability to avoid the hepatic first-pass effect and its lack of pre-systemic drug clearance in the GIT, the buccal mucosa is a prime location for mucoadhesive drug delivery systems. Bypassing the drug’s hepatic first pass metabolism and entering the systemic circulation directly through the internal jugular vein, buccal films (BF) have a high bioavailability2. These dose forms also offer better patient compliance, are pharmacoeconomic, and may be administered by themselves. Because of its abundant blood supply, the buccal mucosa serves as an ideal and quick location for medication absorption3. Specifically, as compared to alternative dosage forms, BF exhibit better mechanical resistance, more flexibility and precision in regard to dosing.
In addition, it may be quickly removed in an emergency and function as a controlled release system. Films are elastic and flexible, giving patients more comfort. They can, however, withstand breaking due to tongue motions because of their strength. Owing to these characteristics, films may be seen at night while you sleep, which improves treatment compliance4. Strong NSAID Piroxicam (PC) is recommended for osteoarthritis and rheumatoid arthritis, among other inflammatory diseases. While parenteral PC injection site causes significant pain and inflammation, oral PC administration is linked to side effects include ulcerative colitis, GI irritation, and peptic ulcers5. PC’s low solubility is another significant disadvantage (BCS class II medication). PC works by averting making of endogenous prostaglandins. PC is rapidly absorbed through digestive tract 6. The longer half-life, protein binding properties and gastrointestinal disturbances and serious skin reactions caused by PC lead to development of controlled release BF formulation to reduce adverse effects in stomach, improving safety and efficacy of PC. Central Composite Design (CCD) is a widely used statistical method for process or formulation optimisation7. It is based on the multivariate non-linear model and availed to determine the regression model equations and operating conditions from appropriate experiments. Using CCD, the interplay of many factors influencing the process may also be investigated.
The purpose of its emergence is to optimise and identify the best possible product from the current batches. The primary objectives of the current work are to create BFs using CCD and to look at how factors affect the responses. The concentrations of polyvinyl pyrrolidone (PVP) and sodium alginate (SA) served as the independent variables. The outcomes were determined to be Mucoadhesion Time (MT) and Percentage drug release (DR).
Materials and Methods
Materials
In Anantapur, Andhra Pradesh, Waksman Selman Pharma Pvt Ltd offered PC as a complimentary sample. SD Fine chem. Ltd, Mumbai provided PVP K30. Loba Chemie Pvt Ltd, Mumbai, supplied Sodium alginate, Menthol, Propylene glycol and Sodium Saccharin. Every material that was utilised was of an analytical grade.
Methods
FT- IR studies
With FT-IR spectroscopy the compatibility was ascertained. Pellets are created by combining minuscule amounts of the drug and polymers with KBr and compressing the mixture8. These are scanned in the 4000 cm-1 to 400 cm-1 range using an FT-IR spectrophotometer (Schimadzu 1800).
Optimization by the CCD
The present study employed Sigma Tech software Version 3.1 to create BF experimental, carrying out 22 factorial design. The model’s nonlinearity was found and a considerable curvature effect was achieved, indicating the employment of CCD for optimisation. Table 1 presented the results of the investigative trials, while Table 2 included the SA concentration (X1) and PVP K 30 concentration (X2) as nondependent parameters. Mucoadhesion time (MT) and DR percentage (DR) were indicated as outcomes.
Table 1: Variables with responses
| Factors | Actual values (%) | Response | ||||
| -2 | -1 | 0 | +1 | +2 | ||
| Sodium alginate | 0.5 | 1.1875 | 1.875 | 2.5625 | 3.25 | Y1= MTY2= DR |
| PVP K30 | 1.0 | 2.0 | 3.0 | 4.0 | 5.0 | |
Table 2: Central composite design layout of formulations (F1-F9)
| Formulation code | Combination | X1 (SA in %) | X2 (PVP K-30 in %) |
| F1 | 1 | 1.1875 | 2 |
| F2 | X1 | 2.5625 | 2 |
| F3 | X2 | 1.1875 | 4 |
| F4 | X1X2 | 2.5625 | 4 |
| F5 | Midpoint | 1.875 | 3.0 |
| F6 | X1 at -2L | 0.5 | 3.0 |
| F7 | X1 at +2L | 3.25 | 3.0 |
| F8 | X2 at -2L | 1.875 | 1.0 |
| F9 | X2 at +2L | 1.875 | 5.0 |
Formulation of PC BFs
Different formulations of PC BFs containing, PC were prepared by using solvent casting method employing sodium alginate and PVP K30 polymers in different ratios. The composition of all formulations was presented in Table 3. Except sodium alginate and PVP K30 rest all the ingredients weights are constant in each formulation. SA was dissolved in distilled water and mixed at room temperature on magnetic stirrer. In a separate beaker PVP K30 was dissolved and mixed. Mix both the resultants on magnetic stirrer over 20-30 minutes. Simultaneously PC was accurately weighed in quantity such that each 2cm2 film contained 20 mg and then dissolved in sufficient dichloromethane in another beaker. Using a magnetic stirrer, the medication solution was added to the polymer solution and well mixed. with subsequent addition of propylene glycol (Plasticizer), sodium saccharin (Sweetener) and menthol (Permeation enhancer). The above solution was transferred into Petri plates and allow them to dry for 12 hr and next subject them into hot air oven for 1 hour9. After drying, the films were cut to a diameter of 2 cm, wrapped in aluminium foil, and kept in a desiccator until needed again.
Table 3: Composition of PC BFs
| Ingredients | F1 | F2 | F3 | F4 | F5 | F6 | F7 | F8 | F9 |
| PC (mg) | 20 | 20 | 20 | 20 | 20 | 20 | 20 | 20 | 20 |
| SA (%w/w) | 1.1875 | 2.5625 | 1.1875 | 2.5625 | 1.875 | 0.5 | 3.25 | 1.875 | 1.875 |
| PVP K30 (%w/w) | 2 | 2 | 4 | 4 | 3 | 3 | 3 | 1 | 5 |
| Propylene glycol (%) | 5 | 5 | 5 | 5 | 5 | 5 | 5 | 5 | 5 |
| Sodium saccharin (%) | 0.1 | 0.1 | 0.1 | 0.1 | 0.1 | 0.1 | 0.1 | 0.1 | 0.1 |
| Menthol(%) | 5 | 5 | 5 | 5 | 5 | 5 | 5 | 5 | 5 |
Thickness
A thickness gauge with a minimum count of 0.01mm was used to evaluate the film compositions’ thickness. The average thickness of the films was calculated by taking measurements of three different films at three different places10.
Weight variation (WV)
Each BF’s weight was deducted from the average weight of the five BFs and computed the mean± SD values for each formulation11.
Swelling index (SI)
A pre-weighed cover slip was used to weigh a loaded film measuring 2 X 2 cm2 in order to study the drug’s swelling effects. A Petri plate was used to hold it, and 50 ml of pH 6.8 phosphate buffer were added. The cover slip was taken off and weighed every five minutes for thirty minutes12. The weight gain resulting from film swelling and water absorption is determined by the difference in weights.
(% SI) = (Xt-X0/X0) × 100
Where, Xt = the swelling film’s weight with time
X0 = the original weight of the film at time zero
Folding endurance (FE)
The numeral of repetitions the film might be folded in the exact orientation without breaking was used to calculate FE13 .
Drug content (DC)
DC of the films were estimated by the method as described by Ammanage et. al 14 .
Surface pH
The films were mildly moistened with water, and the electrode was brought into contact with the film’s surface to measure pH15.
% Moisture loss (ML)
The BFs were precisely weighed and stored in anhydrous calcium chloride-filled desiccator. Three days later, the film was removed and weighed. The following calculation was used to determine the % moisture loss16 .
Moisture absorption (MA)
Weighed BF were placed in desiccator with 100 ml of an aluminium chloride saturated solution at RH of 86%. Three days later, the films were taken out and weighed17.
MT
The MT was evaluated after pasting the films onto freshly cut buccal mucosa, procured form local market of Ananthapuramu. The buccal mucosa was fixed to the glass slide using araldite and the films were placed on buccal mucosa and slightly pressed with fingers to attach the film to the mucosa on glass slide18. Now place this glass slide in slant position into the 500ml beaker and fill with prepared phosphate buffer of pH 6.8 till the film gets dipped and the beaker was kept on magnetic stirrer (Remi) at 150 rpm.
DR
The prepared PC BFs was studied using Dissolution test apparatus- IP paddle (Electro lab, India, TDT-08L) where the prepared formulations were attached to glass slides using araldite19. These glass slides were placed inside the beakers and filled with 250ml of phosphate buffer of pH 6.8. The release study was carried out for 8 h. After every hour, samples were withdrawn and replace with fresh medium and analysed for PC at 353nm using UV-vis spectrophotometer (UV-1800, Shimadzu).
Results and Discussion
FTIR Studies
The drug and excipients utilised in the formulation do not exhibit any appreciable peak alternations, according to FT-IR research on drug-excipient compatibility tests. The outcomes were shown in (Figure 1). FT-IR investigations revealed that the pure drug shown N-H stretch at 3682cm-1, S=O stretch at 1402cm-1, and C=O stretch at 1678cm-1. The drug was combined with the excipients and the IR spectrum was recorded and observed the retention of peaks in the spectra. It was notified that there are no significant alternations in the peaks of the spectra of pure drug when added with excipients used in the formulations. The results indicated that the characteristic absorption peaks of all functional groups such as N-H, S=O, C=O of pure drug have appeared in the physical mixture without noticeable change in their positions indicating no chemical interaction between dug and excipients.
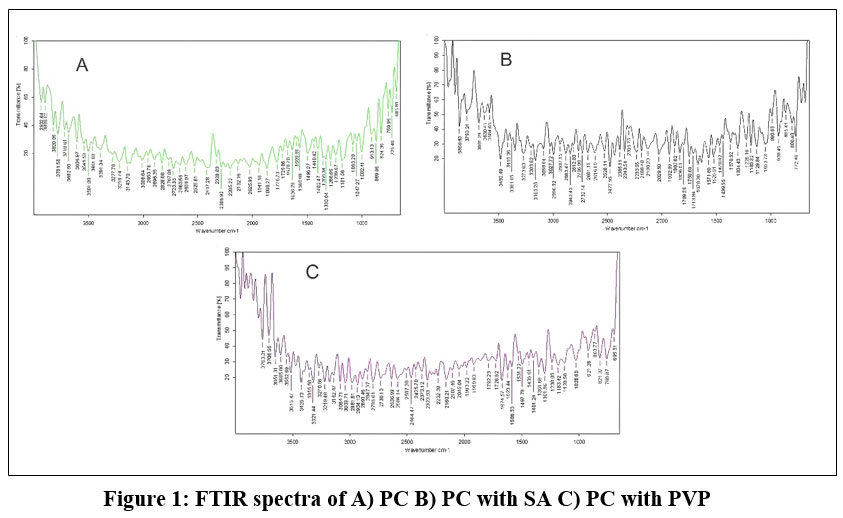 |
Figure 1: FTIR spectra of A) PC B) PC with SA C) PC with PVP |
Thickness, Weight Variation and FE
The results of thickness, weight variation and FE for formulations F1 – F9 were tabulated in Table 4. The film thickness of the prepared formulations was amid of 0.54 mm to 0.62 mm. All formulations WV test values were in between 94mg to 96mg. All the formulations were of same weight which ensures the uniformness of the weight of the films without deviation. FE was determined manually, which ranged from 181-220 for formulations F1-F9, respectively. The FE was found to be increased with increasing concentrations of PVP K30 and SA20. FE is an essential factor to ensure the physical strength of the film. The obtained results revealed that the prepared films have sufficient strength.
Table 4: Evaluation studies of formulations F1 – F9
| Formulation code | Thickness (mm) ± SD* | WV (mg) ± SD* | FE ± SD* |
| F1 | 0.55 ± 0.02 | 94 ± 0.06 | 184 ± 0.08 |
| F2 | 0.57 ± 0.04 | 95 ± 0.07 | 188 ± 0.06 |
| F3 | 0.59 ± 0.01 | 96 ± 0.04 | 198 ± 0.07 |
| F4 | 0.61 ± 0.03 | 95 ± 0.05 | 209 ± 0.05 |
| F5 | 0.58 ± 0.06 | 96 ± 0.03 | 192 ± 0.04 |
| F6 | 0.56 ± 0.04 | 95 ± 0.08 | 185 ± 0.03 |
| F7 | 0.60 ± 0.05 | 96 ± 0.02 | 204 ± 0.01 |
| F8 | 0.54 ± 0.03 | 94 ± 0.01 | 181 ± 0.04 |
| F9 | 0.62 ± 0.05 | 96 ± 0.07 | 220 ± 0.02 |
pH, DC, ML, MA studies
All of the film’s surfaces were determined to have a pH between 6.5 and 6.7. Hence, no mucosal irritation was expected from these prepared films. All the formulations surface pH was in the buccal pH range which confirms the suitability of the films without any mucosal irritation and enhances patients’ compliance.
All formulations had varying drug contents (%), ranging from 97.35% to 98.42%. This suggests that the medication was evenly distributed throughout the polymeric films.
The results of percent moisture loss varied between 1.32% -2.03% and it was detected that as the viscosity of the polymer increased there by resulting in a gradual decrease of percent moisture loss. Over the course of three days, the percent moisture absorption investigation was conducted, and the findings revealed a range of 3.28% to 5.11%. It was discovered that when the polymer content and viscosity (PVP K30, sodium alginate) increased, so did the moisture absorption. The results of drug content uniformity, surface pH, moisture loss, moisture absorption and MT were furnished in Table 5.
Table 5: Evaluation of drug content uniformity, surface pH , moisture loss, moisture absorption , MT of formulations F1 – F9
| Formulation code | %Drug content ± SD* | Surface pH | %Moisture loss ± SD* | %Moisture absorption ± SD* | MT (hr) |
| F1 | 97.23 ± 0.08 | 6.5 | 2.17 ± 0.05 | 2.72 ± 0.05 | 5 |
| F2 | 97.72 ± 0.06 | 6.5 | 1.94 ± 0.02 | 3.75 ± 0.03 | 6 |
| F3 | 98.12 ± 0.01 | 6.7 | 1.48 ± 0.04 | 4.69 ± 0.01 | 8 |
| F4 | 98.86 ± 0.04 | 6.5 | 1.14 ± 0.06 | 5.65 ± 0.04 | 7 |
| F5 | 97.96 ± 0.07 | 6.6 | 1.67 ± 0.05 | 4.19 ± 0.02 | 7 |
| F6 | 97.45 ± 0.02 | 6.5 | 2.03 ± 0.03 | 3.28 ± 0.01 | 7 |
| F7 | 98.42 ± 0.05 | 6.6 | 1.32 ± 0.01 | 5.11 ± 0.03 | 8 |
| F8 | 96.99 ± 0.04 | 6.7 | 2.22 ± 0.02 | 2.58 ± 0.01 | 6 |
| F9 | 99.62 ± 0.03 | 6.6 | 1.03 ± 0.01 | 5.92 ± 0.04 | 8 |
SI
SI was performed for all the formulations. Studies of the swelling index were conducted for each formulation (F1 through F9). It was discovered that the swelling index for every movie fell between 126% and 405%. Table 6 displays the swelling behaviour of chosen films as a function of time. F1 formulation has shown only 163% at 8hr. SI was increased with an increase in the polymer concentrations21. The swelling indices of the films were increased up to 405% for formulation F9 at 8 hr and followed by F3, F4 and F7. higher swelling index may be owing to the existence of water-soluble polymers namely SA and PVP k30.
Table 6: SI of F1 – F9
| Time (hr) | SI ±SD | ||||||||
| F1 | F2 | F3 | F4 | F5 | F6 | F7 | F8 | F9 | |
| 1 | 20 ± 0.01 | 25 ± 0.03 | 38 ± 0.04 | 45 ± 0.07 | 33 ± 0.06 | 22 ± 0.02 | 42 ± 0.03 | 16 ± 0.07 | 51 ± 0.04 |
| 2 | 39 ± 0.04 | 51 ± 0.04 | 80 ± 0.06 | 92 ± 0.06 | 67 ± 0.03 | 45 ± 0.04 | 83 ± 0.04 | 31 ± 0.06 | 103 ± 0.03 |
| 3 | 61 ± 0.05 | 74 ± 0.02 | 123 ± 0.02 | 140 ± 0.05 | 97 ± 0.08 | 67 ± 0.06 | 122 ± 0.05 | 45 ± 0.01 | 152 ± 0.06 |
| 4 | 78 ± 0.02 | 103 ± 0.01 | 169 ± 0.01 | 186 ± 0.03 | 128 ± 0.02 | 89 ± 0.01 | 163 ± 0.01 | 61 ± 0.05 | 205 ± 0.02 |
| 5 | 98 ± 0.06 | 127 ± 0.07 | 213 ± 0.04 | 232 ± 0.04 | 129 ± 0.01 | 115 ± 0.03 | 203 ± 0.02 | 76 ± 0.08 | 260 ± 0.05 |
| 6 | 120 ± 0.04 | 158 ± 0.06 | 258 ± 0.03 | 272 ± 0.05 | 161 ± 0.05 | 134 ± 0.02 | 244 ± 0.06 | 93 ± 0.03 | 307 ± 0.01 |
| 7 | 142 ± 0.03 | 179 ± 0.01 | 302 ± 0.01 | 315 ± 0.01 | 193 ± 0.07 | 163 ± 0.05 | 282 ± 0.02 | 110 ± 0.06 | 352 ± 0.06 |
| 8 | 163 ± 0.01 | 211 ± 0.08 | 344 ± 0.06 | 359 ± 0.02 | 223 ± 0.03 | 192 ± 0.01 | 322 ± 0.07 | 126 ± 0.01 | 405 ± 0.05 |
MT studies
With a co-efficient of 1.25 and an SS ratio of 65.33%, MT (Y1) was the utmost noteworthy interaction between X1 and X2, as shown in Table 7.
Table 7: Statistical analysis of DOE experimental observations for response Y1 (MT)
| S. No | Combination | Name of variable | Coefficient values | SS % (% of sum of squares) |
| 1 | b0 | – | 94.75 | – |
| 2 | b1 | SA | 0.25 | 1.3333% |
| 3 | b2 | PVP(K30) | 1.75 | 33.3333% |
| 4 | b1b2 | SA + PVP K30 | 1.25 | 65.3333% |
Ultimate equation with coded elements
Y1 = 6.2778+ 0.3333X1+ 0.8333X2+ 8.0X1X2+ 0.2292X12+ 0.1042X22
Ultimate equation in respect of factual elements
Y1 = 6.2778+ 0.3333SA+ 0.8333PVP+ 8.0 SAPVP+ 0.2292SA2+ 0.1042PVP2
Polynomial equations were used to establish a conclusion (positive or negative) after the coefficient’s magnitude and mathematical signs were evaluated. Research using multiple linear regression showed that the MT decreases when the amounts of X1 (sodium alginate) and X2 (PVP K30) are reduced. The R2 value of this quadratic model was found to be 0.8976, signifying its dependability. The resulting F value is more than the critical F value (CFV), as Table 8 illustrates, and the result seemed significant at (p 0.05). The obtained F value 6.68, is more than the CFV (i.e., 4.29), indicating that the accomplished F value is anticipated to ascend via chance with a p 0.05. Consequently, software indicates that the relationship between Y1 and X1 X2 is nonlinear, and the CCD is left in place. As Table 5 illustrates, films MT ranged from 5 to 8 hr. The films formulation F1 had the lowest MT of 5 hr, whereas formulas F3, F7, and F9 displayed the maximum adhesion time of 8 hr. The attachment of a polymer to mucous is known as mucoadhesion. Mucoadhesion is generally thought to happen in three main stages: mechanical interlocking between mucous and polymer, interpenetration, and wetting. The experiment’s biological membrane, the molecular weight of the polymers, and the extent of time the polymers are in contact with the mucous all have an impact on the strength of mucoadhesion. The buccal mucosa of sheep was employed in this investigation as the biological membrane for mucoadhesion. Increases in PVP K30 and sodium alginate concentration were shown to considerably lengthen the mucoadhesion duration22. The addition of PVP K30, a water-soluble hydrophilic polymer, significantly improved the BF mucoadhesion.
Table 8: Results of ANOVA for response Y1 (MT)
| S. No | Source of variable | SS | DF | MS | F-value | F std at 0.1p | F std at 0.05p | F std at 0.01p |
| 1 | Model | 12.1642 | 4 | 1.7536 | 6.6863 | 5.64 | 4.29 | 20.1 |
| 2 | Error | 0.0 | 3 | 0.0 | ||||
| 3 | Total | 12.1642 | 7 | |||||
| 95% CLCE | Non linear | |||||||
Standard Deviation (SD) : 0.05 F Standard Value (SV) at 0.05 p : 10.5
Curvature Effect (CE) : -6.6478 F Standard Value (SV) at 0.01 p : 40.7
95% Confident Level of Curvature Effect(CLCE) FROM: -7.8753 TO: -6.3685 (Non Linear)
DF is Degrees of freedom, MS is mean squares, P is probability
In vitro DR studies
The most significant interaction between X1 and X2, as shown in Table 9, was DR (Y2), with an SS ratio of 72.1654% and a co-efficient of 1.35.
Table 9: Statistical analysis of DoE experimental observations with two variables of Y2 (% DR)
| S. No | Combination | Name of variable | Coefficient values | SS % (% of sum of squares) |
| 1 | b0 | – | 64.76 | – |
| 2 | b1 | SA | -0.68 | 2.5343% |
| 3 | b2 | PVP(K30) | -1.85 | 33.7383% |
| 4 | b1b2 | SA+ PVP | 1.35 | 72.1654% |
Ultimate equation with coded elements
Y2 = 13.5+ 0.3333X1+ 1.25X2+ 7.38X1X2+ 15.4063X12+ 15.8438X22
Ultimate equation in respect of factual elements
Y2 = 13.5+ 0.3333SA+ 1.25PVP+ 7.38SAPVP+ 15.4063SA2+ 15.8438PVP2
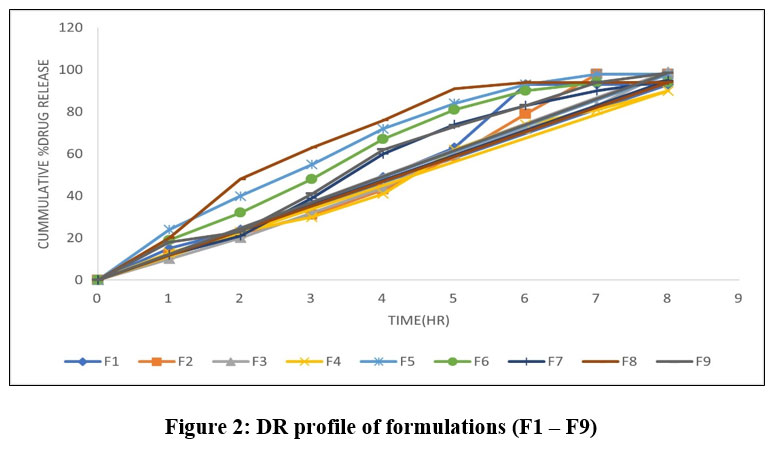 |
Figure 2: DR profile of formulations (F1 – F9) |
 
The effect of polymer on the in vitro DR was influenced to a great extent. polymer concentration was varied for all 9 formulations. According to the multiple linear regression analysis, a decrease in X1 (sodium alginate) and X2 (PVP K30) causes the percentage of medication release to rise. The contour plot/design space and prediction establishment of this quadratic model are both supported by the model’s 0.8969 R2 value. The results were displayed in Table 10. Because of their hydrophilic character and quick hydration, the low concentration polymer sodium alginate and PVP K30 in the polymeric system result in controlled release drug delivery. Figure 2 depicts the in vitro release of PC from several films. From formulations F1 to F9, the DR was maintained linearly with an increase in sodium alginate and PVP K30 content. The DR values for each formulation ranged from 90% to 99.2%. 93%, 98%, 99.2%, 90%, 98%, 94%, 95%, 94%, and 98.5% are displayed in Formulations F1, F2, F3, F4, F5, F6, F7, F8, and F9. For formulation F3, the highest DR was discovered to be 99.2% during an 8-hour period. The data suggest that films with lower polymer concentrations released the medication more because they contained more carboxylic acid and had a higher number of free chains that might attach to the buccal mucosa. When the concentration of PVP K30 and sodium alginate was increased, the rate of DR significantly decreased23. The medication was delivered by formulations F1 and F2 for a maximum of six hr. The regulated release of the medicine is ensured by formulas F3, F5, and F6, which release the drug for up to seven hr. Variations in the polymer concentration led to variations in the time period’s release. Additionally, it was noted that the PVP K30 and sodium alginate fraction had an impact on the DR quantity at the maximum time points of 7 and 8 hr, respectively
Table 10: Results of ANOVA for response Y2 (% DR)
| S. No | Source of variable | SS | DF | MS | F-value | F std at 0.1p | F std at 0.05p | F std at 0.01p |
| 1 | Model | 6.472 | 3 | 1.5468 | 9.4482 | 4.68 | 6.23 | 16.1 |
| 2 | Error | 0.0 | 4 | |||||
| 3 | Total | 6.472 | 7 | |||||
| 95% confident level of curvature effect | Non linear | |||||||
SD : 0.045 F SV at 0.05 p : 10.9
CE : -7.7394 F SV at 0.01 p : 41.3
95% CLCE FROM: -8.9284 TO: -7.9254 (Non Linear)
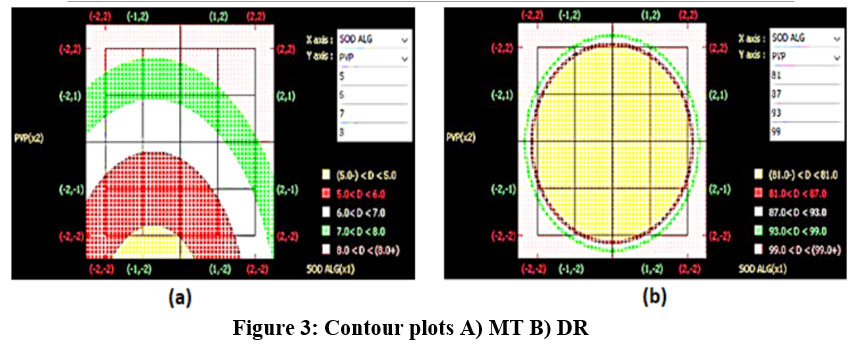 |
Figure 3: Contour plots A) MT B) DR |
 
Figure 3 illustrates how contour plots were used to identify an appropriate design space for MT and DR within the inferred values. Through a multimodal mix of MT and DR, the study developed a design space that led to an acceptable operational series for articulating BFs. The response to the formulation was constructed and tested using the projected values. Contour plots made it probable to generate a variety of designs. For the optimal formulation, SA was adjusted to 2.5%w/v and PVP K30 to 3.25%w/v, while keeping all other constituents same. Using the prophesied and investigational values, the RE for each outcome was figured. The results are displayed in Table 11 and are 0.25% and 0.31%, respectively. The examined data supported the predicted values, demonstrating the validity and expectedness of the model.
Table 11: Comparison of experimental results with predicted response of PC BF formulations
| Ingredients | Composition(%w/v) | Response | Predicted value | Experimental value | Standard error |
| SA | 2.5 | Y1(MT) (hr) | 8 | 7.8 | 0.25% |
| PVP(K30) | 3.25 | Y2 (%DR)(hr) | 99 | 97 | 0.31% |
Conclusion
PC mucoadhesive BFs were successfully formulated utilizing the solvent casting method, with Sodium alginate and PVP K30 serving as independent variables. DR can be prolonged for up to 8 hr. According to the central composite design model, the concentration of variables has a significant and interactive impact on the MT and DR. The results show that the use of experimental design to optimise polymer concentrations was successful. Finally, it was resolute that the CCD would be used to formulate PC mucoadhesive BFs with less trails and excellence features.
Acknowledgement
The authors are thankful to the RIPER for the support provided.
Funding Sources
The author(s) received no financial support for the research, authorship, and/or publication of this article.
Conflict of Interest
The authors declare that there are no conflicts of interest regarding the publication of this review article.
Data Availability Statement
This statement does not apply to this article.
References
- Srivastava, N.; Aslam, S.; Recent Pat Nanotechnol. 2022, 16(4), 308-325.
- Nair, A. B.; Shah, J.; Jacob, S.; Al-Dhubiab, B. E.; Patel, V.; Sreeharsha, N.; Shinu, P. Pharmaceutics. 2021, 13(5), 2-16.
- Amaral, B. R.; Saatkamp, R. H.; Junior, A. E.; Kroth, R.; Argenta, D. F.; Rebelatto, E. R.; Caon, T. Mater Sci Eng C Mater Biol Appl. 2021, 119, 1-10.
- Jacob, S.; Nair, A. B.; Boddu, S. H.; Gorain, B.; Sreeharsha, N.; Shah, J. Pharmaceutics. 2021, 13(8), 1-39.
- Magni, A.; Agostoni, P.; Bonezzi, C.; Massazza, G.; Menè, P.; Savarino, V.; Fornasari, D. Pain Ther. 2021, 10(2), 783-808.
- Menshikova, I.; Zakharova, O. Curr TrendsBiotechnol Pharm. 2021, 15(2), 164-171.
- Chinthaginjala, H.; Ahad, H. A.; Srinivasa, S. K.; Yaparla, S. R.; Buddadasari, S.; Hassan, J. A.; Pullaganti, S. Ind J Pharm Edu Res. 2023, 57(4), 983-992.
- Tejada, G.; Barrera, M. G.; Piccirilli, G. N.; Sortino, M.; Frattini, A.; Salomón, C. J.; Leonardi, D. AAPS Pharm scitech. 2017, 18, 936-946.
- Haju, S. S.; Yadav, S. Int J Pharm Pharm Sci.2021,13(9), 34-43.
- Ashri, L. Y.; Amal El Sayeh, F.; Ibrahim, M. A.; Alshora, D. H. J DrugDeliv Sci Technol.2020, 57, 101720-101728.
- Arslan, D.; Akbal Dağıstan, O.; Sagirli, O.; Mulazimoglu, L.; Cevher, E.; Yildiz-Pekoz, A. AAPS PharmSciTech. 2022, 24(1), 23-30.
- Mady, O.; Hussien, S.; Abdelkader, D. H.; ElZahaby, E. Pharm Dev Technol. 2023, 28(7), 650-659.
- Dangre, P. V.; Phad, R. D.; Surana, S. J.; Chalikwar, S. S. Advances in Polymer Technology.2019, 1, 1-13.
- Ammanage, A.; Rodriques, P.; Kempwade, A.; Hiremath, R. Futur J Pharm Sci. 2020,6, 1-11.
- Nair, A. B.; Kumria, R.; Harsha, S.; Attimarad, M.; Al-Dhubiab, B. E.; Alhaider, I. A. J Control Release. 2013,166(1), 10-21.
- Arpa, M. D.; Yagcılar, A. P.; Biltekin, S. N. J Drug Deliv Sci Technol. 2023, 84, 104497-104501
- Surini, S.; Gotalia, F.; Putri, K. S. Int J Appl Pharm. 2018, 10(1), 225-229.
- Ali, M. A. M.; Sabati, A. M.; Ali, B.A.; FABAD Journal of Pharmaceutical Sciences.2017, 42(3), 179-190.
- Begum, M. Y.; Alqahtani, A. Trop J Pharm Res. 2021, 20(11), 2241-2248.
- Mahapatra, A. P.; Nagvenkar, S. P.; Gude, R. J Adv Med Pharm Sci. 2020, 22(2), 9-20.
- Thorat, V. M.; Sarankar, S. K. J Surv Fish Sci. 2023, 10(6), 183-197.
- El-Say, K. M.; Al-Hejaili, O. D.; El-Sawy, H. S.; Alhakamy, N. A.; Abd-Allah, F. I.; Safo, M.K.;Ahmed,T.A. DrugDeliv Transl Res. 2023, 13(9), 2297-2314.
- Hanif, S.; Sarfraz, R. M.; Syed, M. A.; Ali, S.; Iqbal, Z.; Shakir, R.; Iqbal, J. Am. J. Pharm. 2021,40(4), 670-681.
Accepted on: 15 Sep 2025
Second Review by: Dr. Abdul Ahad
Final Approval by: Dr. Tanay Pramanik


![]()


