Fabrication of DSSCs using Malachite Green and Toluidine Blue (Dye Mix.): Enhancing Efficiency Via Surfactant and Metal Salt Interaction
Department of Chemistry, Govt. Lohia College Churu, Rajasthan, India
Department of Chemistry (GCRC), Govt. Dungar College Bikaner, Rajasthan, India
Corresponding Author E-mail:vinod.chem04@gmail.com
DOI : http://dx.doi.org/10.13005/ojc/410520
Download this article as:
![]()
Dye-sensitized solar cells (DSSCs) have gained significant attention due to their cost-effectiveness and tunable properties for photovoltaic applications. This study focuses on the optimization and fabrication of DSSCs using a mixed dye system comprising Malachite Green and Toluidine Blue (Dye System I). The influence of surfactants (SDS, HTAB, and Brij 35) and metal salts cobalt nitrate (Co(NO3)2 and terbium chloride (TbCl3) along with deoxycholic acid (DCA) was systematically investigated to enhance efficiency. All dye sets have been systematically analyzed for their spectral and electrochemical parameters. The D1B5 (DSSC) system based on Brij35 exhibited a maximum power conversion efficiency of 0.581%.
KEYWORDS:DSSC; Dye; Efficiency; Metal salt; Surfactant
Introduction
The global energy sector predominantly depends on fossil fuels, which contribute to carbon dioxide emissions and deplete finite resources, posing challenges to long-term sustainability. Fluctuating fuel prices and environmental damage from harmful gas emissions further exacerbate concerns about conventional energy sources. Renewable energy alternatives offer a more sustainable and eco-friendly approach to energy consumption.1, 2 Among these, solar energy has received considerable attention and is classified into two main types based on its application: photovoltaic and photo thermal. The direct conversion of sunlight into electricity, known as the photoelectric effect, forms the basis of photovoltaic (PV) cells or solar cells, which are both environmentally sustainable and clean.3-5 The photovoltaic effect was first observed by Edmund Becquerel in 1839 when he detected an electric current generated by light interacting with a silver-platinum electrode submerged in an electrolyte solution. Nearly four decades later, the discovery of selenium photoconductivity led to the first photovoltaic devices.6,7 Reducing material consumption in solar cells is one approach to minimizing costs, but increasing temperatures negatively impact their efficiency.7,9 Conventional solar concentrators require precise solar tracking to ensure optimal light focus, yet the necessary motors and electronics add to the system’s expense. As global energy demand continues to rise, advancements in solar energy technologies have become essential to reducing dependence on diminishing coal and natural resources.9-12 Dye-sensitized solar cells (DSSCs) are photoelectrochemical devices that convert light into electrical energy. Introduced by O’Regan and Grätzel in 1991, DSSCs have gained popularity due to their high efficiency, simple fabrication process, eco-friendly nature and cost-effectiveness. The structure of a DSSC includes a nanocrystalline TiO2 layer adsorbed with dye, deposited on a transparent conducting oxide (TCO) as the working electrode, a graphite layer as counter electrode, and an electrolyte containing iodide/triiodide redox reagents. The dye plays a crucial role in light absorption and overall energy conversion efficiency.11-17 This study focuses on the performance analysis of DSSCs utilizing Dye System I, which consists of malachite green and toluidine blue.
Experimental
This section focuses on the required materials and the preparation of the dye solutions, surfactant, electrolyte, working electrode, and counter electrode.
Materials
FTO glass slide ( 50* 50* 2.2) mm, Resistivity- 7 ohm/sq, TiO2 nanoparticles Anatase ( Ultra nanotech) Toluidine blue dye, Malachite green dye, Surfactants( SDS, HTAB, Brij 35), Ethanol, DD Water, Hydrochloric acid (HCl), Glacial Acetic Acid, Triton X-100, Electrolyte ( KI+I2 ), Ethylene glycol, Acetonitrile, Graphite pencil, Cobalt nitrate, Tb salt(TbCl3), Deoxycholic acid ( DCA) etc.
Methods
Preparation of working electrode
The FTO glass sheets were first subjected to washing and thermal treatment, followed by an ethanol wash. The TiO₂ paste was prepared by combining 2.0 gm of TiO₂ nanoparticles (anatase) with 2 ml of glacial acetic acid and 2 ml of ethanol, and then the mixture was stirred continuously for 1 hour using a glass rod. Subsequently, the paste was treated with 2–3 drops of Triton X-100 to maintain homogeneity and then placed on a magnetic stirrer for 24 hours to ensure uniform dispersion of nanoparticles in glacial acetic acid.
This paste was then uniformly applied on active side of FTO glass plate by doctor blade method by covering three side of the glass by scotch tape leaving 1cm2 active surface for pasting. The paste was evenly spread across the exposed surface with a glass rod, maintaining a consistent thickness of 10-12 μm. After allowing the semiconductor-coated glass to dry for 30 minutes at room temperature, it was calcined at 500˚C for 1 hour to ensure strong adhesion of the TiO₂ layer to the FTO glass. The slides were then left to cool. Meanwhile, a dye mixture was prepared, and the TiO₂-coated FTO glass slides were immersed in the dye solution (Toluidine blue- Malachite green) for 24 hours to facilitate dye adsorption. Afterward, the slides were washed with solvents to remove any unabsorbed dye and left to dry in a dark environment at room temperature. Two edges of the glass sheet were covered with Scotch tape, leaving one edge exposed for the final circuit connection.
Preparation of Dye Mixtures solutions
Dye System I comprises 18 sets of dye mixtures. It is based on a mixture of malachite green and toluidine blue dyes, prepared using three different surfactants: SDS, HTAB, and Brij 35. These dye mixture sets have been modified by a metallic solution and deoxycholic acid (DCA).
Dye Solution 1
Malachite Green (0.125 gm) and Toluidine Blue (0.125 gm) dissolved in 100ml surfactant (SDS/HTAB/Brij35) solution. The surfactant solution was prepared separately in critical micelle concentration (CMC).
Dye Solution 2
90 ml of the previously prepared dye solution (containing 0.125 gm of Malachite Green and 0.125 gm of Toluidine Blue in 100 ml surfactants) was mixed with 10 ml of a DCA solution. DCA solution has prepared separately in surfactants (0.30 gm DCA in 50ml surfactant – SDS/HTAB/Brij35).
Dye Solution 3
1gm of cobalt nitrate (Co(NO₃)₂) dissolved in 50 ml surfactants solution (SDS/ HTAB/Brij35) and then it added to the dye solution (0.125 g Malachite Green and 0.125 g Toluidine Blue in 50ml surfactants- SDS/HTAB/brij35).
Dye Solution 4
1gm of terbium chloride (TbCl₃) dissolved in 50 ml surfactants solution (SDS/ HTAB/Brij35) and then incorporated into the dye solution (0.125gm Malachite Green and 0.125gm Toluidine Blue in 50 ml surfactants- SDS/HTAB/brij35).
Dye Solution 5
Prepared by mixing of 40 ml of metallic solution (1 gm of cobalt nitrate (Co(NO₃)₂) in 50 ml surfactants solution- SDS/ HTAB/ Brij35), 10 ml of DCA solution (0.30 gm DCA in 50ml surfactants-SDS/HTAB/Brij35) and 0.125 gm each of Malachite Green and Toluidine Blue dissolved in 50 ml of SDS HTAB/Brij35 solution.
Dye Solution 6
Prepared by mixing of 40 ml of metallic solution ( 1gm of TbCl3 in 50 ml surfactants solution- SDS/ HTAB/ Brij35), 10 ml of DCA solution ( 0.30 gm DCA in 50ml surfactants –SDS/HTAB/Brij35) and 0.125 gm each of Malachite Green and Toluidine Blue dissolved in 50 ml of SDS/ HTAB/Brij35 solution. The mixture of dyes in dye system 1, formulated using this process. All solutions are stored in amber-coloured reagent bottles to protect them from light.
Table 1: List of Synthesized Dye System I
| S. No. | Code | Dye | Surfactant | DCA | (Co(NO3)2 Salt Soln | TbCl3 Salt Soln |
| 1 | D1S1 | Dye Mixture I(Malachite Green and Toluidine Blue) |
SDS | * | * | * |
| 2 | D1S2 | Y | * | * | ||
| 3 | D1S3 | * | Y | * | ||
| 4 | D1S4 | * | * | Y | ||
| 5 | D1S5 | Y | Y | * | ||
| 6 | D1S6 | Y | * | Y | ||
| 7 | D1H1 | HTAB | * | * | * | |
| 8 | D1H2 | Y | * | * | ||
| 9 | D1H3 | * | Y | * | ||
| 10 | D1H4 | * | * | Y | ||
| 11 | D1H5 | Y | Y | * | ||
| 12 | D1H6 | Y | * | Y | ||
| 13 | D1B1 | Brij 35 | * | * | * | |
| 14 | D1B2 | Y | * | * | ||
| 15 | D1B3 | * | Y | * | ||
| 16 | D1B4 | * | * | Y | ||
| 17 | D1B5 | Y | Y | * | ||
| 18 | D1B6 | Y | * | Y |
Dye mixture sets have been formulated with three surfactants—SDS, HTAB, and Brij 35. Each surfactant includes six sets of dye mixtures, and a total of 18 sets have been examined.
Preparation of counter electrode
First of all clean the FTO glass slide and then check its conductive side by digital multimeter. Counter electrode shows catalytic activity, it prepared by rubbing graphite pencil on FTO glass. This glass slide is placed in a furnace at 350°C for 45 minutes, then allowed to cool at room temperature.
Preparation of electrolyte solution
The iodide/triiodide redox electrolyte is commonly used in DSSCs due to its slow recombination kinetics and its ability to regenerate the oxidized dye. The electrolyte solution is prepared by dissolving 0.05M I2 and 0.5M KI in a mixture of ethylene glycol and acetonitrile. The solution is stirred thoroughly and stored in a dark bottle.
DSSC Assembly
The iodide/triodide (I⁻/I₃⁻) liquid electrolyte was applied to the dye –adsorbed TiO₂ plate
(working electrode) using a dropper. The counter electrode was then positioned above the working electrode, creating a sandwich structure, with two edges left exposed for electrical connection. The two conductive plates were hold together using alligator clips, and any electrolyte leakage was wiped away with tissue paper.
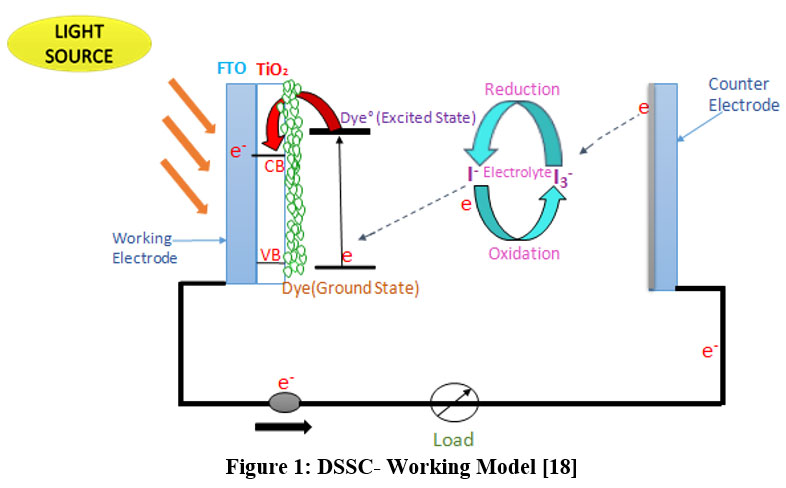 |
Figure 1: DSSC- Working Model18 |
The DSSC setup has connected to a circuit to measure current and voltage, and placed under a light source for observation.
Result and Discussion
This part focuses on the characterization and I-V curve of Dye system I. The nanoparticle (TiO2) crystal structure, morphology and porosity examined by X-ray diffraction (XRD), scanning electron microscopy (SEM) and the synthesized dye samples were analyzed using UV-Vis spectroscopy to evaluate their optical and structural properties.
SEM and XRD Analysis
The efficiency of dye-sensitized solar cells (DSSCs) is influenced by the surface structure of the TiO2 semiconductor plate, where increased porosity enhances dye molecule deposition, improving photon absorption and thereby increasing conductivity through an elevated open-circuit voltage (Voc). Before assembling the anode, SEM imaging is used to confirm the appropriate morphology of the materials. Different magnifications levels help analyze the structural arrangement and depth, ensuring an accurate representation of morphology. In this study, SEM images have observed at magnifications of 40,000× and 100,000× (Figures a and b) to illustrate the TiO2 layer’s morphology on the DSSC conductive transparent slide. The SEM analysis revealed that the produced particles have a spherical morphology with excellent dispersion. SEM images of the FTO glass slide coated with the TiO2 layer, displayed at different magnifications, highlight significant morphological features of the nanoparticles. At 40,000× magnification (Figure a), the particles exhibit a spherical shape with a relatively uniform distribution, indicating a well-defined TiO2 layer. At a higher magnification of 100,000× (Figure b), the nanoparticles appear more distinct, with improved visibility of their spherical shape and surface texture. The reduced agglomeration at this scale indicates better dispersion, which is crucial for efficient electron transport in DSSC applications. The observed morphology suggests that high calcination temperatures significantly contributed to crystallite growth, thereby enhancing the structural stability of the TiO2coating. The overall microstructure indicates the formation of a stable and uniform TiO2 layer, making it suitable for photovoltaic and photocatalytic applications.
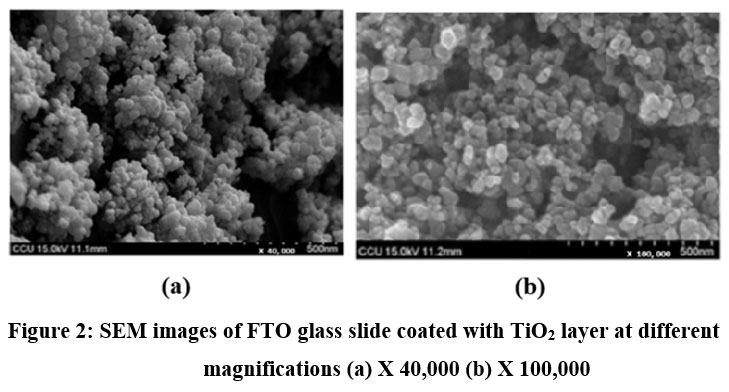 |
Figure 2: SEM images of FTO glass slide coated with TiO2 layer at different magnifications (a) X 40,000 (b) X 100,000 |
In this study, TiO2 nanoparticles were analyzed in their powdered form after grinding. The XRD pattern of the TiO2 nanoparticles confirms their crystalline structure, as indicated by distinct diffraction peaks.19
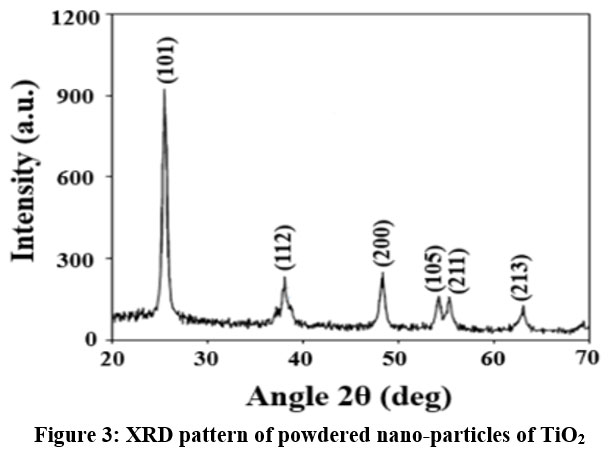 |
Figure 3: XRD pattern of powdered nano-particles of TiO2 |
The most prominent peak, appearing at approximately 25.3°, corresponds to the (101) plane, which is characteristic of the anatase phase of TiO2. Additional diffraction peaks at 37.8°, 48.0°, 53.9°, 55.1°, and 62.7° correspond to the (112), (200), (105), (211), and (213) planes, respectively, further affirming the presence of the anatase crystalline phase. The sharp and intense peaks reflect high crystallinity, suggesting that the nanoparticles underwent effective thermal treatment during synthesis. The absence of notable peaks associated with the rutile or brookite phases confirms the dominance of the anatase phase, which is highly desirable for applications such as photocatalysis and dye-sensitized solar cells (DSSCs) due to its superior charge transport properties.
Dye-Surfactants Interaction
The molecular structure and charge of surfactants significantly impact the efficiency and stability of DSSCs. Surfactants’ charge affects electrostatic interactions between dye molecules and the TiO₂ photoanode surface, affecting dye loading and electron injection efficiency. Structural features such as hydrophobic chain length and head group polarity dictate micelle formation and dispersion of dye molecules.20,21 Three surfactants (SDS, HTAB, and Brij 35) have been used in the dye system I. SDS reduces cationic dye aggregation and enhances the effective dispersion of dyes. HTAB enhances dye anchoring but posing a risk of aggregation and charge recombination. Brij 35 provides steric stabilization, uniform dye dispersion, and minimizes aggregation due to its non ionic nature. Consequently, Brij 35 is crucial in improving the stability and efficiency of DSSCs. These interactions enhance light absorption, electron injection efficiency, and overall photovoltaic performance of the DSSC system.21-23
UV-Vis Characterization
The spectral characteristics of these dye mixture set were examined using a UV-Visible spectrophotometer. The dyes were prepared and analyzed in darkness over a wavelength range of 300 nm to 800 nm to assess their spectral behavior in a specific surfactant.
The study results for Dye System I, where SDS was used as the surfactant, demonstrated significant variations in absorption maxima (λmax) and absorption intensity (Emax) depending on the presence of DCA and metal salts. The base dye-SDS system (D1S1) showed a λmax of 672 nm with an absorption intensity of 1.218. The addition of DCA (D1S2) resulted in a slight hypsochromic shift to 663 nm, along with a minor increase in Emax to 1.244, suggesting that DCA contributed to stabilizing the dye molecules.
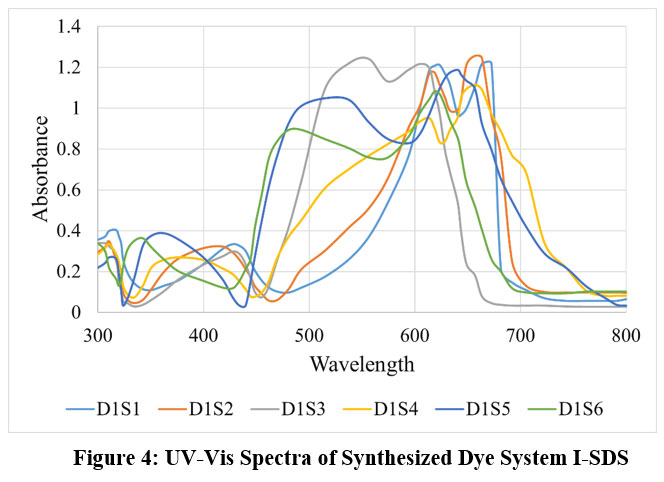 |
Figure 4: UV-Vis Spectra of Synthesized Dye System I-SDS. |
The introduction of Co(NO3)2 salt (D1S3) caused a substantial hypsochromic shift to 556 nm while maintaining a similar Emax of 1.240, indicating that metal-dye complex formation altered electronic transitions. The presence of TbCl3 salt (D1S4) led to a bathochromic shift to 657 nm and a reduction in absorption intensity to 1.114, suggesting possible energy transfer or quenching effects. When DCA was combined with Co(NO3)2 (D1S5), the absorption peak shifted further hypsochromically to 643 nm, with a decrease in Emax to 1.163, implying changes in dye aggregation or solvation behaviour. The combination of DCA with TbCl3 salt (D1S6) resulted in an even greater shift to 618 nm, accompanied by the lowest Emax (1.081), indicating significant interactions affecting the dye’s photophysical properties.
The spectral analysis of Dye System I, where HTAB was used as the surfactant, revealed distinct shifts in absorption maxima (λmax) and absorption intensity (Emax) based on the presence of DCA and metal salts. The base dye-HTAB system (D1H1) exhibited a λmax of 682 nm with an Emax of 1.180. The addition of DCA (D1H2) led to a hypsochromic shift to 666 nm, accompanied by a slight increase in Emax to 1.210, suggesting that DCA influenced the dye environment by potentially reducing aggregation. When Co(NO3)2 salt were introduced (D1H3), λmax shifted notably to 620 nm, with a minor increase in Emax to 1.191, indicating strong interactions between the dye and metal ions that altered electronic transitions.
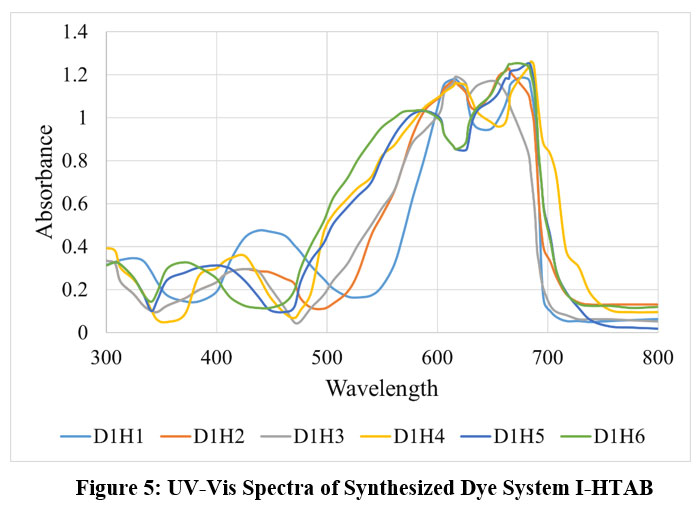 |
Figure 5: UV-Vis Spectra of Synthesized Dye System I-HTAB. |
The presence of TbCl3 salt alone (D1H4) caused a bathochromic shift to 687 nm, along with an increase in Emax to 1.248, likely due to energy transfer or enhanced dye stability. The combination of DCA with Co(NO3)2 salt (D1H5) resulted in a λmax of 684 nm with a high Emax of 1.240, indicating a stabilizing effect of DCA on the dye-metal complex. When DCA was combined with TbCl3 salt (D1H6), a further hypsochromicshift to 673 nm was observed, with the highest Emax of 1.255, suggesting that the combined influence of DCA and rare-earth metals modulated the dye’s photophysical properties, potentially enhancing fluorescence efficiency.
The spectral analysis of Dye System I with Brij 35 as the surfactant demonstrated notable changes in absorption maxima (λmax) and absorption intensity (Emax) due to interactions with DCA and metal salts. The base dye-Brij 35 system (D1B1) showed a λmax of 610 nm and an Emax of 1.204, reflecting the initial electronic environment of the dye in the micellar medium. The addition of DCA (D1B2) caused a bathochromic shift to 624 nm and a slight decrease in Emax to 1.179, suggesting possible dye-solvent interactions or changes in aggregation behavior. When Co(NO3)2 salt were introduced (D1B3), λmax shifted slightly to 622 nm while Emax remained at 1.204, indicating that the metal ions influenced absorption but had minimal impact on fluorescence intensity. The inclusion of TbCl3 salt (D1B4) led to a λmax of 624 nm with a further decrease in Emax to 1.172, suggesting energy transfer or partial fluorescence quenching.
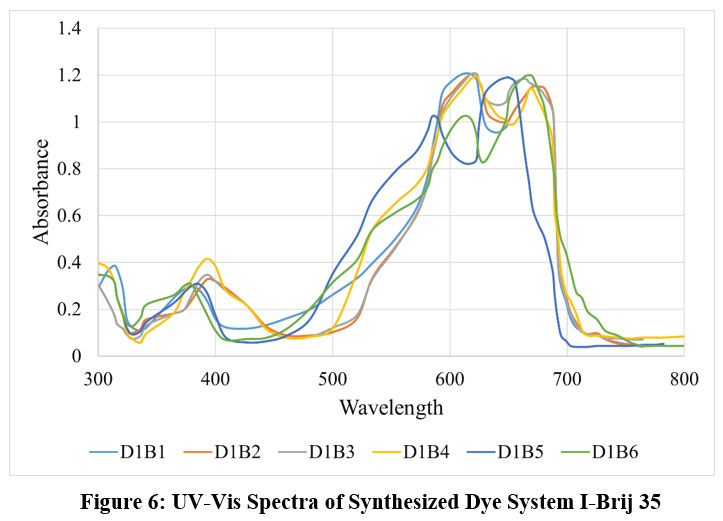 |
Figure 6: UV-Vis Spectra of Synthesized Dye System I-Brij 35. |
The combination of DCA with Co(NO3)2 salt (D1B5) resulted in a significant shift to 655 nm, accompanied by a reduction in Emax to 1.165, indicating strong interactions affecting electronic transitions. The most pronounced shift was observed in D1B6, where the combination of DCA with TbCl3 salt caused λmax to move to 670 nm with an Emax of 1.194, suggesting enhanced dye-metal complex formation and possible stabilization of the excited state. The UV–Vis spectral study indicated shifts and peak broadening consistent with dye–surfactant interactions, as reported previously.22-25
I-V Characterization of Fabricated DSSCs
Following optical characterization, DSSC modules were fabricated and tested for efficiency. Various electrochemical and device performance parameters were examined across multiple systems. The current-voltage (I-V) characteristics were assessed using a digital multimeter, measuring open-circuit voltage (Voc), short-circuit current (Isc), maximum power point (Pmax), characteristic resistance (RCH), fill factor (FF), and overall conversion efficiency (η). The fabricated DSSCs were evaluated for voltage and current using a variable load resistor in a circuit. Under AM1.5G illumination at 100 mW/cm², Voc and Isc were observed and generating an I-V curve. Upon light exposure, the cell initially exhibits zero potential with maximum current. Over time, the potential steadily increases while the current decreases, eventually reaching a state where the current drops to zero, marking the completion of the measurement process.
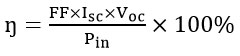
Fill Factor (FF): The fill factor calculated by
![]()
Efficiency of the Cell (η): The power conversion efficiency (η), a critical parameter of a DSSC computed as follows:
The I-V characterization results for the dye-surfactant system with SDS (Sodium Dodecyl Sulfate) highlight the influence of different additives, including deoxycholic acid (DCA), Cobalt nitrate solution, and terbium (III) chloride solution, on key electrochemical parameters. The base system (D1S1), consisting solely of the dye mix and SDS, exhibits a Voc of 0.902 V, Isc of 0.563 mA, and FF of 0.403, and an efficiency of 0.204%. However, the addition of DCA (D1S2) results in a decline across all parameters, with Voc dropping to 0.812 V and efficiency reduces to 0.139%. This suggests that while DCA enhances dye adhesion to TiO2, it may also hinder charge transfer when used alone with SDS. Introducing cobalt nitrate solution (D1S3) leads to significant improvement, with Isc rising to 0.915 mA and efficiency increasing to 0.421%, indicating that these metal salt enhance charge separation and electron transport. Likewise, the system containing only terbium (III) chloride solution (D1S4) exhibits improved performance, with Voc reaching 0.992 V, Isc at 0.648 mA, and an efficiency of 0.333%, are highlighting the role of rare-earth elements in optimizing charge transfer.
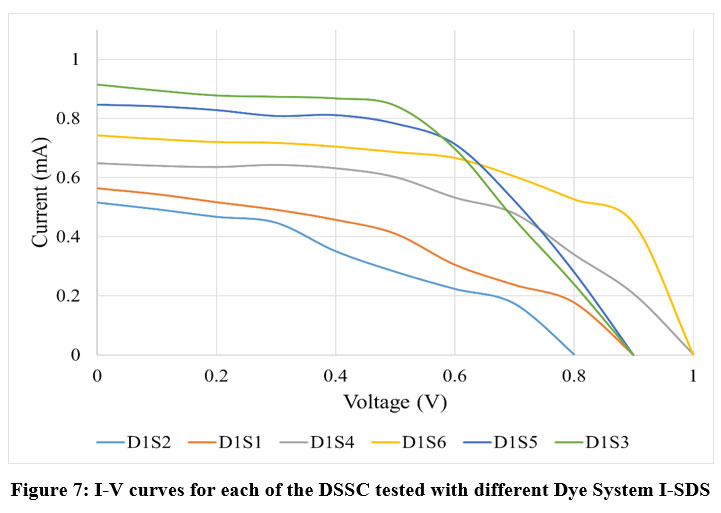 |
Figure 7: I-V curves for each of the DSSC tested with different Dye System I-SDS. |
The combination of DCA with cobalt nitrate (D1S5) solution results in the best overall performance, with Voc at 0.912 V, Isc at 0.846 mA, and an efficiency of 0.427%, suggesting a synergistic effect where DCA improves dye stability while Co(NO3)2 enhance electron transport. Similarly, D1S6, which incorporates both DCA and terbium (III) chloride solution, achieves Voc of 0.987 V, Isc of 0.743 mA, and an FF of 0.576, leading to an efficiency of 0.422%. This confirms that rare-earth metals contribute to improved charge carrier dynamics and overall photovoltaic efficiency.
Table 2: Electrochemical properties of Synthesized Dye System I-SDS
| S. No. | Code | Dye | Surfactant | DCA | Co Salt Soln | Tb Salt Soln | Voc (V) | Isc (mA) | FF | η (%) | RCH (Ω) |
| 1 | D1S1 | Dye MixI |
SDS |
* | * | * | 0.902 | 0.563 | 0.403 | 0.204 | 1.218 |
| 2 | D1S2 | Y | * | * | 0.812 | 0.515 | 0.334 | 0.139 | 1.776 | ||
| 3 | D1S3 | * | Y | * | 0.895 | 0.915 | 0.515 | 0.421 | 0.592 | ||
| 4 | D1S4 | * | * | Y | 0.992 | 0.648 | 0.519 | 0.333 | 1.463 | ||
| 5 | D1S5 | Y | Y | * | 0.912 | 0.846 | 0.554 | 0.427 | 0.840 | ||
| 6 | D1S6 | Y | * | Y | 0.987 | 0.743 | 0.576 | 0.422 | 1.157 |
The I-V characterization results for the dye-surfactant system with HTAB (Hexadecyltrimethylammonium Bromide) highlight the impact of various additives, including deoxycholic acid (DCA), Co(NO3)2 and TbCl3 salt solution, on photovoltaic performance parameters. The base system (D1H1), consisting only of the dye mix and HTAB, exhibits a Voc of 0.903 V, an Isc of 0.552 mA, a relatively high FF of 0.623, and an efficiency of 0.31%. However, the addition of DCA (D1H2) results in a decline in Voc (0.805 V) and FF (0.441), leading to a reduced efficiency of 0.211%. This suggests that while DCA stabilizes dye molecules, it does not significantly enhance charge transfer when used alone with HTAB. The introduction of cobalt nitrate solution (D1H3) leads to a notable increase in Isc to 0.883 mA, improving efficiency to 0.391%, indicating that these metal salts promote better charge separation and electron transport. When terbium (III) chloride solution is incorporated instead (D1H4), the system achieves the highest Voc of 0.996 V, along with an Isc of 0.674 mA, resulting in an efficiency of 0.339%. This demonstrates the potential of rare-earth elements in enhancing electron mobility and improving DSSC performance.
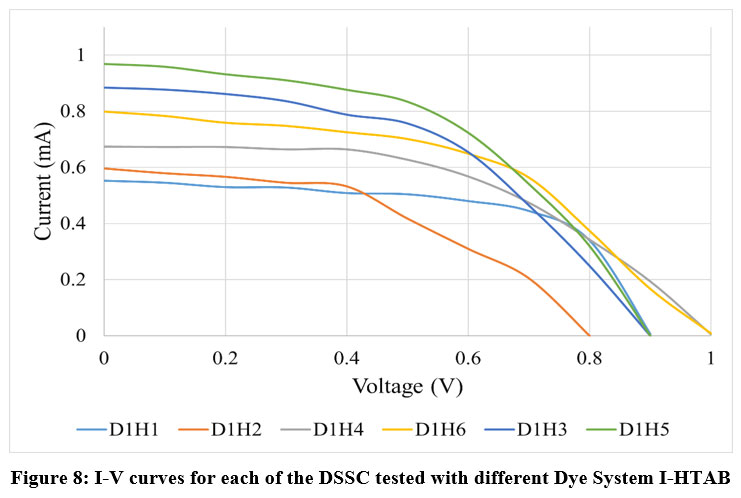 |
Figure 8: I-V curves for each of the DSSC tested with different Dye System I-HTAB. |
The combination of DCA with cobalt nitrate solution (D1H5) further improves performance, yielding a Voc of 0.867 V, an Isc of 0.968 mA, and the highest efficiency of 0.433%, making it the most effective combination. Similarly, the presence of both DCA and TbCl3 salt (D1H6) leads to strong performance, achieving a Voc of 0.987 V, an Isc of 0.798 mA, and an efficiency of 0.393%. These findings emphasize the critical role of metal salts, particularly Co(NO3)2 and TbCl3 salts enhancing photovoltaic efficiency.
Table 3: Electrochemical properties of Synthesized Dye System I-HTAB
| S. No. | Code | Dye | Surfactant | DCA | Co Salt Soln | Tb Salt Soln | Voc (V) | Isc (mA) | FF | η (%) | RCH (Ω) |
| 1 | D1H1 | Dye MixI
|
HTAB |
* | * | * | 0.903 | 0.552 | 0.623 | 0.31 | 1.575 |
| 2 | D1H2 | Y | * | * | 0.805 | 0.596 | 0.441 | 0.211 | 0.751 | ||
| 3 | D1H3 | * | Y | * | 0.902 | 0.883 | 0.492 | 0.391 | 0.917 | ||
| 4 | D1H4 | * | * | Y | 0.996 | 0.674 | 0.506 | 0.339 | 1.056 | ||
| 5 | D1H5 | Y | Y | * | 0.867 | 0.968 | 0.517 | 0.433 | 0.829 | ||
| 6 | D1H6 | Y | * | Y | 0.987 | 0.798 | 0.5 | 0.393 | 1.242 |
The I-V characterization results for the dye-surfactant system with Brij 35 demonstrate the impact of deoxycholic acid (DCA), Co(NO3)2 and TbCl3 salt solution on key photovoltaic parameters.
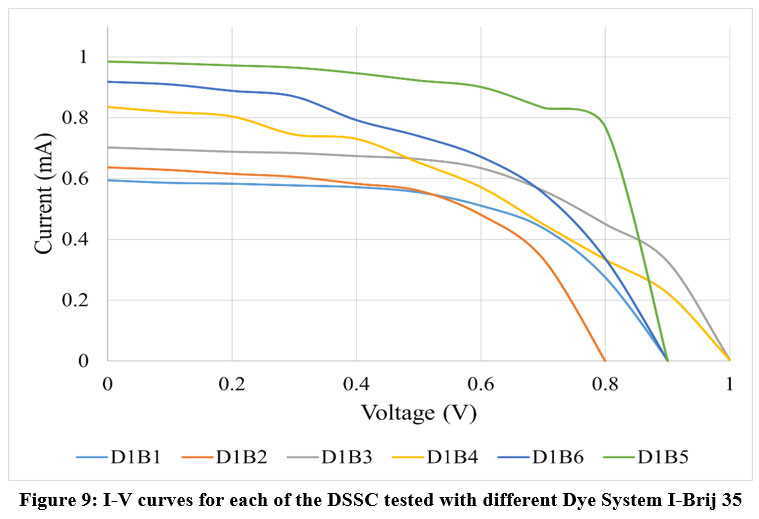 |
Figure 9: I-V curves for each of the DSSC tested with different Dye System I-Brij 35. |
The baseline system (D1B1), consisting of only the dye mix and Brij 35, shows a Voc of 0.912 V, an Isc of 0.594 mA, and a moderate FF of 0.564, resulting in an efficiency of 0.305%. Adding DCA (D1B2) slightly reduces Voc to 0.802 V but increases Isc to 0.637 mA. However, the overall efficiency drops slightly to 0.287%, suggesting that DCA alone does not significantly enhance charge transfer in the Brij 35 system. Introducing cobalt nitrate solution (D1B3) leads to a Voc increase to 0.984 V and an Isc of 0.702 mA, improving efficiency to 0.391%. This indicates that these metal salt effectively promote charge separation and electron mobility. Meanwhile, the addition of terbium (III) chloride salt (D1B4) results in a Voc of 0.954 V and a higher Isc of 0.835 mA, but a lower FF (0.43), leading to an efficiency of 0.342%. This suggests that while rare-earth elements enhance current generation, their effect on charge retention and recombination requires further optimization. The best-performing combination, D1B5, incorporates both DCA and Co(NO3)2 solution, achieving an Isc of 0.984 mA, FF of 0.663, and the highest efficiency of 0.581% among all Brij 35-based systems[26].This confirms the synergistic effect of DCA and cobalt nitrate salt solution enhancing charge transfer and stability. Finally, D1B6, which includes DCA and TbCl3 salt solution, records a Voc of 0.904 V, an Isc of 0.917 mA, and an efficiency of 0.401%, showing moderate improvement over the control.
Table 4: Electrochemical properties of Synthesized Dye System I-Brij 35
| S. No. | Code | Dye | Surfactant | DCA | Co Salt Soln | Tb Salt Soln | Voc (V) | Isc (mA) | FF | η (%) | RCH (Ω) |
| 1 | D1B1 | Dye Mix I | Brij 35 | * | * | * | 0.912 | 0.594 | 0.564 | 0.305 | 1.174 |
| 2 | D1B2 | Y | * | * | 0.802 | 0.637 | 0.563 | 0.287 | 1.246 | ||
| 3 | D1B3 | * | Y | * | 0.984 | 0.702 | 0.567 | 0.391 | 1.248 | ||
| 4 | D1B4 | * | * | Y | 0.954 | 0.835 | 0.43 | 0.342 | 1.049 | ||
| 5 | D1B5 | Y | Y | * | 0.892 | 0.984 | 0.663 | 0.581 | 0.840 | ||
| 6 | D1B6 | Y | * | Y | 0.904 | 0.917 | 0.484 | 0.401 | 0.893 |
The overall photovoltaic performance of the reported DSSCs is well supported by many researchers’ studies [25-27].
Conclusion
The study successfully analyzed the synthesized materials using UV-Vis spectroscopy, XRD, and SEM, confirming their potential for DSSC applications. The UV-Vis spectra showed strong absorption in the visible region, with bathochromic shifts indicating enhanced conjugation for efficient charge transfer. XRD analysis verified the anatase phase of TiO2 with high crystallinity, which is crucial for effective charge transport. SEM imaging revealed a porous and uniform TiO2 film, promoting better dye adsorption and electron mobility. The I-V characterization of DSSCs incorporating various surfactants, metal salts, and deoxycholic acid (DCA) demonstrated the influence of these additives on photovoltaic performance. Metal salt solution, particularly cobalt nitrate (Co(NO3)2 significantly enhanced charge separation and electron transport. While DCA alone reduced efficiency, its combination with metal salts led to optimal results. Among the surfactants tested, Brij 35 showed the highest efficiency (η = 0.581%), indicating superior dye dispersion and charge transfer. The findings suggest that the synergistic combination of Co(NO3)2 salt, Brij 35, and DCA provides the best performance, offering valuable insights for future DSSC optimization.
Acknowledgement
The authors express their gratitude to the GCRC, P.G. Department of Chemistry, Government Dungar College (A-Grade), MGS University, Bikaner, Rajasthan (India), for providing excellent facilities for the experimental research work.
Funding Sources
The author(s) received no financial support for the research, authorship, and/or publication of this article.
Conflict of Interest
The author(s) do not have any conflict of interest.
Data Availability Statement-
This statement does not apply to this article.
References
- Khan, J.; Arsalan, M.H.; Sustain. Energy Rev., 2016, 55, 414–425.
CrossRef - Woolfson, M.M. Astron Geophys., 2000, 41(4), 4.10–4.15.
- Kodigala, S.R.Thin films and nanostructures., 2010, 35, 1–19.
CrossRef - Jha, A.R. Solar cell technology and applications., 2010, CRC Press.
CrossRef - Perlin, J. From Space to Earth: The Story of Solar Electricity., 2002, Harvard University Press.
- Ghitas, A.; Ruzinsky, M.; Saly, V. World Renewable Energy Congress VI., 2000, 2089–2092.
CrossRef - Green, M. A. Solar Cells: Operating Principles, Technology, and System Applications., 1982, Prentice-Hall.
- Green, M. A. Photovolt. Res. Appl., 2003, 11(5), 333–340.
- Mansour, A.F.; Killa, H.M. A.; El-Wanees, S.A.; El-Sayed, M.Y. Polym Test. 2005, 24(4),519–525.
CrossRef - Nursama, N.M.; Muliani, L. J. Technol., 2012, 2, 129–139.
- Deepak, T.G.;Anjusree. G.S.; Pai, K, N.; Subash, D.; Nair, S.V.; Nair, A.S.RSC Adv.2014, 4, 23299–23303.
CrossRef - Lim, A.; Haji Manaf, N.; Tennakoon, K.; Chandrakanthi, R.L.N.; Lim, L.B.L.; Bandara, J.M.R.S. J Biophys.,2015, 1–8.
CrossRef - Guo, K. Li. M.; Fang, X.; Liu, X.; Sebo, B.; Zhu, Y. Power Sources., 2013, 230, 155–160.
CrossRef - Lee, T.Y.; Alegaonkar, P.S.; Yoo, J.B. Thin Solid Films. 2007, 515, 5131–5135.
CrossRef - Karthick, S.N.; Hemalatha, K.V.; Raj, C.J.; Kim, H.J.;Moonsuk, Y. Ceram Process Res. 2012, 13,136–139.
- O’Regan, B.; Grätzel, M. A. , 1991, 353,737–740.
CrossRef - Gangotri, K. M.; Lal, C. Energy , 2001, 23, 267–273.
CrossRef - Onah, E.H.; Lethole, N.L.; Mukumba, P. Sci.,2024, 14, 9202.
CrossRef - Thamaphat, K.; Limsuwan, P.; Ngotawornchai, B. Kasetsart J. Nat. Sci., 2008, 42, 357–361.
- Barni, E.; Savarino, P.; Viscardi, G. Chem. Res.,1991, 24 98–103
CrossRef - Holmberg, K., Ed. Surfactants and Polymers in Aqueous Solution., 2003, Wiley.
CrossRef - Gangotri, K. M.; Meena, J. Energy Sources., Part A 2006, 28 (8), 771–777.
CrossRef - Saini, S. R.; Meena, S. L.; Meena, R. C. Chem. Eng. Sci., 2017, 7, 125–136.
CrossRef - Rathore, J.; Arya, R. K.; Sharma, P.; Lal, M. J. Chem. Environ., 2022, 26 (6), 24–29.
CrossRef - Rathore, J.; Arya, R. K.; Sharma, P.; Lal, M. J. Sci. Tech., 2022, 15 (23), 1159–1165.
CrossRef - Mohan, L.; Gangotri, K.M. J. Energy Res., 2022, 46(14), 19538-19547.
CrossRef - Mahavar, C.; Soni, V.; Genwa, K. R. i-manager’s Mat. Sci., 2019, 6(4), 45-58.
Accepted on: 11 Sep 2025
Second Review by: Dr. K M Gangotri
Final Approval by: Dr. Ioana Stanciu


![]()


