Computational Investigation of Rifampicin as a Multitarget Inhibitor of Melanin Biosynthesis via Molecular Docking and Dynamics Simulations
 , Yang Xu and Chang-Gu Hyun*
Jeju Inside Agency and Cosmetic Science Center, Department of Chemistry and Cosmetics, Jeju National University, Jeju, Republic of Korea.
Corresponding AUthor E-mail: cghyun@jejunu.ac.kr
DOI : http://dx.doi.org/10.13005/ojc/410501
Download this article as:
![]()
Hyperpigmentation disorders, characterized by aberrant melanin accumulation, pose a significant clinical challenge, driving the search for novel therapeutic agents. Rifampicin, a clinically approved antibiotic, has recently emerged as a potential candidate for regulating melanogenesis, with preliminary evidence indicating it may target key proteins involved in melanin synthesis and signaling pathways—specifically tyrosinase-related protein 1 (TYRP1), phosphoinositide 3-kinase (PI3K), protein kinase A (PKA), p38 mitogen-activated protein kinase (p38 MAPK), and glycogen synthase kinase-3β (GSK-3β). To elucidate the underlying molecular mechanism, this study employed molecular docking and molecular dynamics (MD) simulations. Molecular docking analyses revealed strong binding of rifampicin to TYRP1 (−6.6 kcal/mol), p38 MAPK (−9.6 kcal/mol), PKA (−9.2 kcal/mol), and GSK-3β (−8.5 kcal/mol), with affinities comparable to or exceeding those of their native ligands. In contrast, its affinity for PI3K was lower (−7.8 kcal/mol), suggesting limited involvement in the PI3K/AKT pathway. MD simulations confirmed the stability of rifampicin-protein complexes, as evidenced by consistent root-mean-square deviation (RMSD), radius of gyration, and solvent-accessible surface area (SASA) values, alongside minimal residue fluctuations and stable hydrogen bonds. Gibbs free energy landscape analysis further validated the compact, stable nature of these complexes. MM/GBSA calculations yielded favorable binding free energies (ΔG_total: –50.07 to –30.8 kcal/mol), with van der Waals interactions identified as the primary driver of binding. Key interacting residues included Leu382 (TYRP1), Tyr35 (p38 MAPK), Lys896 (PKA), Ile62 (GSK-3β), and Phe439 (PI3K). These findings support a multitarget mechanism for rifampicin in melanogenesis regulation and underscore its potential for repurposing as a therapeutic agent for hyperpigmentation.
KEYWORDS:Molecular dynamics simulation; Melanogenesis; Protein–ligand interaction; Rifampicin
Introduction
Drug repurposing is a cost-effective strategy that accelerates clinical translation by exploring new uses for existing drugs.1-4 Its application in cosmeceutical development enables the safe and efficient transformation of well-characterized pharmaceuticals into functional skincare ingredients, offering significant advantages over traditional ingredient discovery.5 This strategy has already proven successful for several drugs, such as thalidomide6, aspirin7,8, sildenafil9,10, acetylsalicylic acid, and dimethyl fumarate11, and others.
Several pharmaceutical compounds have been successfully repurposed as active cosmetic ingredients. Clinically used skin-whitening agents, such as hydroquinone, inhibit tyrosinase activity and induce melanocyte cytotoxicity.12,13 In addition to tyrosinase inhibition, azelaic acid also suppresses thioredoxin reductase activity .14 Retinoids, such as retinol, are employed for anti-aging purposes.15 while tranexamic acid16,17 and cysteamine18 have demonstrated efficacy in inhibiting hyperpigmentation. Dexpanthenol is commonly used in sensitive-skin care due to its moisturizing and soothing properties.19,20 In addition, drugs like acenocoumarol (targeting NF-κB and MAPK pathways)21, miglitol (modulating PKA, MAPK, and GSK-3β/β-catenin signaling)22, imperatorin (activating PKA/CREB, ERK, AKT, and GSK-3β/β-catenin pathways)23, and tobramycin (enhancing p38 MAPK phosphorylation)24 have demonstrated regulatory effects on melanogenesis or inflammation, highlighting their potential applications in functional skincare product development.
Effective skin depigmentation strategies involve the inhibition of melanogenesis, downregulation of MITF transcriptional activity, modulation of the melanocortin 1 receptor (MC1R) signaling pathway, and suppression of melanosome transport.25 Melanin plays a critical role in maintaining skin pigmentation homeostasis and protecting against ultraviolet (UV) radiation damage.26 However, abnormal melanin accumulation can lead to various pigmentary disorders, including melasma, freckles, and post-inflammatory hyperpigmentation.27 During melanogenesis, tyrosinase (TYR) and its related enzymes TRP-1 and TRP-2 act as rate-limiting enzymes, all of which are transcriptionally regulated by the microphthalmia-associated transcription factor (MITF).28 Multiple intracellular signaling pathways—including Wnt/β-catenin, MAPK, PI3K/AKT, and cAMP/PKA/CREB—are involved in regulating the expression of MITF and its downstream targets.29,30
Rifampicin, a first-line broad-spectrum antibiotic used for treating tuberculosis and leprosy31-33, has recently garnered attention for its potential in pigmentation modulation due to its tyrosinase-inhibitory activity.34 In our previous study35, rifampicin (<40 μM) exhibited no significant cytotoxicity in B16F10 melanoma cells, while reducing intracellular melanin content and tyrosinase activity by ~20.24% and ~29.12%, respectively—comparable to the effect of 200 μM arbutin. Mechanistically, rifampicin suppressed MITF and its downstream targets (TYR, TRP-1, TRP-2), primarily via the PKA, p38 MAPK, and GSK-3β/β-catenin pathways, with minimal involvement of PI3K/AKT signaling. Similar anti-melanogenic effects were also observed in human epidermal melanocytes (HEMn-MP), indicating cross-species efficacy and translational relevance.
To elucidate the molecular mechanisms underlying rifampicin’s anti-melanogenic effects, an in silico study integrating molecular docking and MD simulations was conducted targeting five key melanogenesis-related proteins: TYRP1, PKA, p38 MAPK, GSK-3β, and PI3K. Binding affinities at the active sites were evaluated, followed by MD simulations to assess the stability of the complexes and characterize critical interactions. Subsequent trajectory analyses and free energy calculations provided molecular and thermodynamic insights, supporting rifampicin’s multi-target regulatory potential in melanogenesis and offering a structural basis for its repurposing in the treatment of pigmentary disorders.
Results and Discussion
Molecular Properties and Drug Likeness
In comparing the ADMET (Absorption, Distribution, Metabolism, Excretion, and Toxicity) properties of rifampicin and kojic acid, rifampicin exhibited several advantages. While kojic acid demonstrated superior Caco-2 permeability (0.637 cm/s) and higher human intestinal absorption (93.152%), rifampicin excelled in other critical aspects. It had a significantly higher plasma protein binding rate (77.7%) compared to kojic acid (23.3%), indicating a greater likelihood of maintaining therapeutic concentrations in circulation. Additionally, rifampicin was identified as a P-gp substrate with potential for improved cellular retention and effectively inhibited P-gp I activity. This inhibition may reduce the active efflux of substrates carried by P-gp36, potentially increasing rifampicin retention in cells and enhancing intestinal absorption and systemic bioavailability by improving membrane fluidity for better transmembrane transport.37
Regarding safety and toxicity, both compounds showed no hepatotoxicity, Ames toxicity, or skin sensitization; however, rifampicin’s hERG II inhibition suggested a greater potential for cardiac effects.38 Importantly, rifampicin’s volume of distribution (2.185 L/kg) indicated effective tissue penetration, whereas kojic acid showed a negative volume of distribution (-0.086 L/kg), implying limited distribution. Overall, rifampicin presented a more balanced profile, particularly in plasma protein binding and distribution characteristics, suggesting its suitability for therapeutic applications.
Table 1: Pharmacokinetic properties of the compounds.
| ADMET properties | Rifampicin | Kojic acid | |
| Absorption | |||
| Caco-2 permeability (cm/s) a | 0.383 | 0.637 | |
| P-gpⅠ protein inhibitor a | Yes | No | |
| P-gpⅡ protein inhibitor a | No | No | |
| P-gp substrate a | Yes | No | |
| Human intestinal absorption a | 56.061% | 93.152% | |
| Distribution | |||
| Plasma protein bindingb | 77.7% | 23.3% | |
| Volume distribution (log L/kg) a | 2.185 | -0.086 | |
| Blood–brain barrierc | No | No | |
| Metabolism | |||
| CYP450 | CYP1A2 inhibitor c | No | Yes |
| CYP2C19 inhibitor c | No | No | |
| CYP2C9 inhibitor c | No | No | |
| CYP2D6 inhibitor c | No | No | |
| CYP3A4 inhibitor c | No | No | |
| Excretion | |||
| Clearance rate (mL/min/kg) a | -0.558 | 0.638 | |
| T1/2 (h)b | 0.502 | 1.827 | |
| Toxicity | |||
| Hepatotoxicity a | No | No | |
| Ames toxicity a | No | No | |
| Skin sensitization a | No | No | |
| hERGⅠ inhibition a | No | No | |
| hERGⅡ inhibition a | Yes | No | |
| LD50 of acute toxicity (mol/kg) a | 2.552 | 2.037 | |
LD50: lethal dose 50; CYP450: cytochrome p450; T1/2: time required for the plasma concentration of a drug to decrease by 50%; hERG: human Ether-a-go-go-Related Gene; a: pkCSM; b: ADMETlab 3.0; c: admetSAR 3.0.
The drug-likeness predictions showed that rifampicin complied with the Pfizer Rule39 but did not meet the “rule of 5” (Ro5)40 or GSK Rule41 criteria, whereas kojic acid satisfied all three (Ro5, Pfizer, and GSK) criteria. Despite falling outside the Ro5 space, rifampicin achieved over 50% oral bioavailability, even with its high molecular weight (~800 Da) and six hydrogen bond donors.42 In contrast, rifaximin, with a zwitterionic pyridoimidazo nucleus, showed minimal intestinal absorption, suggesting that small structural differences could greatly influence absorption characteristics compared to rifampicin.43 High TPSA may restrict passive diffusion across cell membranes.44 but can enhance interactions with transporter proteins, facilitating cellular uptake and improving bioavailability45, making this dual effect crucial in drug design. Additionally, rifampicin’s log P value (3.77) indicated moderate lipophilicity, which supported transmembrane diffusion and may partially compensate for the potential permeability limitation caused by its higher TPSA (220.15 Ų).
Table 2: Drug-likeness properties of the compounds.
| Compound | MWa(g/mol) | HBAa | HBDa | RBa | TPSAa(Å2) | Log Pa | MRb | Ro5 c | Pfizer Rule c | GSK Rule c |
| Rifampicin | 823 | 15 | 6 | 5 | 220.15 | 3.77 | 234.22 | No | Yes | No |
| Kojic acid | 142 | 4 | 2 | 1 | 70.67 | -0.56 | 33.13 | Yes | Yes | Yes |
MW: molecular weight; HBA: number of H-Bond acceptors; HBD: number of H-Bond donors; RB: number of rotatable bonds; TPSA: Topological Polar Surface Area; MR: molar refractivity; a: ADMETlab 3.0; b: SwissADME; c: admetSAR 3.0.
Molecular Docking Simulation
To further investigate the potential molecular targets and mechanisms of rifampicin in the regulation of melanogenesis, molecular docking analyses were performed on several proteins closely associated with melanin biosynthesis. The selected targets included TYRP1 (PDB ID: 5M8M), PI3K (PDB ID: 5TBP), PKA (PDB ID: 1AB8), p38 MAPK (PDB ID: 1A9U), and GSK-3β (PDB ID: 3Q3B). Each protein structure contained a co-crystallized inhibitor: kojic acid for TYRP1, [(1Z)-5-fluoro-2-methyl-1-{[4-(propan-2-yl)phenyl]methylidene}-1H-inden-3-yl]acetic acid for PI3K, forskolin for PKA, 4-[5-(4-fluorophenyl)-2-(4-methanesulfinylphenyl)-3H-imidazol-4-yl]pyridine for p38 MAPK, and 4-(4-hydroxy-3-methylphenyl)-6-phenylpyrimidin-2(5H)-one for GSK-3β. To validate the reliability of the docking protocol, redocking of the native ligands was first performed. The calculated RMSD values for all ligands were below 2.0 Å (ranging from 0.001 to 1.979 Å), confirming the ability of the docking parameters to accurately reproduce the experimental binding conformations (Table 3, Figure 1).
Subsequently, docking of rifampicin was carried out using the same protocol. Binding energy analysis showed that rifampicin exhibited favorable binding affinities toward multiple targets. Notably, rifampicin showed stronger binding to TYRP1 (−6.6 kcal/mol) than the co-crystallized ligand kojic acid (−5.9 kcal/mol), suggesting potential TYRP1 inhibition. This is consistent with previous findings showing that rifampicin reduced melanin content and tyrosinase activity in B16F10 cells, and downregulated MITF and its targets (TYR, TRP-1, TRP-2), supporting a possible TYRP1-mediated mechanism.
For p38 MAPK and PKA, rifampicin binds strongly to p38 MAPK (−9.6 kcal/mol) and PKA (−9.2 kcal/mol), with affinities comparable to their co-crystallized ligands. These results suggest that rifampicin may modulate these pathways by mimicking classical inhibitor binding, thereby suppressing MITF expression.
In the case of GSK-3β, rifampicin showed a binding energy of −8.4 kcal/mol, close to that of the native inhibitor (−8.5 kcal/mol). Interaction analysis revealed that rifampicin formed stable hydrogen bonds and hydrophobic interactions within the GSK-3β active site, supporting its potential role in modulating GSK-3β activity and promoting β-catenin degradation. In contrast, rifampicin exhibited relatively weaker binding to PI3K (−7.8 kcal/mol) compared to its high-affinity co-crystallized inhibitor (−9.0 kcal/mol), reflecting its limited effect on the PI3K/AKT pathway observed in previous biological studies.
Collectively, the docking results demonstrate that rifampicin interacts favorably with multiple proteins involved in melanogenesis, particularly TYRP1, p38 MAPK, PKA, and GSK-3β. The predicted binding interactions support rifampicin’s multitarget regulation of melanin biosynthesis and its potential as a safe, effective skin-whitening agent.
Table 3: Molecular docking results of rifampicin and native ligands with target proteins.
| Protein | RMSD (Å) | Binding energy (kcal/mol) | |
| Original | Rifampicin | ||
| TYRP1 | 1.935 | −5.9 | −6.6 |
| PI3K | 1.979 | −9.0 | −7.8 |
| PKA | 0.001 | −9.6 | −9.2 |
| p38 | 0.001 | −9.8 | −9.6 |
| GSK-3β | 0.012 | −8.5 | -8.4 |
 |
Figure 1: Binding interactions between target proteins and ligands. Gray and orange represent native ligand conformations before (pre-docked) and after (post-docked) docking, respectively; yellow represents rifampicin docking poses. |
Molecular Dynamics (MD) Simulation
RMSD analysis
To further evaluate the dynamics of ligand-target protein binding, the adaptability of the binding pocket, the stability of interactions, and free energy changes, we conducted a 100 ns MD simulation. The RMSD analysis provides insights into the conformational stability and dynamic behavior of protein–ligand complexes. As shown in Figure 2, the RMSD profiles of the TYRP1, PKA, p38, and GSK-3β complexes with both their native ligands and rifampicin exhibited comparable fluctuation, predominantly within the range of 1.5–3.0 Å, indicating stable conformations throughout the simulations. An exception was observed in the PI3K–rifampicin complex, which displayed larger fluctuations ranging from 3.0 to 8.0 Å, possibly reflecting greater conformational flexibility or domain movement. These results suggest that rifampicin exhibits higher structural stability and conformational resilience to TYRP1, PKA, p38, and GSK-3β complexes compared to PI3K, indicating a potentially stronger binding affinity with these targets.
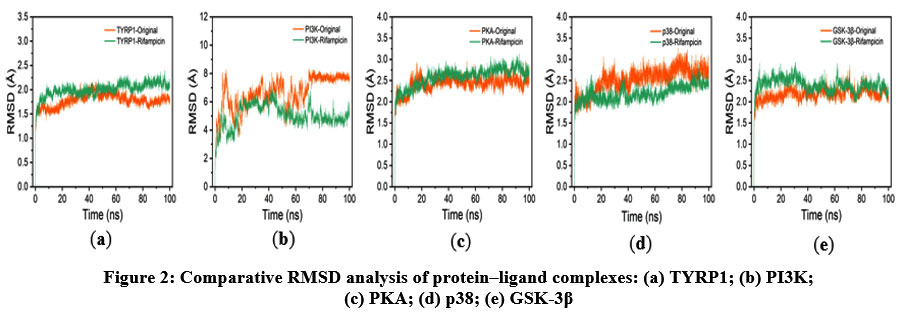 |
Figure 2: Comparative RMSD analysis of protein–ligand complexes: (a) TYRP1; (b) PI3K; (c) PKA; (d) p38; (e) GSK-3β. |
RMSF analysis
The RMSF profiles (Figure 3) revealed that the residue-level fluctuations for TYRP1, PKA, p38, and GSK-3β complexes remained below 10 Å throughout the simulation, with minimal deviations observed, reflecting stable backbone dynamics. The PI3K–rifampicin complex, however, showed notable fluctuations exceeding 10 Å at the C-terminal region, suggesting localized flexibility in this domain. Importantly, rifampicin binding did not significantly alter the RMSF curves compared to the native ligands, further confirming that global protein flexibility was not adversely affected.
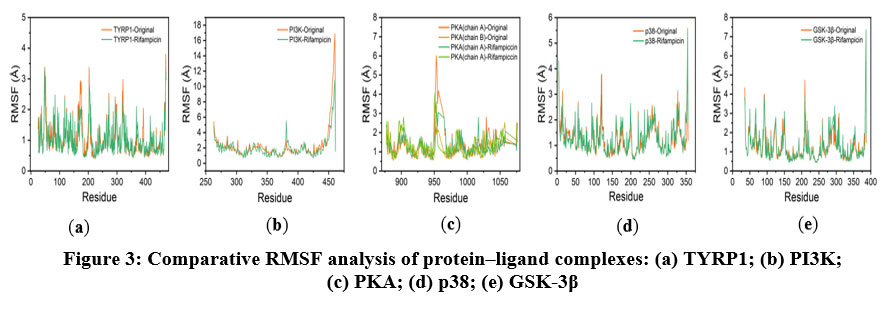 |
Figure 3: Comparative RMSF analysis of protein–ligand complexes: (a) TYRP1; (b) PI3K; (c) PKA; (d) p38; (e) GSK-3β. |
Rg analysis
The Rg primarily reflects the spatial structural characteristics and conformational compactness of molecules, providing important quantitative evidence for the indirect assessment of ligand-target stability and their interactions. As illustrated in Figure 4, the Rg values for all five protein–ligand systems remained remarkably stable throughout the simulations, with the curves for native ligand- and rifampicin-bound complexes showing high similarity. This suggests that rifampicin does not induce significant conformational expansion or contraction. These results further confirm that the structural compactness and folding of the proteins are well maintained upon ligand binding.
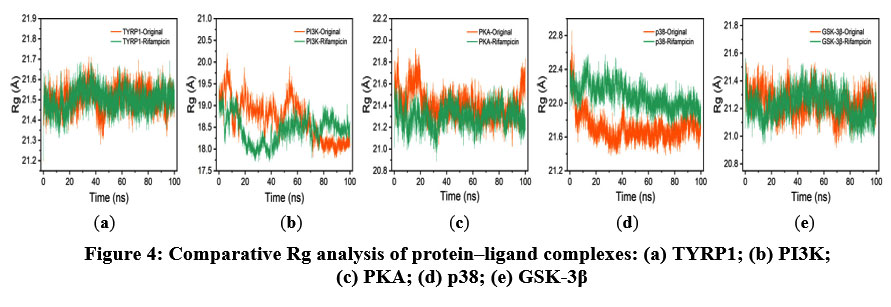 |
Figure 4: Comparative Rg analysis of protein–ligand complexes: (a) TYRP1; (b) PI3K; (c) PKA; (d) p38; (e) GSK-3β. |
SASA analysis
The SASA assesses the surface area of the protein–ligand complex that is exposed to the solvent, reflecting the interaction characteristics between the complex and the solvent. As shown in Figure 5, the SASA values of the five complexes fluctuated within the range of 110–200 nm², with no substantial differences observed between the native and rifampicin-bound forms. These stable SASA trends indicate that ligand binding did not lead to major conformational rearrangements, and the interaction profiles with surrounding solvent molecules remained largely unchanged.
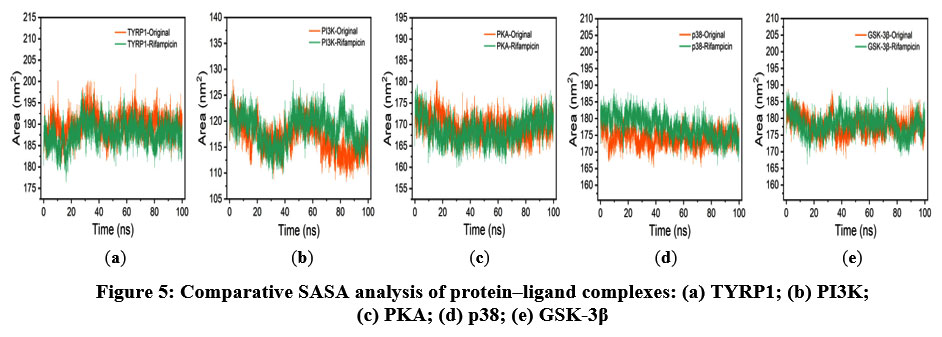 |
Figure 5: Comparative SASA analysis of protein–ligand complexes: (a) TYRP1; (b) PI3K; (c) PKA; (d) p38; (e) GSK-3β. |
H-bonds analysis
Hydrogen bonding plays a crucial role in stabilizing protein–ligand complexes. The number of hydrogen bonds formed between rifampicin and the target proteins remained stable throughout the simulation (Figure 6). Specifically, rifampicin formed two persistent hydrogen bonds with TYRP1, PKA, p38, and GSK-3β. In the cases of p38 and GSK-3β, rifampicin even formed one more hydrogen bond than their respective native ligands, suggesting enhanced stabilization. In contrast, only one hydrogen bond was observed between rifampicin and PI3K, which was fewer than the two hydrogen bonds formed by the native ligand, potentially contributing to the slightly reduced stability observed in PI3K. These results collectively suggest robust and stable hydrogen bonding interactions between rifampicin and most target proteins.
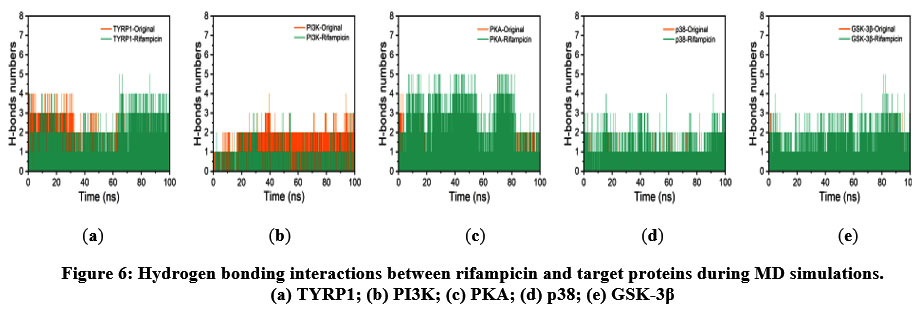 |
Figure 6: Hydrogen bonding interactions between rifampicin and target proteins during MD simulations. (a) TYRP1; (b) PI3K; (c) PKA; (d) p38; (e) GSK-3β. |
Principal component analysis (PCA) analysis
The PCA was conducted to examine large-scale conformational motions and to identify dominant dynamic modes in the complexes (Figure 7). The axes represent the principal components of the protein’s conformational space, with each point representing a distinct configuration sampled during the simulation, and the color gradient (blue to red) indicating the temporal progression from the initial to the final timestep. The first three principal components (PC1–PC3) accounted for the following variance in the rifampicin-bound complexes: TYRP1 (73.69%), PI3K (55.27%), PKA (37.74%), p38 (36.9%), and GSK-3β (34.84%). These results suggest a pronounced conformational variation in TYRP1 and PI3K systems, possibly related to ligand-induced flexibility, while the lower percentages in PKA, p38, and GSK-3β indicate relatively constrained dynamics.
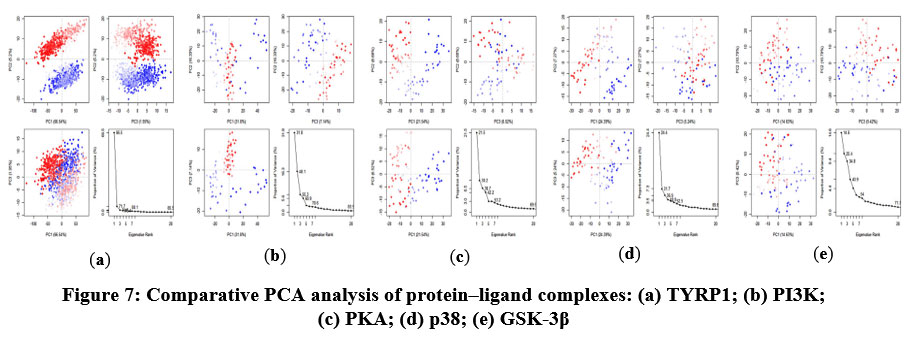 |
Figure 7: Comparative PCA analysis of protein–ligand complexes: (a) TYRP1; (b) PI3K; (c) PKA; (d) p38; (e) GSK-3β. |
Dynamic Cross-Correlation Matrix (DCCM) analysis
Conformational changes of rifampicin with the proteins were further investigated using DCCM analysis. The DCCM analysis revealed both positive and negative correlations between amino acids, with values ranging from −1.0 to 1.0. Correlations closer to 1.0 indicate synchronized residue movements (blue), while those closer to −1.0 represent opposite movements (pink). DCCM analysis (Figure 8) showed the presence of both positively and negatively correlated motions between residues upon rifampicin binding. The PI3K complex exhibited the strongest correlated and anticorrelated motions, followed by PKA, p38, GSK-3β, and TYRP1. These dynamic correlations reflect ligand-induced allosteric communication within the protein, potentially affecting downstream signaling or enzymatic activity.
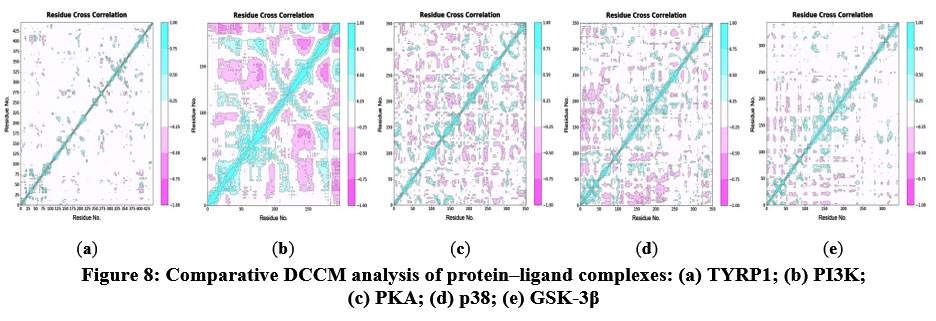 |
Figure 8: Comparative DCCM analysis of protein–ligand complexes: (a) TYRP1; (b) PI3K; (c) PKA; (d) p38; (e) GSK-3β. |
Gibbs FEL analysis
The Gibbs FEL (Figure 9) offers insights into the conformational energetics of the systems. In the Gibbs FEL plots, dark blue or purple regions represent low-energy, highly stable conformations, whereas red or yellow areas indicate higher-energy, less stable conformations. For TYRP1, PKA, p38, and GSK-3β complexes with rifampicin, a single, well-defined energy basin was observed, indicative of stable binding conformations and minimal conformational heterogeneity. In contrast, the PI3K–rifampicin complex displayed two distinct energy basins, suggesting the presence of two metastable states with potential conformational interconversion, consistent with the increased flexibility and correlation dynamics seen earlier.
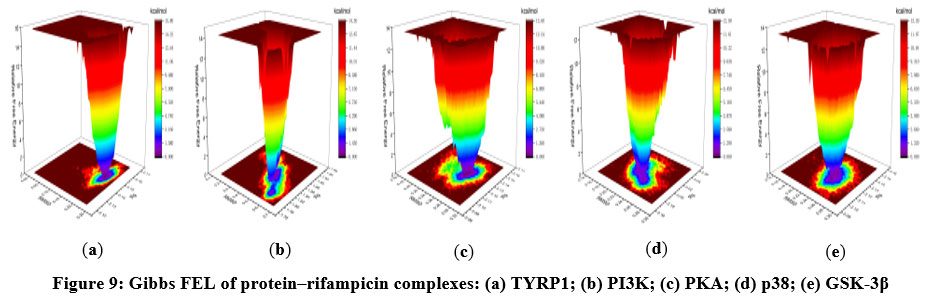 |
Figure 9. Gibbs FEL of protein–rifampicin complexes: (a) TYRP1; (b) PI3K; (c) PKA; (d) p38; (e) GSK-3β. |
MM/GBSA binding free energy analysis
The average binding free energies values were calculated as −30.80 kcal/mol for TYRP1, −55.07 kcal/mol for PI3K, −54.78 kcal/mol for PKA, −33.47 kcal/mol for p38 MAPK, and −41.43 kcal/mol for GSK-3β (Table S1-S5). All values were negative, indicating that rifampicin binding to these targets is thermodynamically favorable. Notably, van der Waals interactions46 represented the dominant energetic contribution in all complexes (−46.27 to −76.03 kcal/mol), highlighting the critical role of hydrophobic interactions in stabilizing the ligand within the binding pockets of the respective proteins.
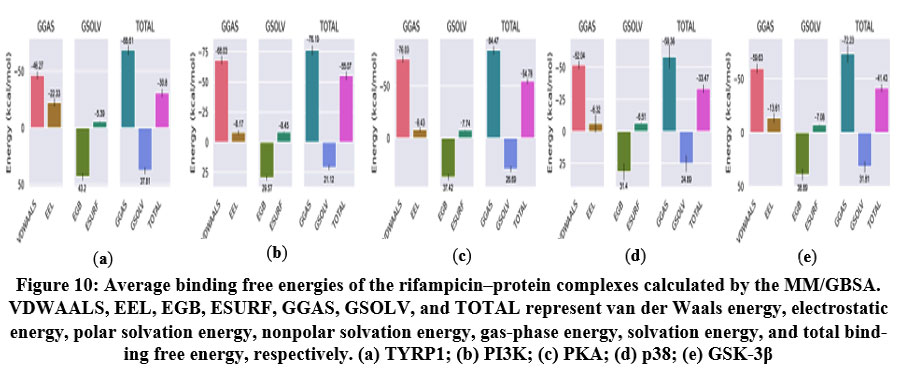 |
Figure 10: Average binding free energies of the rifampicin–protein complexes calculated by the MM/GBSA. VDWAALS, EEL, EGB, ESURF, GGAS, GSOLV, and TOTAL represent van der Waals energy, |
Per-residue energy decomposition analysis was conducted to identify key amino acids contributing significantly to the binding free energy of rifampicin in complex with TYRP1, PI3K, PKA, p38 MAPK, and GSK-3β (Table S6-S10). In the TYRP1 complex, residues Leu382 (−2.52 kcal/mol), Gln390 (−1.89 kcal/mol), Thr391 (−1.78 kcal/mol), Asn318 (−1.62 kcal/mol), and Arg321 (−1.51 kcal/mol) provided major contributions, suggesting a strong polar and hydrophobic interaction network around the binding pocket. For PI3K, Phe439 (−3.64 kcal/mol), Trp305 (−3.57 kcal/mol), and Ala272 (−3.20 kcal/mol) were identified as dominant residues, mainly involved in π–π stacking and hydrophobic interactions, although only a single hydrogen bond was observed (H-bonds analysis), potentially explaining the relatively lower binding stability. In the PKA complex, Lys896 (−2.45 kcal/mol), Ser1028 (−2.34 kcal/mol), Pro893 (−1.80 kcal/mol), and Ile940 (−1.70 kcal/mol) were key contributors located near the ATP-binding site, indicating possible interference with kinase activity. For p38 MAPK, residues Tyr35 (−2.58 kcal/mol), Val30 (−2.43 kcal/mol), and Val38 (−1.46 kcal/mol) contributed significantly to stabilizing rifampicin within the catalytic domain. In the GSK-3β complex, Ile62 (−3.71 kcal/mol), Leu188 (−2.03 kcal/mol), and Thr138 (−1.56 kcal/mol) were identified as the most significant contributors, with Ile62 showing the strongest interaction among all targets.
Collectively, key residues such as Phe439 in PI3K, Ile62 in GSK-3β, Leu382 in TYRP1, Lys896 in PKA, and Tyr35 in p38 MAPK were identified as major contributors to binding stabilization. In this study, the MM/GBSA method, despite its limitations including reliance on conformational sampling, simplified solvent effects, and neglected entropy contributions47, remains effective for investigating protein-ligand binding affinities due to its balanced efficiency and accuracy in large-scale virtual screening. These findings underscore the potential of rifampicin as a multi-target modulator, primarily through favorable non-covalent interactions with critical residues across diverse signaling proteins.
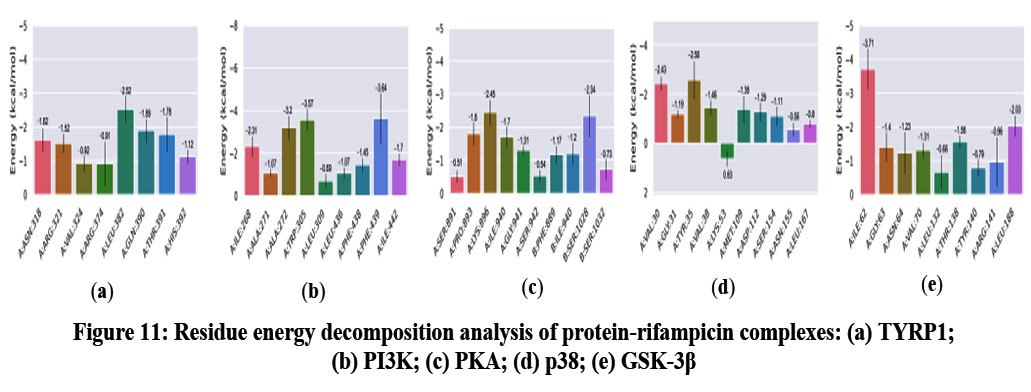 |
Figure 11: Residue energy decomposition analysis of protein-rifampicin complexes: (a) TYRP1; (b) PI3K; (c) PKA; (d) p38; (e) GSK-3β. |
Conformational Analysis
Comparative analysis of MD snapshots at 0, 25, 50, 75, and 100 ns demonstrated that rifampicin formed stable and persistent interactions with key residues within the active sites of target proteins (Figures 12). The sustained nature of these interactions highlights strong binding stability, implying that rifampicin may influence protein conformational dynamics and inhibit enzymatic function.
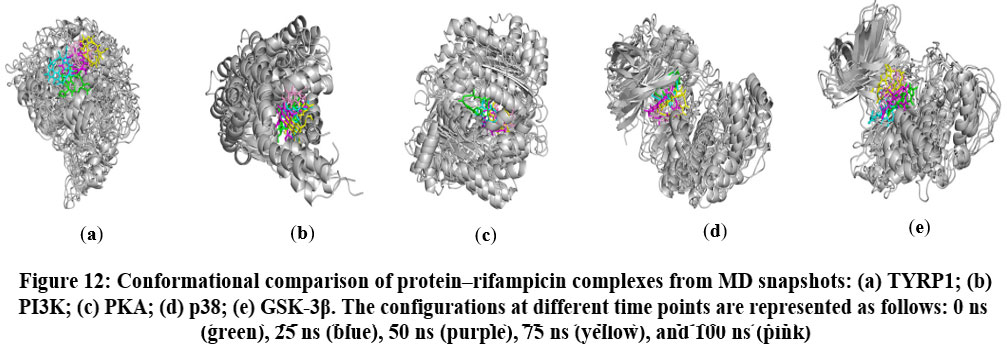 |
Figure 12: Conformational comparison of protein–rifampicin complexes from MD snapshots: (a) TYRP1; (b) PI3K; (c) PKA; (d) p38; (e) GSK-3β. |
Materials and Methods
Molecular Properties and Drug Likeness Analysis
Pharmacokinetic parameters were evaluated by predicting the ADMET and drug-likeness properties using the compounds’ SMILES information. This analysis was conducted comprehensively using several models, including ADMETlab 3.0, SwissADME (http://www.swissadme.ch/; accessed on Oct 15, 2024), pkCSM (https://biosig.lab.uq.edu.au/pkcsm/; accessed on Oct 15, 2024), and the admetSAR 3.0 web server.
Molecular Docking Simulations Analysis
The docking procedure for TYRP1 (PDB ID: 5M8M) followed a previously established protocol.48 Crystal structures of TYRP1 (5M8M)49, PI3K (5TBP)50, PKA (1AB8)51 p38 MAPK (1A9U)52, and GSK-3β (3Q3B)53 were retrieved from the Protein Data Bank (https://www.rcsb.org/; accessed on Mar 15, 2025) and visualized in PyMOL v3.0.3. Rifampicin and native ligands were obtained from PubChem (https://pubchem.ncbi.nlm.nih.gov/; accessed on Mar 15, 2025) and energy-minimized using the MMFF94 force field in OpenBabel 2.4.1. Prior to docking, hydrogen atoms were added to the protein structures and ligand molecules. Ligand torsions were defined, and partial charges were assigned using AutoDock Tools v1.5.6. Docking grids were generated based on the binding pocket defined by the original co-crystal ligands, with the following grid center coordinates (X, Y, Z): TYRP1 (−25.8, −26.1, 22.8), PI3K (4.0, 11.0, 25.0), PKA (46.6, 75.5, −12.0), p38 MAPK (−39.8, 10.5, 35.1), and GSK-3β (36.37, 12.0, 33.0), and a uniform grid box size of 30 × 30 × 30 ų. Docking was conducted using AutoDock Vina v1.2.0 with a semi-flexible protocol and an exhaustiveness value of 25. Binding affinities and poses were analyzed to assess ligand-protein interactions.
Molecular Dynamics (MD) Simulations Analysis
MD simulations were performed using GROMACS 2021 to investigate the structural dynamics of protein complexes with their native ligands and rifampicin. The AMBER14SB force field was applied to the protein, while ligand parameters were generated using GAFF2 via the ACPYPE server (https://bio2byte.be/; accessed Mar 15, 2025). Each system was solvated in a TIP3P water box with periodic boundary conditions, maintaining a 1.2 nm buffer between the solute and the box edge. Energy minimization was conducted using the steepest descent algorithm for up to 50,000 steps, with a convergence threshold of 100 kJ·mol⁻¹·nm⁻¹. A two-stage equilibration protocol was then employed. The first stage involved a 1 ns simulation in the NVT ensemble at 310 K, using the V-rescale thermostat with a coupling constant τ = 0.1 ps. This was followed by a 1 ns NPT equilibration at 310 K and 1 atm, using the same thermostat (τ = 0.1 ps) and the Parrinello–Rahman barostat (τ = 1.0 ps). Temperature coupling was applied separately to the protein–ligand complex and the solvent (water and ions). During both equilibration phases, harmonic positional restraints (force constant = 1000 kJ·mol⁻¹·nm⁻²) were applied to all heavy atoms of the protein and ligand to preserve structural conformation. Subsequently, production MD simulations were performed under NPT conditions, using the same thermostat and barostat settings, but without any positional restraints. Long-range electrostatic interactions were treated using the Particle Mesh Ewald (PME) method, with a 1.2 nm cutoff applied for both electrostatic and van der Waals interactions. All bonds involving hydrogen atoms were constrained using the LINCS algorithm, allowing a 2 fs integration time step.
Gibbs FEL Analysis
This study employed Gromacs scripts g_sham and xpm2txt.py to compute and analyze the Gibbs free energy landscape, focusing on the relationships among RMSD, Rg, and Gibbs free energy. RMSD and Rg were selected as key reaction coordinates, and g_sham was used to compute their distributions to generate the free energy data. The xpm2txt.py script converted the xpm output into numerical data for Gibbs free energy extraction, and Origin 2021 generated a 3D color-mapped surface plot to visualize the energy distribution.
MM/GBSA and Residue Energy Decomposition analysis
Binding free energies of protein-ligand complexes were calculated using MM/GBSA with gmx_MM/PBSA on the last 20 ns of stable trajectories to ensure reliable interaction assessment, as expressed in the following equation:
ΔGbind = ΔGcomplex − ΔGReceptor − ΔGLigand
ΔTOTAL=ΔGGAS+ΔGSOLV
ΔGGAS=ΔVDWAALS+ΔEEL
ΔGSOLV=ΔEGB+ΔESURF
In this equation, ΔG complex represents the free energy of the TYRP1 structure in complex with the ligand, while ΔG receptor and ΔG ligand correspond to the free energies of the TYRP1 receptor and the ligand in aqueous solution, respectively. MM/PBSA method evaluate energetic contributions by decomposing the total binding free energy (ΔTOTAL) into gas-phase (ΔGGAS) and solvation (ΔGSOLV) energy changes. The gas-phase energy further divides into van der Waals interactions (ΔVDWAALS) and electrostatic interactions (ΔEEL), while solvation energy includes polar (ΔEGB) and non-polar (ΔESURF) contributions.
Residue energy analysis identified key residues within 4 Å of the ligand that significantly contribute to binding affinity.
PCA and DCCM analysis
PCA and DCCM calculations were conducted using the Bio3D package in RStudio to elucidate the collective motions and correlated residue fluctuations of the protein during the simulations. These analyses revealed key conformational changes and dynamic couplings essential to the protein’s function.
Conclusions
This study employed molecular docking and MD simulations to investigate the potential anti-melanogenic mechanisms of rifampicin. Docking results demonstrated that rifampicin binds favorably to key melanogenesis-related proteins, including TYRP1, p38 MAPK, PKA, and GSK-3β, with affinities matching or surpassing their native ligands. These interactions suggest that rifampicin may inhibit melanin biosynthesis by directly targeting TYRP1 and modulating signaling pathways such as MAPK, cAMP/PKA, and Wnt/β-catenin.
However, rifampicin exhibited relatively weaker binding affinity toward PI3K, as indicated by less favorable docking affinities. MD simulations further supported this finding, revealing fewer hydrogen bonds, higher RMSD values, and reduced conformational stability in the PI3K–rifampicin complex, suggesting a limited role in PI3K/AKT pathway regulation. MD analyses confirmed the structural stability of rifampicin-bound complexes, particularly for TYRP1, PKA, p38 MAPK, and GSK-3β, as indicated by consistent RMSD, RMSF, Rg, and SASA profiles. Furthermore, MM/GBSA binding free energy calculations and Gibbs FEL analyses substantiated the thermodynamic favorability of rifampicin binding.
In summary, rifampicin exhibits multi-target anti-melanogenic effects primarily through strong interactions with TYRP1, PKA, p38 MAPK, and GSK-3β, while exhibiting weaker interactions with PI3K. These findings support its potential repurposing as a safe and effective therapeutic agent for hyperpigmentation disorders.
Acknowledgement
The author would like to thank. this research was financially supported by the Ministry of Trade, Industry and Energy, Korea. for their guidance and support to complete this article.
Funding Sources
This research was financially supported by the Ministry of Trade, Industry and Energy, Korea, under the “Regional Innovation Cluster Development Program (Non-R&D, P0024160)” supervised by the Korea Institute for Advancement of Technology (KIAT).
Conflicts of Interest
The authors declare no conflicts of interest.
Data Availability Statement
All data supporting the findings of this study are contained within the article and its supplementary materials. The raw simulation files generated in this work are available upon reasonable request for academic purposes.
Ethics Statement
This research did not involve human participants, animal subjects, or any material that requires ethical approval.
Informed Consent Statement
This study did not involve human participants, and therefore, informed consent was not required.
Author Contributions
Conceptualization, C.-G.H., X.L., and Y.X.; methodology, X.L. and Y.X.; bioinformatic analyses, X.L. and Y.X.; writing—original draft preparation, X.L. and Y.X.; writing—review and editing, C.-G.H.; supervision, C.-G.H.; project administration, C.-G.H.; funding acquisition, C.-G.H. All authors have read and agreed to the published version of the manuscript.
References
- Mishra, S.; Vasanthan, M.; Malliappan, S. P. Drug repurposing: A leading strategy for new threats and targets.ACS pharmacol Transl. Sci. 2024, 7, 915-932.
CrossRef - Krishnamurthy, N.; Grimshaw, A. A.; Axson, S. A. Drug repurposing: a systematic review on root causes, barriers and facilitators. BMC Health Serv. Res. 2022, 22, 970.
CrossRef - Xia, Y.; Sun, M.; Huang, H. Drug repurposing for cancer therapy. Signal Transduct Tar. 2024, 9, 92.
CrossRef - Fonseca, S.; Amaral, M. N.; Reis, C. P. Marine natural products as innovative cosmetic ingredients. Mar Drugs. 2023, 21, 170.
CrossRef - Sotiropoulou, G.; Zingkou, E.; Pampalakis, G. Redirecting drug repositioning to discover innovative cosmeceuticals. Exp Der 2021, 30, 628-644.
CrossRef - Schein, C.H. Repurposing approved drugs on the pathway to novel therapies. Res. Rev. 2020, 40, 586–605.
CrossRef - Gelosa, P.; Castiglioni, L.; Camera, M.; Sironi, L. Repurposing of drugs approved for cardiovascular diseases: Opportunity or mirage? Pharmacol. 2020, 177, 113895.
CrossRef - Turabi, K.S.; Deshmukh, A.; Paul, S.; Swami, D.; Siddiqui, S.; Kumar, U.; Naikar, S.; Devarajan, S.; Basu, S.; Paul, M.K. Drug repurposing-an emerging strategy in cancer therapeutics. N-S ARCH PHARMACOL. 2022, 395, 1139–1158.
CrossRef - Cruz Burgos, M.; Losada-Garcia, A.; Cruz-Hernández, C.D.; Cortés-Ramírez, S.A.; Camacho-Arroyo, I.; Gonzalez-Covarrubias, V.; Morales-Pacheco, M.; Trujillo-Bornios, S.I.; Rodríguez-Dorantes, M. New approaches in oncology for repositioning drugs: The case of PDE5 inhibitor sildenafil. Oncol. 2021, 11, 627229.
CrossRef - Pus, cas,u, C.; Zanfirescu, A.; Negres, , S.; S, eremet, O.C. Exploring the multifaceted potential of sildenafil in medicine. Medicina 2023, 59, 2190.
CrossRef - Jourdan, J. P.; Bureau, R.; Rochais, C. Drug repositioning: a brief overview. J Pharm Pharmacol. 2020, 72, 1145-1151.
CrossRef - Dharmana, S. Review of topical lightening agents. J Pigment Disord. 2014, 145, 46.
CrossRef - Ebanks, J.P.; Wickett, R.R.; Boissy R.E. Mechanisms regulating skin pig -mentation: the rise and fall of complexion coloration. Int J Mol Sci. 2019, 10, 4066- 4087.
CrossRef - Schallreuter, K.U.; Wood, J.W. A possible mechanism of actionfor azelaic acid in the human epidermis. Arch Dermatol Res. 1990, 282, 168-171.
CrossRef - Hosoi, J.; Abe, E.; Suda, T. Regulation of melanin synthesis of B16 mouse melanoma cells by 1α, 25-dihydroxyvitamin D3 and retinoic acid. Cancer Res. 1985, 45, 1474-1478.
- Minasyan, M.; Hogan, S.; Lal, K. Oral Tranexamic acid for prevention and treatment of postinflammatory hyperpigmentation. Surg. 2024, 50, S219–S224.
CrossRef - Chen, T.; Xue, J.; Wang, Q. Tranexamic acid for the treatment of hyperpigmentation and telangiectatic disorders other than melasma: An update. Clin. Investig. Dermatol. 2024, 17, 2151–2163.
CrossRef - Atallah, C.; Viennet, C.; Robin S. Effect of cysteamine hydrochloride-loaded liposomes on skin depigmenting and penetration. Eur J Pharm Sci. 2022, 168, 106082.
CrossRef - Crous, C.; Pretorius, J.; Petzer, A. Overview of popular cosmeceuticals in dermatology. Skin Health Dis. 2024, 4, e340.
CrossRef - Augustin, M.; Berardesca, E.; Blume-Peytavi, U.; Elsner, P.; Scafa, D.; Schmeel, L.C.; Proksch, E. Managing dry skin in patients with comorbidities or with advanced age: Unmet needs and roles for products containing potential emollient-plus ingredients. Dermatolog. Treat. 2024, 35, 2326171.
CrossRef - Han, H.J.; Hyun, C.G. Acenocoumarol exerts anti-inflammatory activity via the suppression of NF-κB and MAPK pathways in RAW 264.7 cells. Molecules. 2023, 28, 2075.
CrossRef - Kim, H.M.; Hyun, C.G. Miglitol, an oral antidiabetic drug, downregulates melanogenesis in B16F10 melanoma cells through the PKA, MAPK, and GSK3β/β-Catenin signaling pathways. 2022, 28, 115.
CrossRef - Kim, T.; Hyun, C.G. Imperatorin positively regulates melanogenesis through signaling pathways involving PKA/CREB, ERK, AKT, and GSK3β/β-catenin. 2022, 27, 6512.
CrossRef - Moon, S.H.; Chung, Y.C.; Hyun, C.G. Tobramycin promotes melanogenesis by upregulating p38 MAPK protein phosphorylation in B16F10 melanoma cells. 2019, 8, 140.
CrossRef - Yamaguchi, Y.; Brenner, M. Hearing VJ. The regulation of skin pig-mentation. J Biol Chem. 2007, 282, 27557-27561.
CrossRef - Yardman‐Frank, J. M.; Fisher, D. E. Skin pigmentation and its control: From ultraviolet radiation to stem cells. Exp Dermatol. 2021, 30, 560-571.
CrossRef - Thawabteh, A. M.; Jibreen, A.; Karaman, D. Skin pigmentation types, causes and treatment—a review. Molecules. 2023, 28, 4839.
CrossRef - Pillaiyar, T.; Manickam, M.; Namasivayam, V. Skin whitening agents: Medicinal chemistry perspective of tyrosinase inhibitors. Enzyme Inhib. Med. Chem.2017, 32, 403-425.
CrossRef - Huang, H. C.; Yen, H.; Lu, J. Y. Theophylline enhances melanogenesis in B16F10 murine melanoma cells through the activation of the MEK 1/2, and Wnt/β-catenin signaling pathways. Food Chem Toxicol. 2020, 137, 111165.
CrossRef - Bertolotto, C. Melanoma: from melanocyte to genetic alterations and clinical options. Sci. 2013, 1, 635203.
CrossRef - Mieras, L.; Anthony, R.; van, Brakel. W. Negligible risk of inducing resistance in Mycobacterium tuberculosis with single-dose rifampicin as post-exposure prophylaxis for leprosy. IDoP. 2016, 5, 1-5.
CrossRef - Boeree, M. J.; Heinrich, N.; Aarnoutse, R. High-dose rifampicin, moxifloxacin, and SQ109 for treating tuberculosis: a multi-arm, multi-stage randomised controlled trial. Lancet Infect Dis. 2017, 17, 39-49.
CrossRef - Richardus, J. H.; Tiwari, A.; Barth-Jaeggi, T. Leprosy post-exposure prophylaxis with single-dose rifampicin (LPEP): an international feasibility programme. Lancet Glob Health. 2021, 9, e81-e90.
CrossRef - Chai, W.M.; Lin, M.Z.; Song, F.J.; Wang, Y.X.; Xu, K.L.; Huang, J.X.; Fu, J.P.; Peng, Y.Y. Rifampicin as a novel tyrosinase inhibitor:Inhibitory activity and mechanism. J. Biol. Macromol. 2017, 102, 425–430.
CrossRef - Lee, Y. J.; Hyun, C. G. Rifampicin Repurposing Reveals Anti-Melanogenic Activity in B16F10 Melanoma Cells. 2025, 30, 900.
CrossRef - Martinez,N.; Amidon, G.L. A mechanistic approach to understanding the factors affecting drug absorption: a review of fundamentals. J. Clin. Pharmacol. 2002, 42, 620-643.
CrossRef - Ahmad, J.; Amin, S.; Rahman. M. Solid matrix based lipidic nanoparticles in oral cancer chemotherapy: applications and pharmacokinetics. Drug Metab. 2015, 16, 633-644.
CrossRef - Hancox, J.C.; McPate, M.J.; El, Harchi.A. The hERG potassium channel and hERG screening for drug-induced torsades de pointes. PHARMACOL THERAPEUT. 2008, 119, 118-132.
CrossRef - Hughes, J.D.; Blagg, J.; Price, D.A. Physiochemical drug properties associated with in vivo toxicological outcomes. Med. Chem. Lett. 2008, 18, 4872-4875.
CrossRef - Doak, B.C.; Over, B.; Giordanetto, F. Oral druggable space beyond the rule of 5: insights from drugs and clinical candidates. Biol. 2014, 21, 1115-1142.
CrossRef - Gleeson, M.P. Generation of a set of simple, interpretable ADMET rules of thumb. Med. Chem. 2008, 51, 817-834.
CrossRef - Matsson, P.; Doak, B.C.; Over, B. Cell permeability beyond the rule of 5. Adv. Drug Deliv. Rev. 2016, 101, 42-61.
CrossRef - BRUFANI, M.; CELLAI, L.; CERRINI, S. X-Ray Crystal Structure of 4-Deoxy-3′-bromopyrido [1′, 2′-1, 2] imidazo [5, 4-c] rifamycin S. J ANTIBIOT. 1984, 37, 1623-1627.
CrossRef - Varma, M.V.S.; Sateesh, K.; Panchagnula, R. Functional role of P-glycoprotein in limiting intestinal absorption of drugs: contribution of passive permeability to P-glycoprotein mediated efflux transport. Pharm. 2005, 2, 12-21.
CrossRef - Fernandes, J.; Gattass, C.R. Topological polar surface area defines substrate transport by multidrug resistance associated protein 1 (MRP1/ABCC1). Med. Chem. 2009, 52, 1214-1218.
CrossRef - Grimme, S. Accurate description of van der Waals complexes by density functional theory including empirical corrections. Comput. Chem. 2004, 25, 1463-1473.
CrossRef - Wang, E.; Sun, H.; Wang, J.; et al. End-point binding free energy calculation with MM/PBSA and MM/GBSA: strategies and applications in drug design. Rev. 2019, 119, 9478-9508.
CrossRef - Xu, Y.; Liang, X.; Hyun, C.G. Discovery of Indole–Thiourea Derivatives as Tyrosinase Inhibitors: Synthesis, Biological Evaluation, Kinetic Studies, and In Silico Int. J. Mol. Sci. 2024, 25, 9636.
CrossRef - Lai, X.; Wichers, H.J.; Soler‐Lopez, M. Structure of human tyrosinase related protein 1 reveals a binuclear zinc active site important for melanogenesis. Chem. Int. Ed. 2017, 56, 9812-9815.
CrossRef - Chen, L.; Aleshin, A.E.; Alitongbieke, G. Modulation of nongenomic activation of PI3K signalling by tetramerization of N-terminally-cleaved RXRα. Nat Commun. 2017, 8, 16066.
CrossRef - Zhang, G.; Liu, Y.; Ruoho, A.E. Structure of the adenylyl cyclase catalytic core. Nature. 1997. 386, 247-253.
CrossRef - Wang Z, Canagarajah B J, Boehm J C, et al. Structural basis of inhibitor selectivity in MAP kinases. Structure. 1998, 6, 1117-1128.
CrossRef - Coffman, K.; Brodney, M.; Cook, J. 6-amino-4-(pyrimidin-4-yl) pyridones: novel glycogen synthase kinase-3β inhibitors. BIOORG MED CHEM LETT. 2011, 21, 1429-1433.
CrossRef
Accepted on: 22 Sep 2025


![]()


