Zeolite-Sargasso Composites Preparation for Uranyl Adsorption.
 and J. Jiménez-Becerril*
Instituto Nacional de Investigaciones Nucleares. Dirección de Investigación Científica, Gerencia de Ciencias Básicas, Departamento de Química. Apartado, México, D. F.
Corresponding Author E-mail:jaime.jimenez@inin.gob.mx
DOI : http://dx.doi.org/10.13005/ojc/410205
Download this article as:
![]()
Sargasso and zeolite were combined to create novel composites (MZNaS and MZFeS) for heavy metal removal from wastewater. These were synthesized via mechanical grinding of sodium- and iron-modified zeolite with sargasso in a 9:1 ratio, ensuring the zeolite’s chemical structure remained intact. Precursors (ZNa, ZFe) and milled sargasso (MS) were also prepared. Characterization was performed using X-ray diffraction (XRD) to identify compounds, scanning electron microscopy (SEM) for morphology, electron scattering spectroscopy for elemental analysis, and BET for surface area determination. Adsorption efficiency was evaluated with uranyl ions. At an initial pH of 4.52, the solution became basic post-contact, while at pH 1.50, the supernatants remained acidic but showed higher adsorption efficiency. The MZFe composite demonstrated the highest adsorption capacity (2.47 ± 0.02 mg g-1), highlighting its potential as an effective material for uranyl ion removal in wastewater treatment.
KEYWORDS:Sargasso; Sodium-Zeolite; Iron Zeolite; Zeolite Composites; Mechanical Milling
Introduction
Using biomaterials as raw materials for separating polluting metals in aqueous systems has diverted attention toward alternative sources, such as preparing sargasso and zeolite composites, as in this case. Because of their selectivity, ion exchange capacity, and low cost, Sargasso and natural zeolite have been studied separately as effective adsorbents for the removal of heavy metals and other environmental pollutants 1-11. Sargasso (Sargassum sp.) is a type of brown macroalga characterized by a fiber-like structure. Its matrix contains various polysaccharides and significant amounts of essential elements such as nitrogen, sulfur, phosphorus, calcium, magnesium, sodium, and iron. 1-7. One way to improve the surface of the sargasso is by composing it with clay minerals such as zeolite. Clay minerals have a high specific surface area, high cation exchange capacity, and a porous structure. These properties can be integrated into the matrix of algae. Zeolites is a silicate clay mineral. Using sargasso with zeolite is important because the composite formed can improve physicochemical properties such as surface area, ion exchange capacity, functionality, etc. When combined, sargasso and zeolite can work together to complement each other and address their individual limitations 1. Sargasso and zeolite composites may be promising in treating wastewater with high heavy metals.
On the other hand, uranium is the primary element for nuclear energy production and is one of the most hazardous radionuclides. Its effective enrichment plays a crucial role in energy strategy and environmental safety 12, 13; due to this, uranium is a highly toxic heavy metal with some radioactivity. Excessive amounts of uranium have entered the environment due to nuclear industry activities. 12, 13. It is essential to study how pH affects uranium biosorption in composite zeolite-sargasso materials for the removal and recovery of uranium from nuclear waste solutions and other sources for environmental safety. 14-17.
Mechanical milling using a high-energy ball mill 18 is an alternative to preparing the zeolite-sargasso composite. The process is based on the relationship between the milling time and the reduction in particle size. In contrast, the milling time increases, the particle size reduces due to collisions with the medium or system and the recrystallization of the already treated powder 18. The morphology and particle size of sargasso and zeolite samples are modified by varying the milling time, and these modifications are then compared with the corresponding parameters of the samples prepared using the high-energy ball mill method.
In this work, sodium-modified zeolite with sargasso (MZNaS) and iron-modified zeolite with sargasso (MZFeS) composites were prepared by mechanical milling, in which a high-energy ball mill was used to pulverize the sargasso and zeolite.
High-energy ball milling is a mechanical milling process that uses the action of milling media to mix, disperse, activate, and form composite structures, resulting in the production of ultrafine powders. The composite agglomerates formed are particles that contain all components of the starting powder mixture 19-20. Mechanical milling using high-energy ball milling offers several advantages. These include an increased surface area, the formation of micro- and nanostructures, and the creation of lattice defects both on the surface and within the interior of complex metal hydrides. This technique is often preferred over solution-based methods 21. During high-energy ball milling, several processes occur, including deformation, defect accumulation, fracture, welding, structural refinement, and the formation or breakage of chemical bonds. The milling may also produce reaction products due to partial interactions 19-20.
In mechanical milling, some parameters should be considered so that the original structure of the precursors cannot be modified to take advantage of and/or increase their sorption properties. Due to this, the physical characterization of the prepared composites is carried out before and after sorption using an X-ray diffraction (XRD) analysis, the determination of the surface area, pore diameter, and pore volume, using BET, the morphological determination by scanning electron microscopy (SEM) and elemental analysis by electron scattering spectroscopy (EDS). Therefore, the main objective of this study was to prepare and characterize the MZNaS and MZFeS composites and their precursors by mechanical milling and perform the adsorption of uranyl ions to evaluate the effect of pH to know the solubility of the species of the uranium adsorbed in the composites.
Materials and methods
Materials
All reagents were analytical-grade chemicals, and distilled water was used to prepare the solutions without further purification. Uranyl nitrate hexahydrate (UO2(NO3)2•6H2O) (Merck, USA) stock solution (25 mg L−1) was prepared by dissolving in distilled water. Uranyl nitrate working solutions were freshly made with two initial concentrations and two pH initial (25.20 ± 0.34 mg L−1 of pH 4.52 and 25.92 ± 0.33 mg L−1 of pH 1.50). The sodium and iron salts solutions used for homoionize clinoptilolite were prepared using sodium chloride (NaCl) (J. T. Baker, USA) and ferric chloride (FeCl3•6H2O) (Aldrich, USA) with deionized water.
Preparation of adsorbents
The natural zeolite-type clinoptilolite from the state of Oaxaca, Mexico (Z) and natural sargasso (Sargassum flutains) from Quintana Roo, Mexico (S) used in this work were ground and sieved through at 25 mesh, respectively. The samples were washed with distilled water, and the washed material was heated at 60 °C for 24 h.
Homoionization to obtain sodium zeolite was made by refluxing 500 mL of 0.02 M NaCl for 3 h with 50 g of zeolite. The NaCl solution was decanted, and the reflux process was repeated with 500 mL of 0.02 M NaCl. Then, zeolite was washed with distilled water until the NaCl was completely removed, verified when no precipitation formed during drops of AgNO3 solution was added, and dried at 60 °C for 24 h. The sample was labeled as ZNa
In the same way, homoionization of iron zeolite was made by refluxing 500 mL of 0.1 M FeCl3 for 4 h with 30 g of ZNa. It was then washed with distilled water until the chloride ions were completely removed. Furthermore, it was verified with an AgNO3 solution and dried at 60 °C for 24 h. The sample was labeled as ZFe.
The resulting samples were used to prepare sodium zeolite/sargasso (MZNaS) and iron zeolite-sargasso (MZFeS) composites. Mechanical milling was carried out for 3 h on each of these samples, using 15 stainless steel balls 1 mm in diameter as milling media and a milling efficiency of 65%. The mixture samples were 4.5 g of zeolite and 0.5 g of sargasso (9:1) with a high-energy Spex 8000 ball mill. The original materials, S, ZNa, and ZFe samples, were also mechanical milling and labeled MS, MZNa, and MZFe.
Characterization of the composites
The obtained products were mounted directly onto scanning electron microscopy sample holders and covered with gold to provide conductivity. The surface morphologies of the samples were analyzed using a Scanning Electron Microscope (Philips XL30), which was equipped with an energy-dispersive X-ray spectroscopy (DX-4 probe) system. An accelerating voltage of 20 kV was employed for both the SEM imaging and the SEM/EDX analyses. Energy-dispersive spectroscopy (EDS) was used to determine the weight percentage distributions and to perform X-ray mapping of the elements present.
For X-ray diffraction (XRD) analysis, a Siemens diffractometer equipped with Cu Kα radiation and a diffracted beam monochromator was utilized. The X-ray tube operated at 35 kV and 20 mA. Crystalline compounds were identified using the standard methods outlined in Joint Committee on Powder Diffraction Standards (JCPDS) cards.
The specific surface area, pore size, and total pore volume of solid samples were determined using the N2 BET method with the BELSORP-28SA specific surface area analyzer. The samples, which were dried and degassed, were analyzed at room temperature using the multipoint nitrogen (N2) adsorption-desorption method. This study examined the crystal structure, chemical composition, and physical properties of the sargasso, zeolites, and composite samples.
Biosorption experiments
Batch experiments were conducted to study the pH effect in uranyl ion adsorption over zeolite-sargasso composites. This variable was investigated with an adsorbent dosage of 0.1 g, contact time of 24 h, shaken at 20 ⁰C, initial pH of 4.52 and 1.50, and initial concentration of 25 mg L-1. The solution thus obtained was centrifuged at 5000 rpm for 5 minutes. After the experiment, the supernatant containing different uranyl ion concentrations was measured directly in an ICP-SFMS (Thermo Element XR High-Resolution ICP-Mass Spectrometer).
A MeterLab PHM290-H equipped with a glass electrode was used to measure the pH in these experiments.
The adsorption efficiency between the stability of the uranyl ion solution and the surface properties of the composite and their precursors in the adsorption process was determined according to the following equation:

qads = adsorbed uranium (mg g-1), Co = initial concentration of U (mg L-1), Ce = concentration of UO22+ in the solution at the moment of equilibrium, mg L-1, V is the volume of the solution (L), m is the mass of adsorbent (g). R is the recovery of U(VI) ions in the aqueous solution (%); uranium ion concentration data are in mg L-1 and mg g-1 for adsorption capacity (qads).
Results and discussion
Characterization of adsorbent
Figure 1 shows the morphological characteristics determined in the MZNaS, MZFeS composites, and their precursors. It was observed that it is a material with a heterogeneous surface and a rough texture.
The results show the small changes in the morphology of the samples after mechanical milling. The S, ZFe, and ZNa samples appear compact. However, the surface images of the ground samples show a series of macropores in the sargasso and zeolite structures. The MZ, MZNa, MZNaS, MZFe, and MZFeS samples show agglomerates, different grain sizes, grain blocks, and microcrystals with tabular and cleavage shapes observed on the surface in the various crystalline planes of the other samples, as a result, of mechanical milling.
The elemental mapping of the MZNaS and MZFeS composites is presented in Figure 2. Elemental EDS mapping of the samples is useful to observe the distribution of chemical elements in the sample. The elemental mapping of the other samples (MS, MZ, MZNa, and MZFe) showed a homogeneous distribution of Si, Fe, and Al chemical elements in each. Figure 2 presents the characteristic X-ray emission of Si, Fe, and Al, respectively. As can be seen, all elements are homogeneously distributed in the sample. In particular, Si shows a similar distribution in both samples, while Fe and Al accumulate a little more in the structures of the MZFeS composite than in the MZNaS composite. This result coincides with the type of material expected by the exchange of sodium for iron in obtaining the MZFeS composite and the sargasso. It shows how Fe was successfully integrated into the material after chemical modification in the MZFeS composite. In both cases, it is probably also due to the sargasso as part of the composites.
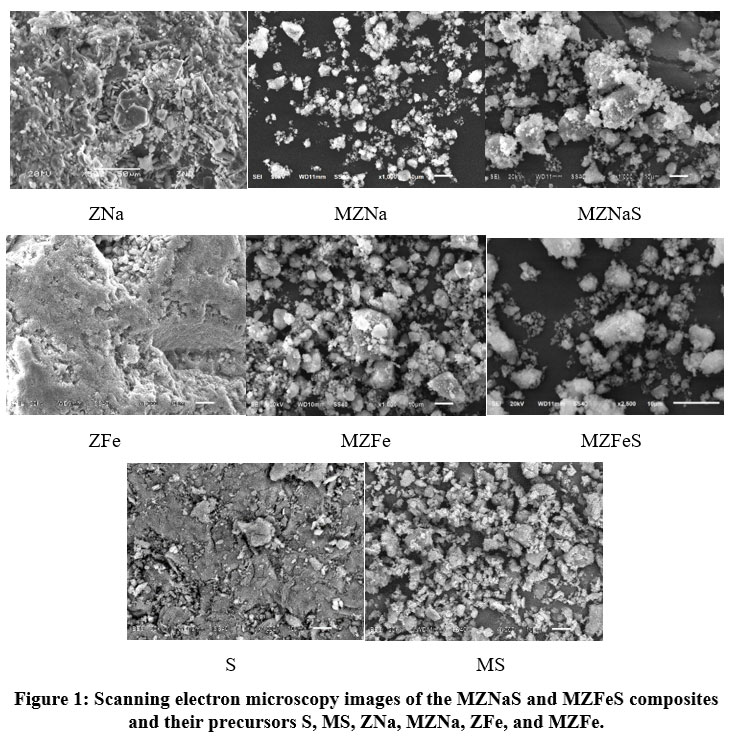 |
Figure 1: Scanning electron microscopy images of the MZNaS and MZFeS composites and their precursors S, MS, ZNa, MZNa, ZFe, and MZFe. |
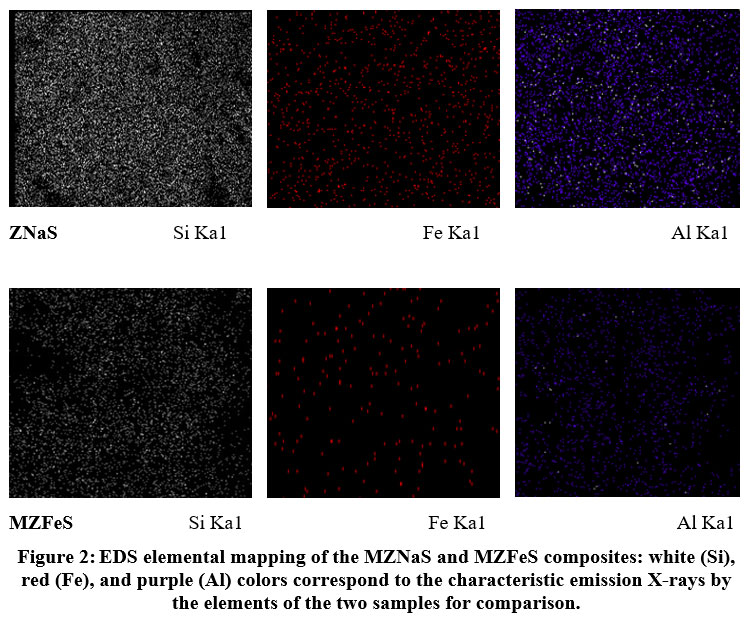 |
Figure 2: EDS elemental mapping of the MZNaS and MZFeS composites: white (Si), red (Fe), and purple (Al) colors correspond to the characteristic emission X-rays by the elements of the two samples for comparison. |
Table 1 shows the amount in wt % of carbon, oxygen, sodium, magnesium, sulfur, potassium, iron, and calcium in the MZNaS and MZFeS samples by EDS analysis. The results of the EDS analysis indicate a heterogeneous distribution of the elemental composition of each of the samples. The MS, ZNa, MZNa, ZFe, MZFe, MZNaS, and MZFeS samples show the presence of carbon, oxygen, sodium, magnesium, aluminum, silicon, potassium, and iron, mainly as shown in Table 1. Oxygen, sodium, and potassium are present in all samples. The amount of carbon is different in MS, MZNaS, and MZFeS samples. There is no carbon in ZNa, MZNa, ZFe, and MZFe samples. The amount of oxygen is similar in all the samples. The natural zeolite ZNa contained less than 0.8 wt% iron. When treated with FeCl3 solutions, the sodium content decreased from 1.93 to 0.35 wt% for ZFe. Moreover, the amount of iron increased by 0.76 wt.% (ZNa) to 9.55 wt.% (ZFe), respectively. The trend of the Al, Si, and K elements is that they increase in the order ZNa<MZNa, then decrease a little in the MZFeS sample. This trend is similar for ZFe, MZFe, and MZFeS samples, except for Si, whose trend increases in ZFe<MZFe<MZFeS. Cl was removed after the washing process.
This heterogeneous distribution of the elemental composition of the samples is due to the mechanical grinding method.
Table 1: Elemental chemical analysis of the MZNaS and MZFeS composites and precursors
| Elements | Composition (wt %) | ||||||
| MS | ZNa | MZNa | MZNaS | ZFe | MZFe | MZFeS | |
| C | 40.7±1.3 | – | – | 10.7±0.2 | – | – | 6.9±1.5 |
| O | 52.5±1.0 | 52.6±2.7 | 55.6±1.2 | 55.4±2.5 | 54.8±1.4 | 56.0±0.1 | 55.1±1.2 |
| Na | 0.62±0.0 | 1.9±0.4 | 1.5±0.2 | 1.6±0.1 | 0.4± 0.1 | 0.7±0.1 | 1.0±0.2 |
| Mg | 0.8±0.1 | – | – | 0.5±0.1 | – | 0.5±0.2 | 5.0±0.1 |
| Al | – | 3.4±0.6 | 5.6±0.3 | 5.3±0.6 | 4.3± 0.5 | 5.1±0.6 | 4.1±0.2 |
| Si | – | 17.7±3.7 | 28.9±3.0 | 25.8±2.3 | 24.7±2.9 | 27.0±2.3 | 27.7±0.6 |
| S | 0.9± 0.1 | – | – | – | – | – | – |
| K | 1.0±0.1 | 0.7±0.1 | 3.6±0.7 | 3.3±0.3 | 2.2± 1.5 | 3.4±0.4 | 1.3±0.1 |
| Fe | 0.8±0.1 | 1.4±0.4 | 1.1±0.1 | 9.5± 1.1 | 3.9±0.2 | 6.3±0.9 | |
| Ca | 3.6±0.4 | 0.4±0.1 | 0.7±0.1 | 1.4±0.0 | 2.7± 0.3 | – | – |
The carbon content decreases drastically from sargasso (MS: 40.7%) when combined with zeolites (MZNaS: 10.7%; MZFeS: 6.9%), effectively integrating sargasso into the zeolite matrix. Oxygen remains relatively constant in all materials (52-56%), reflecting the oxide-rich composition of the components. Iron (Fe) increases significantly in ZFe (9.5%) due to treatment with ferric chloride. The MZFeS composite material’s content decreases (6.3%), probably due to dilution in the sargasso matrix. The constant aluminum (Al) and silicon (Si) content reflects the stability of the zeolite structure.
Determination of specific surface area
Table 2 shows the results obtained from the analysis of the specific area of MZNa, MZFe, and MZNaS, mill ferric activated zeolite composite (MZFeS) composite, and their precursors (MS, ZNa, and ZFe). This magnitude represents the compounds’ ability to absorb chemical species in an aqueous solution.
As can be seen in Table 2, the surface area (ABET) increases from 16.7 to 27.5 m2 g-1 in the ratio ZNa <MZNa<MZNaS, the average pore diameter (dP) decreases from 25.8 to 24.0 nm in the ratio ZNa>MZNa>MZNaS and the total pore volume (Vp) increases from 0.1078 to 0.1652 cm3/g in the ratio ZNa <MZNa<MZNaS. The reduction in particle size is caused by the complex dynamic interactions between the balls and the turbulent slurry during the ball milling process. This complexity makes it challenging to quantitatively interpret the observed phenomena, including (1) the presence of an optimal ball size for a specific rotation speed and (2) the reduction in the optimal ball size as the rotation speed (rpm) increases 18.
Table 2: Results were obtained by analyzing the specific area of the MZNaS, MZFeS composites, and their precursors (MS, ZNa, MZNa, ZFe, and MZFe).
| Samples | ABETm2 g-1 | dPnm | VPcm3 g-1 |
| MS | 2.3 | 71.2 | 0.04 |
| ZNa | 16.7 | 25.8 | 0.12 |
| MZNa | 25.2 | 24.3 | 0.15 |
| MZNaS | 27.5 | 24.0 | 0.16 |
| ZFe | 44.7 | 11.5 | 0.13 |
| MZFe | 38.2 | 20.6 | 0.20 |
| MZFeS | 33.1 | 21.6 | 0.18 |
The specific surface area (ABET) improves when integrating sargasso and zeolites, especially for MZNaS (27.5 m² g-1). Still, it decreases for MZFeS (33.1 m² g-1) compared to ZFe (44.7 m² g-1), possibly due to compaction of the material in the grinding process.
ABET ratio: MZFeS<MZFe< ZFe
Average pore diameter (dP) ratio: MZFeS>MZFe>ZFe
Total pore volume (Vp) ratio: MZFe>ZFe< MZFeS.
So, mechanical milling is an effective method for obtaining highly homogeneous composites, increasing textural properties. The surface area of the sodium zeolite-sargasso composite improves, as expected. While the MZFeS composite has decreased, the surface area has decreased. This decrease in surface area of the MZFeS composite is due to the textural surface compaction of sargasso and iron zeolite by mechanical milling.
Analysis of the crystalline or amorphous components of the samples (DRX)
The X-ray diffraction pattern is shown in Figure 3. This pattern was compared with the patterns reported by the Joint Committee on Powder Diffraction Standards (JCPDS).
X-ray diffraction (XRD) is a technique to characterize the crystalline structure of zeolites. Zeolites are crystalline materials, which means they have well-defined diffraction peaks. Each type of zeolite has a unique diffraction pattern, which allows its identification 22.
Sargassum is a biological and mainly amorphous material, so its XRD pattern does not present well-defined diffraction peaks like crystalline materials. Instead, it shows broad, diffuse bands in the diffractogram; this behavior is due to the composition of sargassum, rich in polysaccharides, cellulose, proteins and phenolic compounds, which do not have crystalline order. Some sargassum species may contain traces of mineral salts (carbonates, silica or phosphates) that generate small peaks in the pattern 23.
Each sample was scanned within the 2θ range of 5–80 degrees. XRD analysis indicates that zeolite is the primary mineral in the sample, while the contents of albite and mordenite are minimal. Mechanical milling did not affect the structure of the zeolite since, in the XRD, the same peaks of the natural zeolite and mill zeolite are observed. The mill samples are more crystalline than their predecessors. In the MZNaS composite, the zeolite peaks predominate; only the sargasso peak is noted at 30-degree 2 Theta. This behavior is similar to that of the MZFeS composite. This result indicates that the natural zeolite was not distorted during the sodium treatments.
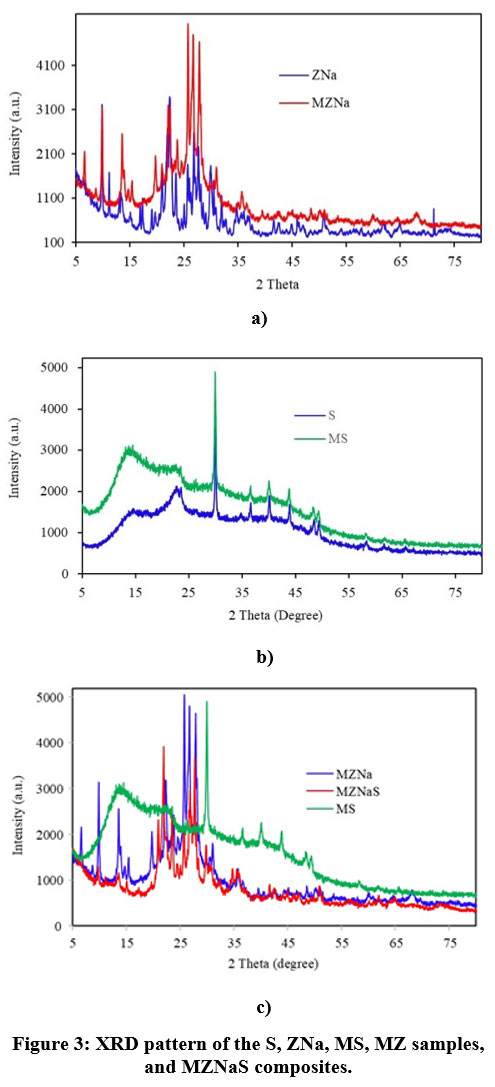 |
Figure 3: XRD pattern of the S, ZNa, MS, MZ samples, and MZNaS composites. |
Study of the adsorption efficiency of composites and precursors
Table 3 shows the results obtained to evaluate the adsorption performance between the uranyl ion solution’s stability, the composites’ surface properties, and their precursors in the adsorption process. The uranium ion concentration data were determined using equation 1) to obtain the adsorption capacity (quads).
Adsorption efficiency is influenced by the pH, as seen in the variation of the final pH of the supernatant solution and the adsorption capacity (qads). Across samples, the final pH after adsorption indicates a significant buffering or reaction between the materials and the uranyl ion solution. Samples like MZNa and MZNaS tend to have higher final pH values than others, suggesting better interaction or adsorption behavior in neutral or slightly basic environments.
Table 3: Adsorption efficiency of UO22+ ions (UO2(NO3)2•6H2O Solution) on MZNaS, MZFeS composites and their precursors MS, ZNa, MZNa, ZFe, and MZFe, as a function of final pH.
| Samples | UO2(NO3)2•6H2O Solution | |||
| Initial pH1 = 4.52 | Initial pH2 = 1.50 | |||
| Final pH1 supernatant solution | qads (mg g-1) | Final pH2supernatant solution | qads (mg g-1) | |
| MS | 7.71 | 2.20±0.03 | 7.32 | 2.28±0.11 |
| ZNa | 6.54 | 2.40±0.04 | 3.25 | 2.13±0.03 |
| MZNa | 8.83 | 1.90±0.04 | 6.64 | 2.44±0.01 |
| MZNaS | 7.35 | 1.89±0.01 | 6.71 | 2.17±0.01 |
| ZFe | 4.04 | 1.87±0.03 | 2.47 | 0.02±0.02 |
| MZFe | 6.63 | 2.47±0.02 | 4.65 | 2.20±0.01 |
| MZFeS | 6.43 | 2.31±0.01 | 5.20 | 2.38±0.03 |
Composite materials (MZNaS, MZFeS) generally perform better than their precursors (ZNa, ZFe). This behavior suggests that the synthesis of composites enhances surface properties favorable for uranyl ion adsorption. The significant variations in (qads) across different materials and pH levels highlight the role of surface interactions and material-specific properties in stabilizing or adsorbing uranyl ions.
MZFe and MZFeS show the highest adsorption efficiency across both pH conditions, making them promising candidates for uranyl ion adsorption. The efficiency of adsorption is strongly dependent on the pH of the solution, with composites generally performing better at neutral to slightly acidic pH.
No studies have been conducted on using similar materials for uranyl adsorption. However, there are preparations of the composite materials by mechanical grinding 24, but they are not used to adsorb uranium or by other preparation methods 25 and for other adsorbates 26. However, the adsorption capacity and efficiency of U with sargassum and U with zeolite are compared separately.
Table 4: Values of adsorption capacities of U(VI) by different adsorbents
| Sample | Condition | Uranium sorptioncapacity (mg g−1) | References |
| Poplar leave | pH 4.0, 25 0C | 2.30 | 26 |
| Poplar branches | pH 4.0, 25 0C | 0.40 | 26 |
| Zeolita | pH 6.0 | 11.3 | 27 |
| Natural Bentonite | pH 5.0 | 2.355 | 28 |
| Bentonite with titanium oxide | pH 5.0 | 5.848 | 28 |
| Colloid montmorillonite | pH 6.0, 25 0C | 7.47 | 29 |
| Carminic acid (CA) impregnated XAD-16 | pH 3.5, 25 0C | 1.93 | 30 |
| Dowex 50W X8/Alizarin Red-S | pH 3.0, | 121.95 | 31 |
| Acrylic fiber waste/sargassum (AFWS) | pH 4.0, 60 0C | 62.00 | 32 |
| Sargassum aquifolium macroalgae-H3PO4 | pH 3.0, 25 0C | 25.37 | 33 |
| Sargassum aquifolium macroalgae-NaOH | pH 3.0, 25 0C | 26.33 | 33 |
| MZNaS | pH 4.5, 20 0C | 1.89±0.01 | This work |
| MZNaS | pH 1.5, 20 0C | 2.17±0.01 | This work |
| MZFeS | pH 4.5, 20 0C | 2.31±0.01 | This work |
| MZFeS | pH 1.5, 20 0C | 2.38±0.03 | This work |
Table 4 compares U(VI) sorption with other works. Establishing a comparison is challenging because of the varying functional groups and sources of uranium solutions, as well as the initial concentrations of uranium ions in natural liquids versus synthetic solutions. Additionally, the type of uranium salt used in the synthetic solution plays a significant role. For example, the sorption capacity of relatively high values (121.95 mg/g of U) 31. Some sorbents were used at pH 6, with a loading capacity (7.47 mg/g), using Colloid montmorillonite 29. There are other kinds of functionalized mesoporous silica with Phosphonate groups 33. Others derived from Acrylic Membrane/Algal fiber (about 62.00 mg/g of U) 32, other that exhibited a lower adsorption affinity (0.40 mg/g of U) 26. The sorbent is a promising tool for extracting uranium and other pollutants from aqueous solutions in the environment.
Effect of pH on the sorption of uranium
The modified materials tend to increase the pH of the uranium solution, indicating the presence of basic functional groups that could cause precipitation of uranyl ions. The effect of pH on the sorption of uranium 25 mg/L in MS, ZNa, MZNa, MZNaS, ZFe, MZFe, and MZFeS samples was studied using the initial pH of the (UO22+) solutions of 4.52 and 1.50, respectively. All the samples were not adjusted to a low acidic pH. When the initial pH of the uranyl ion solution was 4.52, it was observed that after the contact time, the supernatant solutions (final pH) changed in the pH range from 6.43 to 8.83 concerning the initial pH, except for the supernatant of the ZFe sample (pH = 4.04). When the initial pH of the uranyl solution was 1.50, the final pH changed of the MS, MZNa, MZNaS, and MZFeS samples to basic pH, while the other samples changed slightly, maintaining their acidic pH (ZNa, ZFe, MZFe, and MZFeS). With the transition from acidic to basic pH, the surfaces of the MZNaS and MZFeS composites, as well as their precursor adsorbents, displayed a more basic form. This change resulted in a reduced adsorption capacity for the predominant positively charged forms of U(VI) ions, as shown in Table 3. The surface of the negatively charged adsorbents and the acidic pH of the uranyl solution make the final pH basic. The basic pH produces the phenomenon of precipitation of uranyl ions, which is also a way to separate contaminating elements in aqueous media. The pH effect on U(VI) ion sorption can be explained by the surface characteristics of the adsorbents and the speciation of the metal forms in solution 19. However, the adsorption capacity remained unchanged, with further changes from acidic to basic pH. The removal of U(VI) ions is likely due to the formation of various negatively charged uranyl hydroxide and carbonate complexes. This process results in a decrease in the pH of the suspension as U(VI) ions are taken up. The change in pH during the adsorption process facilitates significant ion exchange reactions with hydronium ions (H3O+) and interactions with hydroxide ions (OH–) that compete with U(VI) ions.
The behavior of possible uranium species in an aqueous solution is observed in the species distribution diagram constructed using the computer program “Hydra and Medusa” 34. This program allows species distribution diagrams of different metals as a function of pH (complexes that would be formed as a function of pH, such as oxides and hydroxides of these metals); see Figure 4.
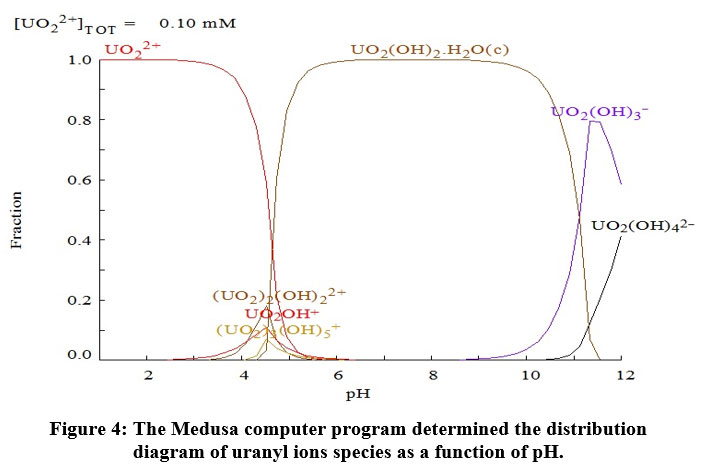 |
Figure 4: The Medusa computer program determined the distribution diagram of uranyl ions species as a function of pH. |
According to the distribution diagram (Figure 4) of the uranyl solution determined with the Medusa program 34, the final pH of the uranyl solution should be less than 5 after the extraction process. Maintaining a lower pH, around 4.52–5.0, in the sorption system is important to avoid microprecipitation phenomena and their contribution to absorption.
The change from acidic pH to basic pH of the uranyl ions (UO22+) after the contact time of the MZNaS, MZFeS composites, and their precursors (pH range from 1.50 to 8.83) indicates that uranyl ions precipitated. Precipitation is probably because the adsorbent surfaces contain functional groups that exhibit a basic form. The macro, micro, and nanoporous structures of the MZNaS, MZFeS composites, and their precursors should also be considered. The acidic uranyl ion solution of the medium may indicate that the phenomenon of uranyl ion precipitation occurs, which causes a low adsorption capacity of uranyl ions (distribution diagram, Figure 4). However, the precipitate process is also a mechanism of immobilizing metals, especially uranyl ions, which pollute elements in aqueous media.
Adsorption mechanism possible for uranium
According to the species distribution diagram presented in Figure 4, hydrolysis of uranium species should be considered as they depend on the pH of the solution and the total concentration of uranium in the solution (Figure 4). At pH 2.0, U is the dominant ionic form in the solution and can compete with protons for binding sites on the composites by ion exchange. In the range of acidic to near-neutral pH values, four main hydrolyzed complex ions exist in solution, U , (UO2)2(OH , UO2OH+, (UO2)3(OH , and dissolved solid schoepite (4UO3-9H2O), a hydrated uranium oxide, exist in the solution at pH 5.5 (Figure 4).
The adsorption mechanism of uranium onto the surfaces of the MZNaS and MZFeS composites, as well as their precursors, depends on the internal structure and the binding of uranyl ions. This process can be attributed to several mechanisms, including ion exchange, complexation, electrostatic attraction, and microprecipitation. These mechanisms involve free electrons present at various active sites within the sorbents, such as sulfur, oxygen, and nitrogen atoms, as well as electron clouds in aromatic rings that form hydrogen bonds with active sites on the surface and within the pore structures of the sorbents. Additionally, electrostatic interactions arise from the differing charges of both the sorbates and sorbents.
Since the MZNaS and MZFeS composites contain all the components of the initial powder mixture (the precursors), one exchange mechanism can be identified for sargassum and another for zeolite. It is also important to consider the hydrolysis of uranium species (see Figure 4).
With these considerations, the possible mechanisms of uranium adsorption would be:
For the sargasso 14:
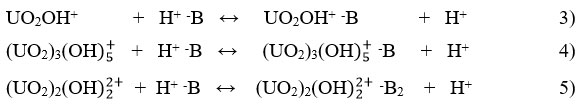
For the zeolite 15:
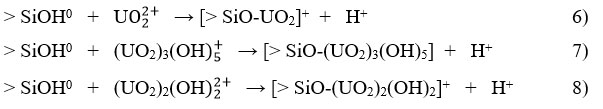
As the pH increases, the amount of deprotonated SiOH also increases. This results in a greater negative charge on the surface, which leads to an increase in the adsorption of metal ions.
For the MZNaS and MZFeS composites (Z= > SiOH0, and S = –B):
![]()
Under these conditions, there is no reaction with the hydrolysis products of uranium.
Conclusion
Sargasso sodium-zeolite and sargasso iron-zeolite composites have been successfully prepared by mechanical milling. Mechanical milling is an effective method for obtaining highly homogeneous composites, sometimes increasing textural properties. The XRD results indicate that the composites are more crystalline than their precursors. Mechanical milling did not affect the structure of the zeolite. Thus, the MZNaS and MZFeS composites were used to evaluate the effect of pH on adsorption with uranyl ions. The maximum adsorption capacity of the uranium of the composites was 2.17 mg/g for MZNaS and 2.38 mg/g for MZFeS, respectively. The pH of the final uranyl ion solution after the adsorption process should be less than 5. That means qads depend on the initial pH of the uranyl ions solution. MZNaS and MZFeS composites have a promising textural and chemical design for uranium adsorption. Iron provides advantages in adsorption, although compaction by grinding has a negative effect on the surface area of the material.
The prepared samples can remove radioactive or non-radioactive, organic, and inorganic contaminants in wastewater.
Acknowledgment
The authors appreciate the support of the Laboratorio Nacional de Investigaciones en Forense Nuclear (LANAFONU), Gerencia de Tecnologia Nuclear, Instituto Nacional de Investigaciones Nucleares (Mexico) for ICP analysis, J. Bonifacio for technical help in ball milling process, F. Granados for sargasso samples, and the Chemistry Department technicians: I. Z. López Malpica, M. Villa Tomasa and E. Morales Moreno. Also, thanks to L. Carapia Morales from XRD analysis and C. Salinas Molina from the SEM technical help.
Funding Sources
The author(s) received no financial support for the research, authorship, and/or publication of this article.
Conflict of Interest
The author(s) do not have any conflict of interest.
Data Availability Statement-
This statement does not apply to this article.
Ethics Statement
This research did not involve human participants, animal subjects, or any material that requires ethical approval.
References
- Atugoda, T.; Gunawardane, C.; Ahmad, M.; Vithanage, M. Chemosphere. 2021, 281, 130676
CrossRef - Saldarriaga-Hernández, S.; Hernandez-Vargas, G.; Iqbal, H. M. N.; Barceló, D., Parra-Saldívar, R. Sci. Total Environ. 2020, 715, 136978
CrossRef - Velarde, L.; Nabavi, M. S.; Escalera, E.; Antti, M. L.; Akhtar, F. Chemosphere, 2023, 328, 138508
CrossRef - Kumar, A.; Kumar, J.; Bhaskar, T. Environ. Res. 2020, 186, 109533
CrossRef - López-Miranda, J. L.; Molina, G. A.; Esparza, R.; González-Reyna, M. A.; Silva, R.; Estévez, M. Arabian J. Chem. 2022, 15, 104169
CrossRef - Villar da Gama, B. M.; Silanpää, M.; Selvasembian, R.; de Farias Silva, C. E.; Meili; L. Water Pract. Technol. 2024, 19(1), 263-280
CrossRef - Cipolloni, O. A.; Couture, P.; Cordonnier, S.; Pascal, P. Y. Mar. Pollut. Bull. 2024, 201, 116229
CrossRef - Mosa, A.; El-Ghamry, A.; Tolba, M. Environ. Technol. Innovation. 2020, 19, 100807
CrossRef - El-Kordy, A.; Dehmani, Y.; Douma, M.; Bouazizi, A.; El Moustansiri, A.; El Abbadi, S.; Tijani,N. Desalin. Water Treat. 2022, 277, 144-154
CrossRef - Senila, M.; Cadar, O. Heliyon. 2024, 10, e25303
CrossRef - Qian, Y.; Yuan, Y.; Wang, H.; Liu, H.; Zhang, J.; Shi, S.; Guo, Z.; Wang, N. J. Mater. Chem. A. 2018, 6, 24676
CrossRef - Patel, K.S.; Sharma, S; Maity, J.P.; Martín-Ramos, P.;, Fiket, Ž.; Bhattacharya, P.; Zhu, Y. Environ. Sci. 2023, 10, 1058053
CrossRef - Smedley, P. L.; Kinniburgh, D.G. Appl. Geochem. 2023, 148, 105534
CrossRef - Yang, J.; Volesky, B. Water Res. 1999, 33(15), 3357-3363
CrossRef - Al-Shaybe, M.; Khalili, F. Jordan J. Earth Environ. Sci. (JJEES), 2009, 2(1), 108-119
- Bakatula, E. N.; Mosai, A. K.; Tutu, H. S. Afr. J. C. (SAJChem). 2015, 68, 165-171
CrossRef - Jiménez-Reyes, M.; Almazán-Sánchez, P. T.; Solache-Ríos, M. J. Environ. Radioacti. 2021, 233, 106610
CrossRef - Granados-Correa, F.; Jimenez-Reyes, M. Mater. Sci.-Pol. 2022, Sciendo 40(2), 257-269
CrossRef - Dudina, D. V.; Bokhonov, B. B. J. Compos. Sci. 2022, 6(7), 188
CrossRef - Rios, J.; Restrepo, A.; Zuleta, A.; Bolívar, F.; Castaño, J.; Correa, E.; Echeverria, F. Metals, 2021, 11, 1621
CrossRef - Li, L.; Xu, C.; Chen, C.;, Wang, Y.; Jiao, L.; Yuan, H. Int. J. Hydrogen Energy, 2013, 38(21), 8798-8812
CrossRef - Khan, H.; Yerramilli, A. S.; D’Oliveira, A.; Alford, T. L.; Boffito, D. C.; Patience, G. S. Can. J. Chem. Eng. 2020, 98(6), 1255-1266
CrossRef - Rahmi, M. H.; Metusalach, M.; Rahim, S. W.; Tahir, D. In Journal of Physics: Conference Series, 2021, 1763(1), 012089
CrossRef - Hamd, A.; Shaban, M.; AlMohamadi, H.; Dryaz, A. R.; Ahmed, S. A.; Al-Ola, K. A. A.; El-Mageed, H. R. A.; Soliman, N. K. ACS Omega 2022, 7, 11044−11056
CrossRef - Abdelwahab, N.; Rabie, W.; Mohamed, FChem. Biol. Technol. Agric. 2023, 10, 52
CrossRef - Al-Masri, M. S.; Amin, Y.; Al-Akel, B.; Al-Naama, T. Appl. Biochem. Biotechnol. 2010, 160, 976–87
CrossRef - Zou, W.; Bai, H.; Zhao, L.; Li, K; Han, R. J. Radioanal. Nucl. Chem. 2011, 288, 779–788
CrossRef - Basuki, K. T.; Hasnowo, L. A.; Jamayanti, E. Urania, 2019, 25(1), 1−70
CrossRef - Yu, S.; Ma, J.; Shi, Y.; Du, Z.; Zhao, Y.; Tuo, X.; Leng, Y. J. Radioanal. Nucl. Chem. 2020, 324, 541–549
CrossRef - Hosseini-Bandegharaei, H.; Hosseini, H. S.; Jalalabadi, Y.; Nedaie, M.; Sarwghadi, M.; Taherian, A.; Hosseini, E. Int. J. Environ. Anal. Chem. 2013, 93(1), 108-124
CrossRef - Yousef, L. A.; Ahmad, A. A.; Bakry, A. R. Int. J. Environ. Anal. Chem. 2020, 8, 667–681
- Orabi, A. H.; Abdelhamid, A .E.-S.; Salem, H. M.; Ismaiel, D. A. J. Radioanal. Nucl. Chem. 2020, 326, 1233–1247
CrossRef - Albayari, M.; Nordin, N.; Adnan, R.; Khalili, F.; Nazal, M. Environ. Eng. Res. 2024; 29(6), 240004
CrossRef - Sillen, L. G., & Warnqvist, B. (2005). MEDUSA: Chemical Equilibrium Diagrams (Actual version). Royal Institute of Technology (KTH). https://www.kth.se/medusa
Accepted on: 14 Apr 2025
Second Review by: Dr. Makeswari R
Final Approval by: Dr. Pounraj Thanasekara


![]()


