Biogenic Fabrication of ZnO Nanoparticles Using Selenicereus undatus Peel Extract: Transforming Agricultural Residues into Value-Added Materials
 and J. Felicita Florence
Department of Chemistry, Holy Cross College (Autonomous), Affiliated to Bharathidasan University, Tiruchirappalli, India
Corresponding author E-mail: auxiliaruby@gmail.com
DOI : http://dx.doi.org/10.13005/ojc/410228
Download this article as:
![]()
This research delineates an innovative, eco-conscious synthesis method for zinc oxide nanomaterials utilizing Selenicereus undatus peel extract, underscoring the principles of green chemistry and transforming agricultural waste into a functional nanomaterial. Extensive optimization was carried out by varying precursor concentration, extract- precursor ratio, pH, temperature and reaction time. The ideal conditions—1:2 peel extract to 0.01M zinc acetate, pH 9, 70°C, 3-hrs incubation—produced Selenicereus undatus ZnO nanoparticles (SU-ZnO NPs) with high crystallinity. X-ray diffraction (XRD) confirmed a hexagonal wurtzite phase with an average crystallite size of 24.95 nm. Fourier transform infrared (FTIR) identified Zn–O bond formation at 538 cm⁻¹, while UV–diffuse reflectance spectroscopy (UV-DRS) indicated a direct band gap energy of 3.16 eV, suggesting potential optoelectronic applications. Field emission scanning electron microscopy (FE-SEM) showed well-defined ZnO nanorods (~98.16 nm) with an interconnected structure, enhancing mechanical stability and conductivity. Energy-dispersive X-ray spectroscopy (EDS) analysis confirmed the elemental composition, showing strong signals for zinc and oxygen, verifying the purity of ZnO NPs. High-resolution transmission electron microscopy (HR-TEM) further confirmed these ZnO nanorods with lattice fringes of 0.26 nm, corresponding to the (002) plane, and a selected area electron diffraction (SAED) pattern matching ZnO’s crystallographic planes. Additionally, dynamic light scattering (DLS) and zeta potential measurements highlighted the colloidal stability and uniform size distribution of the nanoparticles. These findings underscore the efficacy of Selenicereus undatus peel extract in green nanotechnology, promoting sustainable, cost-effective alternatives for ZnO NPs fabrication with potential applications in biomedical, environmental, and electronic sectors.
KEYWORDS:Optimization; Selenicereus undatus; Wurtzite phase; ZnO nanorods
Introduction
In recent years, the synthesis of nanoparticles has garnered significant attention due to their unique properties and wide-ranging applications in fields such as electronics, healthcare, and environmental remediation. Among these, zinc oxide nanoparticles (ZnO NPs) have emerged as a highly researched material owing to their exceptional optical, electronic, and antimicrobial properties. However, conventional methods for synthesizing ZnO NPs often involve hazardous chemicals, high energy consumption, and environmentally taxing procedures, raising concerns about sustainability and safety. To mitigate these issues, green synthesis approaches have been developed, utilizing natural resources and biological materials as eco-friendly reducing and stabilizing agents1.
A promising strategy in this field is the use of plant extracts for biosynthesizing nanoparticles. Plant-based synthesis offers benefits such as simplicity, affordability, and environmental sustainability. The natural phytochemicals found in plant extracts, including flavonoids, alkaloids, and phenolic compounds, are key in reducing and stabilizing metal ions, facilitating the formation of nanoparticles. This study, therefore, investigates the potential of Selenicereus undatus (SU) peel extract as a stabilizing agent in the synthesis of ZnO NPs.
Selenicereus undatus, commonly known as white fleshed dragon fruit, is a tropical fruit renowned for its nutritional benefits and rich phytochemical content. The peel, often discarded as waste, contains a plethora of bioactive compounds, making it an excellent candidate for green synthesis applications2. Utilizing SU peel extract not only aligns with sustainable development goals by valorizing agricultural waste but also provides a non-toxic and renewable resource for nanoparticle synthesis.
This study meticulously investigates the synthesis parameters to optimize the conditions for producing high-quality ZnO NPs. By varying the precursor concentration, additive-precursor ratio, pH, incubation temperature, and reaction time, the ideal conditions for nanoparticle formation were identified. Advanced characterization techniques were used to examine the structural, optical, morphological, and stability attributes of the synthesized nanoparticles.
ZnO NPs exhibits remarkable multifunctionality, making them valuable across various industries. In healthcare, they are widely utilized for their potent antimicrobial, anti-inflammatory, and wound-healing properties, contributing to biomedical applications such as drug delivery, bioimaging, and tissue engineering. Their exceptional optical and semiconducting characteristics make them essential in electronics, including sensors, light-emitting diodes (LEDs), and solar cells, enhancing energy efficiency and performance. Additionally, ZnO NPs play a crucial role in environmental remediation, serving as photocatalysts for pollutant degradation and water purification. In coatings and packaging, their UV-blocking and antimicrobial capabilities extend product durability and improve safety. These diverse applications highlight ZnO NPs as a versatile nanomaterial with significant potential for advancing science and technology3.
This research highlights the effectiveness of SU peel extract as a green, efficient, and sustainable agent for the synthesis of ZnO NPs. It not only contributes to the advancement of green nanotechnology but also stresses the significance of sustainable practices and the use of natural resources in scientific progress.
Materials and Methods
The dragon fruits were purchased from an organic agro farm, Dharmapuri district, Tamil Nadu, India. Fruits were purchased during the ideal season of harvesting (June-August). Chemicals essential for synthesis like Zinc acetate dihydrate (Zn (CH3COO)2. 2H2O) extrapure AR 99.5%, sodium hydroxide pellets (NaOH) extrapure AR 98% and 0.5 N hydrochloric acid (HCl) aqueous solution sourced through Sisco Research Laboratories Pvt. Ltd. (SRL), Bangalore, India. Extraction and synthesis were carried out using deionized (DI) water and absolute ethyl alcohol purchased from Sigma-Aldrich Chemicals Pvt. Ltd., Bangalore, India.
Preparation of SU peel extract
The freshly purchased pesticide free SU was rinsed thoroughly with running water and then DI water to remove all the dirt. Firstly, the peels are removed manually from the pulp and some parts like flower end pit, fins, bracts and areole were also eliminated from the peel. The percentage recovery of peel from the pulp was calculated to identify the average biowaste discarded which are generally rich in biomolecules. (equation 1).

The peels are finely chopped, dehydrated in oven dryer at 50°C and grinding into coarse using laboratory pulverizer. Stored in dry amber vial and utilized for extraction process. There are many extractions process, out of it the most common maceration method was utilized. The coarse bio-waste was soaked into methanol for 96 hrs in the maceration chamber to disperse all the bioactive compounds4. Solubilizing of bioactive ingredients could be visually confirmed by the color change in solvent and discolored peels. The solvent was separated from the peels and stored at 4°C for further studies. Fig. 1 depicts the various stages of SU peel extraction via maceration process.
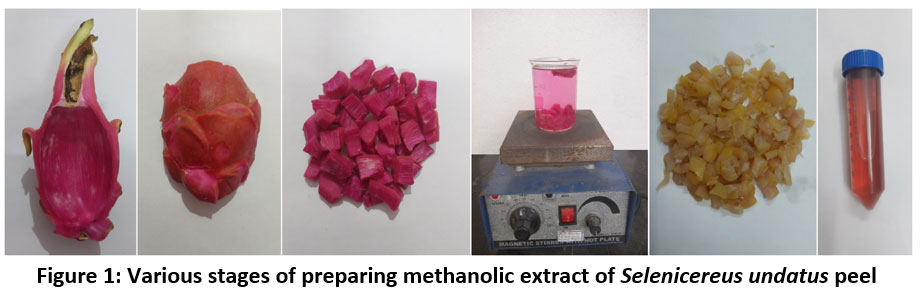 |
Figure 1: Various stages of preparing methanolic extract of Selenicereus undatus peel. |
Phytochemical screening
Preliminary screening of phytochemical analysis was carried out for methanolic SU peel extract to identify the existence of primary and secondary metabolites like betacyanin, phenols, flavonoids, terpenoids, tannins, saponins, proteins, carbohydrates, fats and resins. Reddish-purple pulp and peels of dragon fruit variant are a rich source of betacyanin which act as an antioxidant. Preliminary screening was conducted based on the protocols carried out in literatures5,6,7. Alkaloids were detected using Hager’s test, whereas flavonoids, phenols, tannins, and terpenoids were confirmed through lead acetate, ammonia, acid, and Salkowski assays, respectively. The presence of saponins and steroids was indicated by foam formation and the Salkowski test. Glycosides, anthocyanins, and betacyanins were evaluated using the Keller-Kiliani and NaOH methods. Additionally, carbohydrates, proteins, and lipids were assessed through Benedict’s, Xanthoprotein, and saponification tests. Further screening revealed emodin, anthraquinones, gums, and resins using standard colorimetric techniques.
Optimization of phenomena governing nanoparticle synthesis
Optimization is an action of developing a methodology that evolves a material with most effective properties and function. In nanotechnology, most important factors that govern the formation of good nanoparticles are the size, shape, yield, stability and method8. Parameters like concentration of precursor, ratio of additive and precursor, pH condition, temperature and time of the reaction were optimized and the most suitable condition for developing maximal yield were chosen using Ultraviolet-Visible (UV-Vis) spectrophotometer9. The concentration ratio of additive (SU extract): precursor (Zn (CH3COO)2. 2H2O) was optimized by trials with varying ratios (1:1, 1:2, 1:3, 2:1, 3:1, 2:3 and 3:2) in 0.01M Zn (CH3COO)2.2H2O. Similarly, the concentration of the zinc precursor was optimized by trials with varying concentration (0.001 M, 0.005 M, 0.01 M, 0.05 M, 0.1 M, 0.5 M and 1 M).The pH was maintained from 1 to 13, stabilized using 0.25 N HCl and 0.25 N NaOH. The reaction time was increased from 15 mins to 3.5 hrs and the optimal duration was fixed. Finally, the incubation temperature from 40℃ to 100℃ was monitored for evolving high yield nanoparticles. All the trials were labeled and their corresponding absorbance was recorded using UV-Vis spectrophotometer within the range 200 -800 nm.
Green synthesis of SU-ZnO NPs
The synthetic strategy has been proposed based on the optimum condition obtained from the trails of varying parameters. A reaction mixture contained 50 ml of SU peel extract and 100 ml of 0.1 M Zn (CH3COO)2.2H2O solution. The reaction was carried with continuous stirring using magnetic stirrer for 3 hrs. The pH of the reaction mixture was maintained at 9 at incubation of 70℃. Initially, formation of gelatinous compound which on further incubation a milky white precipitate was formed, shown in Fig 2. The formed nanoparticles are separated from the mother solution using centrifugation techniques at 15,000 rpm for 15 mins. Obtained residue rinsed with ethanol, DI water, then centrifuged once more to eliminate any remaining contaminants. Further the nanoparticles were dried in vacuum dryer for 24 hrs at 60℃ and calcinated using muffle furnace at 500℃ for 3 hrs10,11. Fig. 2 shows the photograph of reaction mixture on the magnetic stirrer and final product (SU-ZnO NPs).
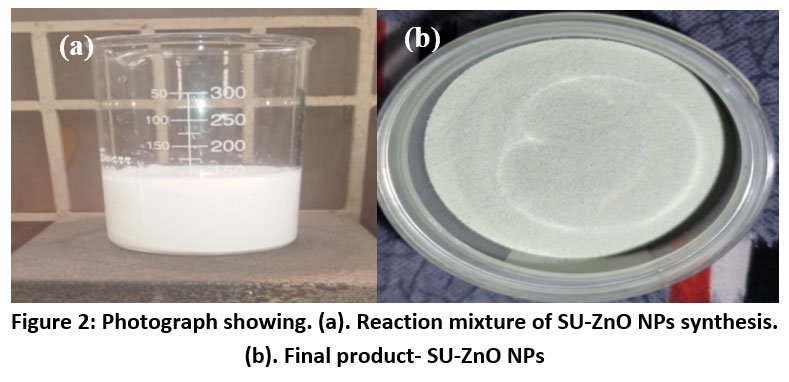 |
Figure 2: Photograph showing. (a). Reaction mixture of SU-ZnO NPs synthesis. (b). Final product- SU-ZnO NPs. |
 
Materials Characterization
The synthesized nanoparticles were subjected to FTIR spectrometer recorded at room temperature by potassium bromide (KBr) pellet method. KBr and nanoparticles were mixed in a ratio of 1:10 using agate mortar and pestle. Grounded mixtures were vacuum dried and made into pellet using hydraulic pellet machine, pressed at 5000-10000 psi. FTIR spectrum was obtained for the prepared pellet at 400 to 4000 cm-1 using PerkinElmer Spectrum Two. The UV-DRS was utilized for obtaining the absorbance, reflectance and transmittance spectrum of the synthesized nanoparticles. Shimadzu UV 2600 with source, tungsten and deuterium lamp was utilized for recording the UV-DRS spectrum with 200 to 1400 nm wavelength spectrum. From the absorbance data, the band gap of SU-ZnO NPs was deduced using Tauc and Davis-Mott model (Equation 2)12,
![]()
Where (2) α = Absorbance conefficient, α = 2.303 x (A/T)
A = Absorbance, T = Thickeness of sample
k = Energy independent constant
hv = Incident photon energy, h = plank’s constant
v = Frequency
Eg = Band gap energy (eV)
n = Nature of transition
SU-ZnO NPs were exposed to XRD to identify the phase composition, orientation and crystallographic structure. HTK 1200N – Bruker D8 Advance with Cu Kα radiation was equipped to establish the XRD spectrum from 5 to 90◦2θ. Crystalline size of synthesized nanoparticles was determined through Debye Scherrer expression (Equation 3)13,
![]()
Where
D = Crystalline size in nm,
K = Scherre constant (0.9)
λ = Wavelength of the source Cu=0.15406 nm
β = Full width half maximum (FWHM) in radians
θ = Peak position in radians
The morphology and size were determined with the employment of Zeiss Gemini 300 FESEM. Samples are loaded on a labeled stub with the help of carbon adhesive and an ultra-thin layer of conducting gold (Au) material was sputtered. The elemental and compositional mapping of the synthesized nanoparticle was determined using EDS analyzer14. The structural and crystallographic analysis of SU-ZnO NPs was carried out using FEI-TECNAI G2-20 TWIN HR-TEM, operating at 200 kV. The sample was prepared by dispersing the nanoparticles in ethanol, following by drop-casting onto a carbon-coated copper grid and allowing it to dry under ambient conditions. The high-resolution imaging enabled the visualization of lattice fringes, while the selected area electron diffraction (SAED) pattern was employed to confirm the crystallinity and phase purity of the synthesized ZnO rods. The average particle size and stability of colloidal suspension of the nanoparticles were determined using DLS and zeta potential (zeta sizer advance – Malvern panalytical). Zeta potential determines the stability of the colloidal suspension. When particles are dispersed in a polar solvent, accumulation of charge around the surface of the particle takes place which creates an electrical double layer (stern and diffuse). Diffuse layer is responsible for zeta potential and high charge (either negative or positive) denotes the electrostatic repulsion between particles which prevents from agglomeration and thereby increases stability15. In general, a good zeta potential for a nanoparticle was determined as >± 30eV. The particle size was determined based on the phenomena Brownian motion. When the particles are dispersed in the solvent, the movement aroused form the collision with solvent is known as Brownian motion. Smaller sized particles create more fluctuation in the intensity of scattered rays due to high diffusion and hence, the correlation factors diminish faster than the larger sized particles. The rate of Brownian motion quantifies translational diffusion constant (D) deduced from autocorrelation function (ACF). Based on the above theory the particle sizes are determined using the expression Strokes-Einstein equation (Equation 4)16,
![]()
Where
dH = Hydrodynamic diameter
k = Boltzmann constant
T = Temperature
η = Viscosity of solvent
D = Translational diffusion constant
Results and Discussion
Percentage of peel recovery
After the manual separation of pulp, the peel obtained which are generally discarded as waste contributes for 39% out of the whole fruit. It is approximately 2/5 of the fruit portion and also enriched with numerous biologically active ingredients like betacyanin, pectins and polyphenols17.
Phytochemical screening
The ethanolic extract of SU peels were analyzed for qualitative test of phyto-constituents and the results reveals that the extract gives positive result for most of bioactive compounds proving its potential for pharmacological activities18,19. Results for the screening of a variety of biologically active substances are tabulated beneath in Table 1. The inference for the screening test are captured and grouped together in Fig. 3.
Table 1: Screening of primary and secondary metabolites in the peels of SU.
| Phytochemical compounds | Observation | Inference-ethanol extract |
| Alkaloids – Hager’s analysis | Yellow precipitate | ++ |
| Flavonoids – lead acetate analysis | Yellow colouration | +++ |
| Phenols – ammonia analysis | Reddish orange colouration | +++ |
| Tannin – acid analysis | Red colouration | ++ |
| Terpenoid–Salkowski analysis | Reddish brown colouration | +++ |
| Saponin – foam analysis | Formation of foam | + |
| Steroids – Salkowski analysis | Reddish brown ring | ++ |
| Glycosides – Keller-Kiliani analysis | Reddish brown ring | ++ |
| Phlobatanins | Red precipitate | – |
| Coumarin | Yellow precipitate | + |
| Betacyanin – NaOH analysis | Decolouration of pink | +++ |
| Anthocyanin –NaOH analysis | Pinkish-red to bluish-violet | + |
| Carbohydrate | Reddish brown colouration | ++ |
| Protein – xanthoprotein analysis | Yellow colouration | + |
| Fat – saponification analysis | Formation of froth | ++ |
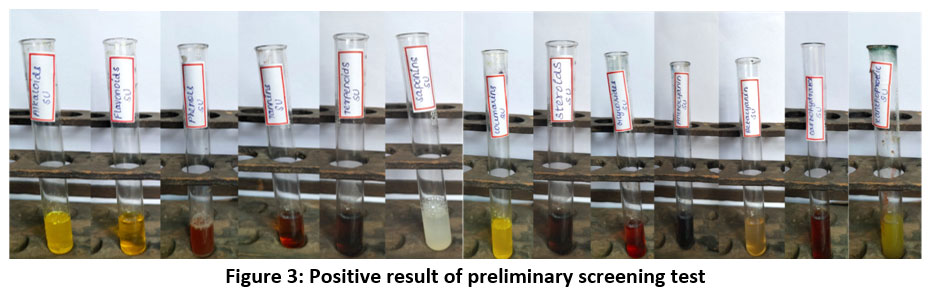 |
Figure 3: Positive result of preliminary screening test. |
Optimization of green synthesized SU-ZnO NPs
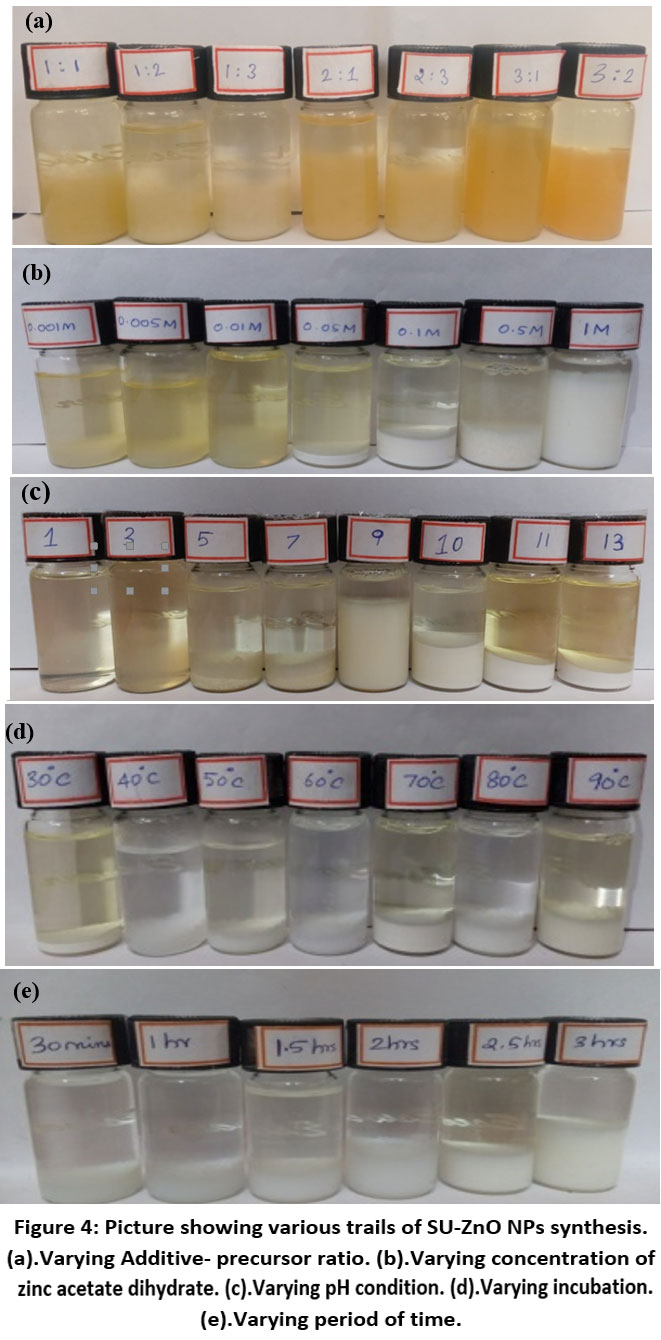 |
Figure 4: Picture showing various trails of SU-ZnO NPs synthesis. (a).Varying Additive- precursor ratio. (b).Varying concentration of zinc acetate dihydrate. (c).Varying pH condition. |
The visual analyses for the formation of nanoparticles in various trails are shown in Fig. 4. which depicts the yield, color and appearance. On varying the parameters, the yield varies, color changes (effect of SU peel extract) and appearance of nanoparticle changes from cloudy particles to powdered form. The optimal conditions in each parameter are chosen from the average of visual analyses and maximum absorbance in UV-Vis spectrophotometer20. Concentration of the SU peel extract was varied in a ratio with 0.01 M Zn (CH3COO)2. 2H2O and their corresponding UV spectrum are shown in Fig. 5. Being a low concentration, the yields and color obtained are cloudy-beige. Plant extract act as capping and stabilizing agent that prevents from agglomeration, reduces particle size and increases stability21. Concentration of SU extract is a salient feature and addition of excess might modify the nature and reduces the purity of nanoparticles formed. Based on the yield and color, 1:2, 1:3, 2:3 were considerably high. From the UV spectrum, λmax was high for 1:2 followed by 2:3. As an average of both, 1:2 ratio was chosen as the optimal condition for SU peel extract. The concentration of zinc acetate dehydrate varied (0.001 M, 0.005 M, 0.01 M, 0.05 M, 0.1 M, 0.5 M and 1 M) and their corresponding UV spectrum are shown in Fig. 6. The maximum absorbance was shown by 0.1 M concentration and its yield was also considerable. At lower concentrations the yield were poor and obtained very low absorbance value. Also shifts in surface plasmon resonance (SPR) peaks indicate the unsuitability for the nanoparticle synthesis22. In case of 0.5M and 1M, the yield acquired seems to be higher from the Fig. 4, but the obtained precipitates were cloudy/gel which develops a false prediction whereas a powdered precipitate was formed for 0.1M concentration. On drying the obtained samples (0.1M, 0.5M and 1M), weight of the nanoparticles synthesized using 0.1M Zn (CH3COO)2.2H2O was greater and the UV spectrum also supports the result. The UV spectrum of varying acidic pH (1, 3, 5) and neutral pH (7) showed lower absorbance, which indicated that pH (1, 3, 5 and 7) are unfavorable condition for the synthesis of SU-ZnO NPs23. Moreover, at high acidic medium (pH-1 and 3), there was no formation of nanoparticles. Also, the sizes of the nanoparticles formed at acidic medium are comparatively larger than basic medium evidenced in literatures24. In the basic medium, pH 9 found to be the most suitable condition based on the yield and λmax. The staggered UV-Vis spectrum of various pH conditions has been shown in Fig.7. Incubation is one of the prominent features in the synthesis of nanoparticles. The UV-Vis spectrums for various trails of incubation (30℃, 40℃, 50℃, 60℃, 70℃, 80℃ and 90℃) are shown in Fig. 8. The optimum temperature for the synthesis of SU-ZnO NPs was found at 70℃ as its residue produced maximum absorbance and high yield. The incubation was increased from 15 minutes to 3.5 hrs and the UV-Vis spectrum was shown in Fig. 9. The yield increased with increase in the incubation time. The yield for 2.5 hrs, 3 hrs and 3.5 hrs was relatively high. Maximum absorbance was established for 3 hrs and hence the optimum incubation time was fixed as 3 hrs.
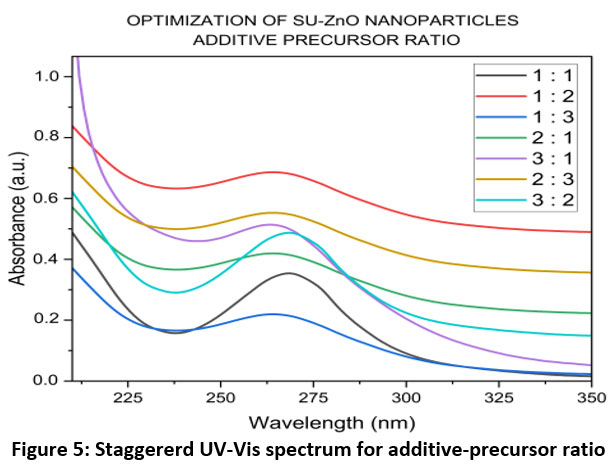 |
Figure 5: Staggererd UV-Vis spectrum for additive-precursor ratio. |
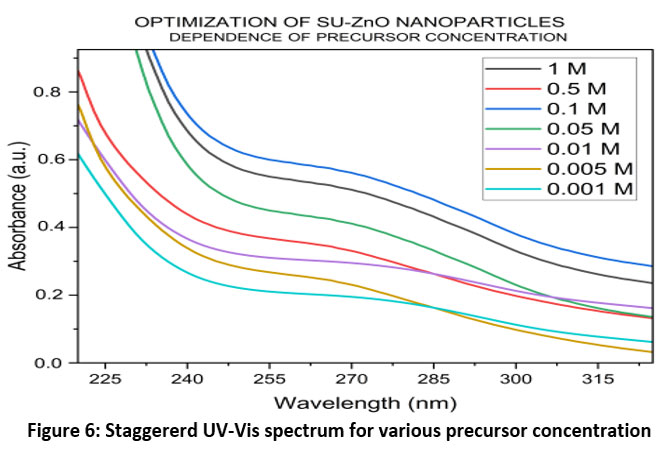 |
Figure 6: Staggererd UV-Vis spectrum for various precursor concentration. |
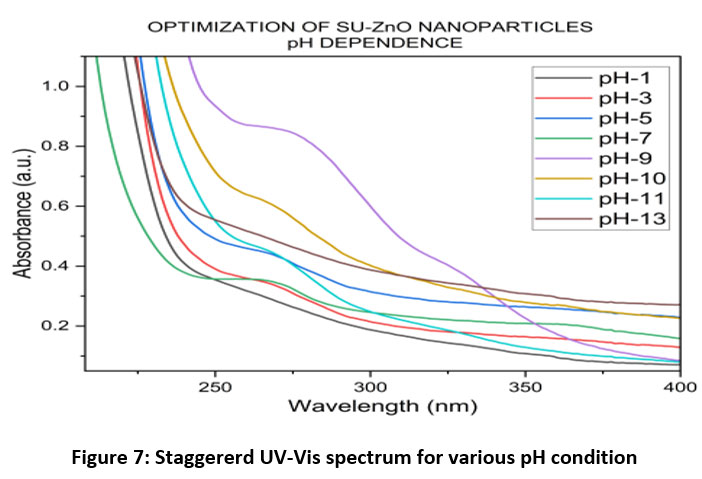 |
Figure 7: Staggererd UV-Vis spectrum for various pH condition. |
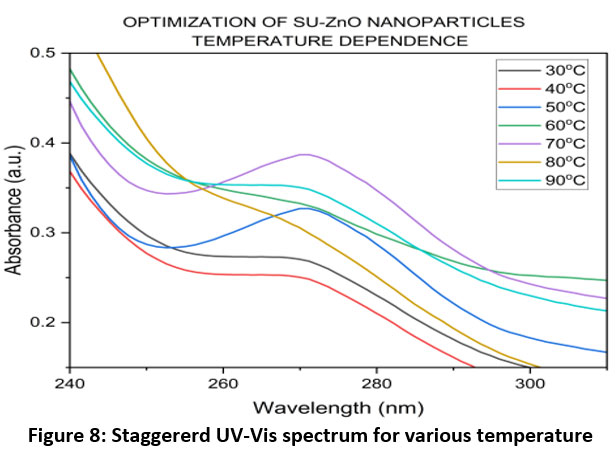 |
Figure 8: Staggererd UV-Vis spectrum for various temperature |
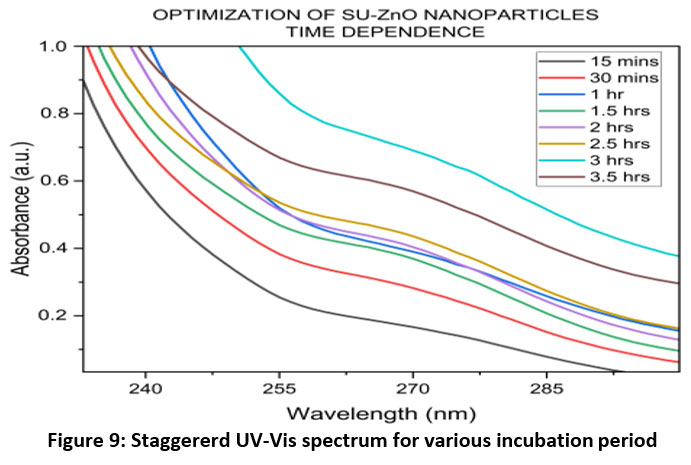 |
Figure 9: Staggererd UV-Vis spectrum for various incubation period. |
Characterization of SU-ZnO NPs
The FTIR analysis of the synthesized SU-ZnO NPs displayed in Fig 10, were recorded from 400 to 4000 cm-1 that identifies the stretching and bending vibrational frequency, thereby deduces the functional group and structure of nanoparticles25. Peak at 3438 cm-1 corresponded to vibrational frequency of hydroxyl group that was chemically absorbed on SU-ZnO NPs. The characteristic zinc-oxygen bond (Zn–O) was obtained at 538 cm-1, a sharp narrow peak which confirmed the formation of ZnO NPs26. Additionally peaks at 1037 cm-1, and 1637 cm-1 were obtained which are related to the stretching vibrations of skeletal C−C and alkenyl group respectively, and peak at 1385 cm-1 shows bending vibration of methyne group 27. It is evident that the influence of bioactive compounds in SU during the synthesis of ZnO NPs accounts for the appearance of vibrations related to organic functional group.
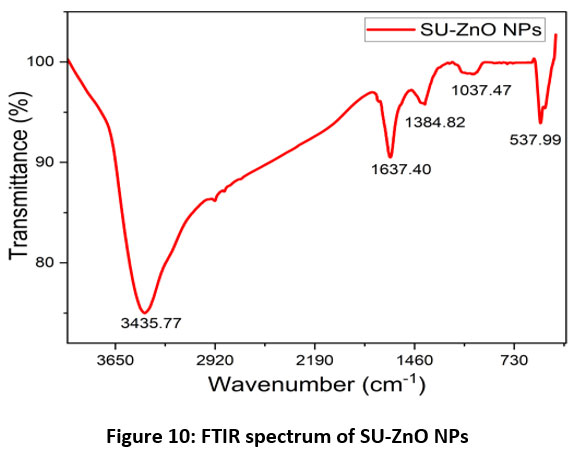 |
Figure 10: FTIR spectrum of SU-ZnO NPs. |
The light absorption characteristics of the fabricated SU-ZnO NPs were analyzed through UV-DRS spectroscopy. A strong absorbance edge was shown at 352 nm and its corresponding Tauc plot revealed band gap energy equivalent to 3.16 eV28, shown in Fig 11a and b. Using the Tauc and Davis-Mott model (Equation 2), tauc plot was constructed with x-axis holding the values of energy (hν) in eV units and y-axis possessing the data of (α .hν)n in (eV. cm-1)n units. ZnO comes under n-type II-IV semiconductors which has direct band gap, i.e the electron momentum of the valence and conductance band has the same value and hence n=229.
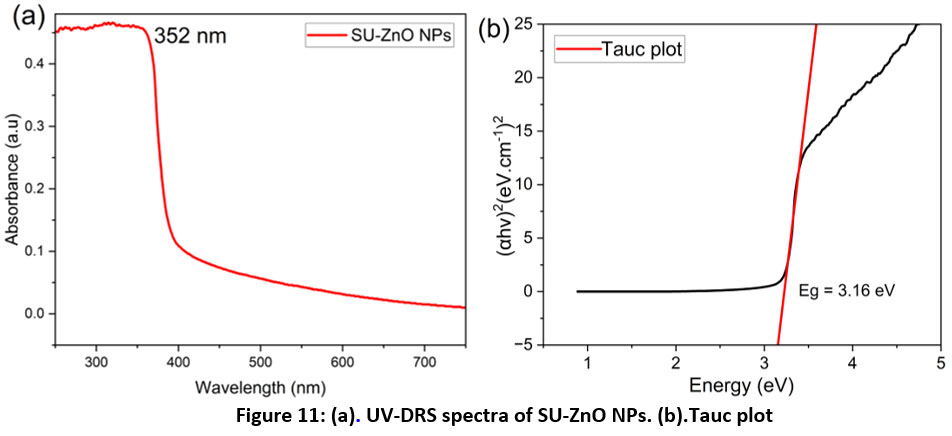 |
Figure 11: (a). UV-DRS spectra of SU-ZnO NPs. (b).Tauc plot. |
Fig.12. illustrate the XRD pattern of the synthesized SU-ZnO NPs which correlated to the JCPDS no. 36–145130. Sharp and strong peaks in XRD typically specify the presence of well-ordered crystalline structures. The diffraction angles of SU-ZnO NPs are 31.76⁰, 34.43⁰, 36.25⁰, 47.55⁰, 56.61⁰, 62.88⁰, 67.98⁰, 69.09⁰ and 76.97⁰ which are indexed to the corresponding lattice planes (100), (002), (101), (102), (110), (103), (112), (201) and (004). The mean crystallite size of SU-ZnO NPs was 24.95 nm, evaluated using the Debye Scherrer expression (Equation 3). Parameters required for determining the crystalline size are tabulated in the following Table 2. There was no additional diffraction angles obtained in the XRD spectrum, depicted the purity of the nanoparticles and from the standard the nature of the nanoparticle was found to be hexagonal wurtzite crystal structure31.
Table 2: Crystalline size calculation using Debye Scherrer expression
| Miller indices h k l | Peak position (2θ) | FWHM (β) | Crystalline size (nm) |
| 1 0 0 | 31.7671 | 0.31 | 26.644 |
| 0 0 2 | 34.4256 | 0.3436 | 24.2069 |
| 1 0 1 | 36.2529 | 0.3158 | 26.4672 |
| 1 0 2 | 47.5527 | 0.3261 | 26.6218 |
| 1 1 0 | 56.6059 | 0.4457 | 20.2431 |
| 1 0 3 | 62.8785 | 0.4708 | 19.7779 |
| 1 1 2 | 67.9821 | 0.5556 | 17.2466 |
| 2 0 1 | 69.0915 | 0.643 | 15.0011 |
| 0 0 4 | 76.9687 | 0.2414 | 42.0451 |
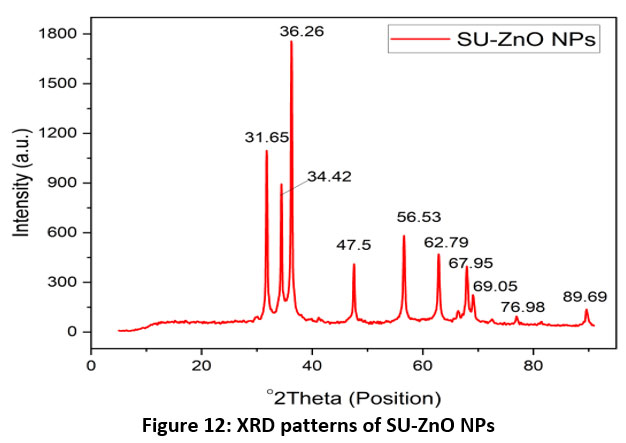 |
Figure 12: XRD patterns of SU-ZnO NPs. |
The cumulative particle sizes of the ZnO NPs were determined using DLS technique. The smaller particles produce high movement/ diffusion originated from the collision with solvent particles32. This increased diffusion creates high fluctuation in intensity of scattered light and hence correlation of the signal decline rapidly. Fig.13.(a) represents the auto-correction plot, where the correlation signal falls off swiftly indicating the influence of small sized particles. G2(T) is the second order correction function which quantifies the fluctuation in the intensity of scattered lights. The translational diffusion constant (D) was 5.629×10⁻⁸ cm2/sec. Using the Stokes-Einstein expression (Equation. 4), the hydrodynamic diameter was determined as 97.4 nm33. Based on the autocorrelation factor, the size of all the particles present in the specimen were determined and plotted against the differential intensity of size distribution in Fig.13(b).
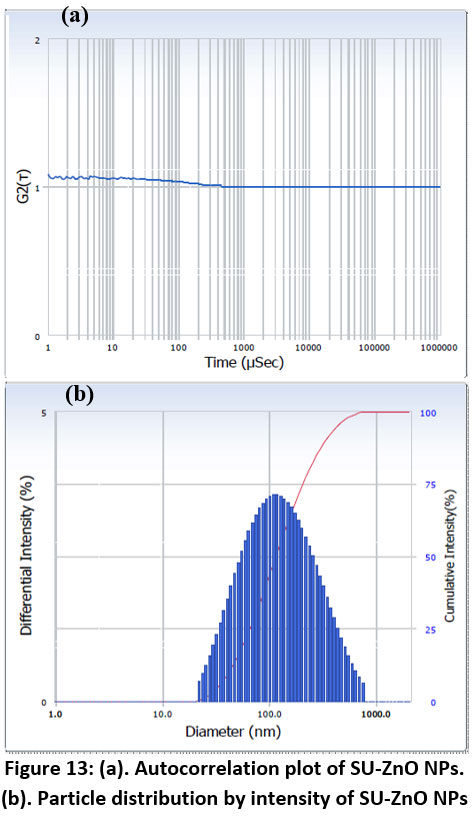 |
Figure 13: (a). Autocorrelation plot of SU-ZnO NPs. (b). Particle distribution by intensity of SU-ZnO NPs |
The zeta potential was determined by dispersing 100mg of SU-ZnO NPs in 10 mL of DI water and ultra-sonicated for 5 minutes, in order to ensure uniform dispersion. The magnitude of zeta potential measures the stability of the colloidal suspension which was equivalent to -27 mV and conductivity was 0.150 mS/cm. High zeta potential infer that there is a strong double layer electrostatic repulsion which prevents from aggregation and reduces solubility34. A sharp single peak deduces the presence of high repulsion between nanoparticles and negative charge accounts for the influence of biomolecules from plant extract that act as a stabilizing agent to prevent the agglomeration of nanoparticles. The zeta potential distribution plot was shown in Fig. 14.
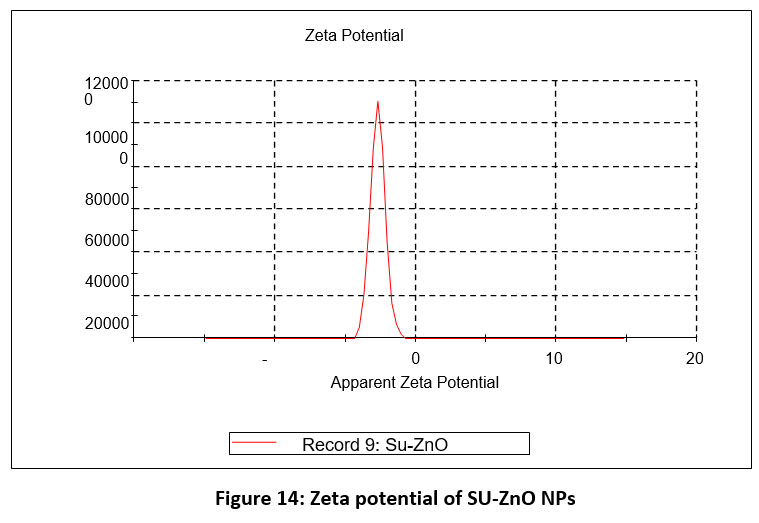 |
Figure 14: Zeta potential of SU-ZnO NPs. |
The morphology of the biosynthesized SU-ZnO NPs are manifested in Fig 15 (a-b) with magnification 30-65 kx. An interconnected segment like nanorods are formed with average particle size ~98.16 nm, derived from the histogram of particle size distribution shown in Fig.15(c). Since the nanorods are interconnected, rather than being agglomerated, they developed enhanced properties in mechanical, conductance and durability. It forms unfolded and mesoporous structure with high active sites (surface area), thereby furnish a pathway of widespread applications35. The chemical composition and presence of impurities are identified using EDS plot indicated in the Fig. 15(d). The elemental weight percentage of Zn and O were 80.63% and 19.37% respectively. The atomic percentage represents the proportion of atoms of each element relative to the total number of atoms in the sample. In this case, the atomic percentages of Zn and O are 50.47% and 49.53% respectively, signifies that the composition of both the elements are equal. This indicates that Zn and O are in the form of ZnO and not in other unstable variants like ZnO2, ZnO3, ZnO4, Zn2O and Zn2O336.
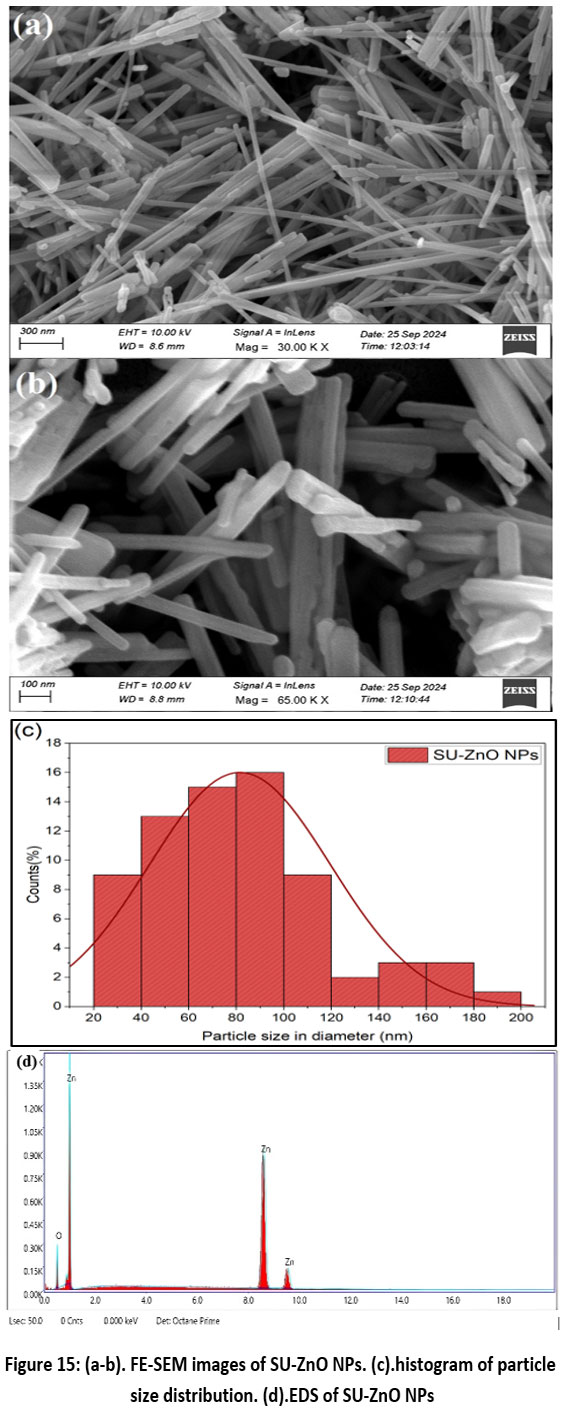 |
Figure 15: (a-b). FE-SEM images of SU-ZnO NPs. (c).histogram of particle size distribution. (d).EDS of SU-ZnO NPs. |
The HR-TEM images (figure 16 a-b) clearly depict well-defined ZnO nanorods, consistent with the morphology observed in FE-SEM. These nanorods exhibit a high aspect ratio and appear interconnected rather than agglomerated. This contributes to the enhanced mechanical stability, electrical conductivity, and durability. The mesoporous structure increases active surface sites, which is beneficial for applications in catalysis, gas sensing, and energy storage37. Figure 16(c) further reveals lattice fringes with an interplanar spacing of approximately 0.26 nm, corresponding to the (002) plane of wurtzite ZnO. This observation confirms the high crystallinity of the synthesized nanoparticles, which aligns with the sharp and intense diffraction peaks correlated to the XRD of SU-ZnO NPs. The SAED pattern displays well-defined diffraction rings indexed to the major ZnO crystallographic planes (100), (002), (101), (110) and (103) related to the JCPDS no. 36–1451, further verifying the polycrystalline nature of the ZnO nanorods38. The absence of additional diffraction spots suggests high phase purity, reinforcing the structural integrity of the synthesized material. These findings confirm that the biosynthesized SU-ZnO NPs exhibit a highly crystalline wurtzite structure with an interconnected nanorod network, making them ideal candidates for advanced applications in photocatalysis, sensors, and energy storage.
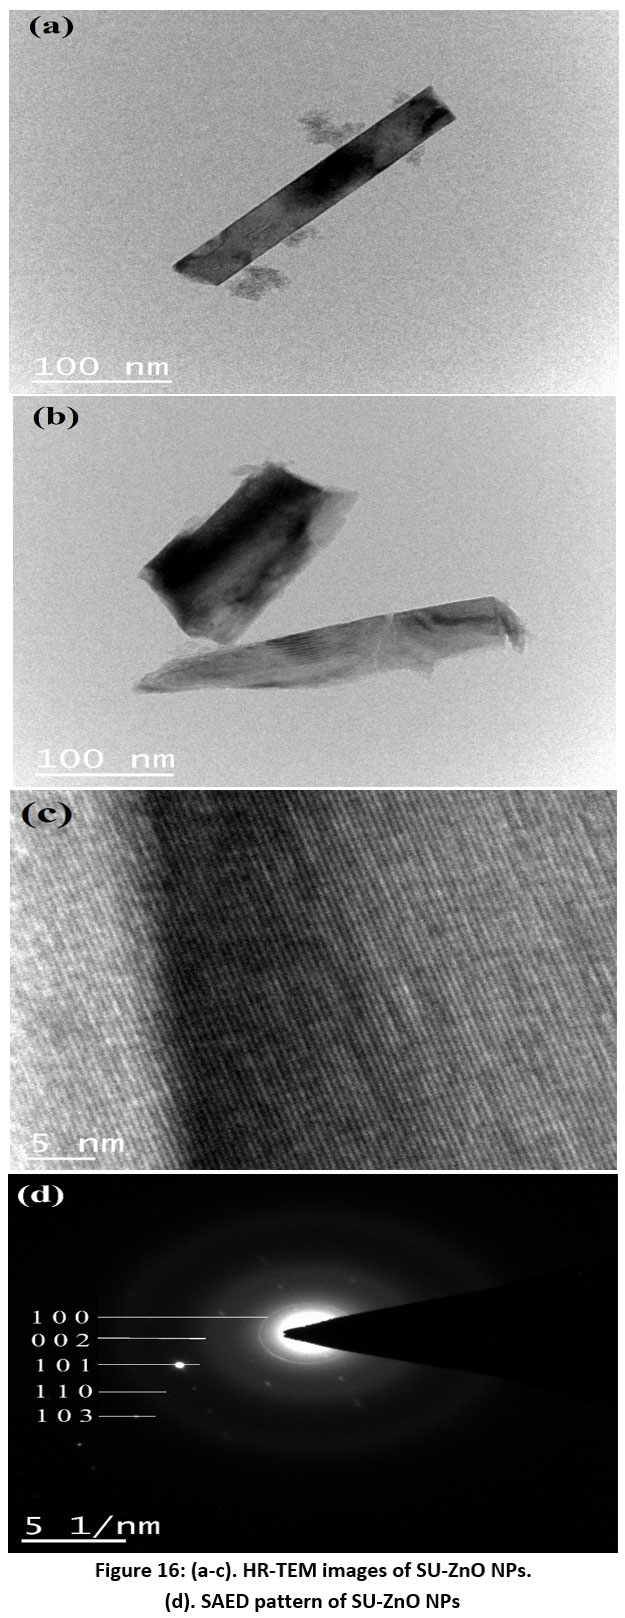 |
Figure 16: (a-c). HR-TEM images of SU-ZnO NPs. (d). SAED pattern of SU-ZnO NPs. |
Conclusion
This study successfully demonstrated the green synthesis of ZnO NPs using SU peel extract, establishing an environmentally benign and sustainable method. The optimization of key synthesis parameters—1:2 additive-precursor ratio, 0.01M zinc acetate, pH 9, 70°C, and 3-hrs incubation—resulted in well-defined nanoparticles. UV-DRS analysis confirmed a direct band gap of 3.16 eV, suggesting optoelectronic applications. FTIR validated the presence of Zn–O bonds and the role of bioactive compounds in stabilization. XRD confirmed a hexagonal wurtzite structure with a 24.95 nm crystallite size and high crystallinity. SEM revealed interconnected nanorods (~98.16 nm), while EDS confirmed elemental composition. DLS analysis (97.4 nm) indicated a uniform size distribution, and zeta potential measurements showed strong electrostatic repulsion, ensuring stability. HR-TEM images further confirmed the presence of well-defined ZnO nanorods with a high aspect ratio and lattice fringes (~0.26 nm) corresponding to the (002) plane, reinforcing the high crystallinity. These findings underscore the efficacy of SU peel extract in biosynthesis, promoting green chemistry, valorizing agricultural waste, and enabling diverse applications in biomedical, environmental, and technological fields.
Acknowledgement
The authors gratefully acknowledge the management and the PG & Research Department of Chemistry at Holy Cross College (Autonomous), Trichy, for their support and the resources provided to conduct this research.
Conflict of Interest
The authors confirm that there are no conflicts of interest related to the research, authorship, or publication of this article.
References
- Kamaraj, C.; Naveenkumar, S.; Kumar, R. C. S.; Al-Ghanim, K. A.; Natesan, K.; Priyadharsan, A., Journal of Drug Delivery Science and Technology, 2025, 105, 106585.
CrossRef - Mande, D. D.; Kumbhare, M. R.; Surana, A. R., Infectious Diseases and Herbal Medicine,2023, 4(1).
CrossRef - Mandal, A. K.; Katuwal, S.; Tettey, F.; Gupta, A.; Bhattarai, S.; Jaisi, S.; Parajuli, N., Nanomaterials,2022, 12(17), 3066.
CrossRef - Liu, Y.; Chen, H.; Chen, S.; Zhang, Y.; Zhang, J.; Zhu, X.; Li, D., Food Chemistry, 2023, 429, 136955.
CrossRef - De Mello, F. R.; Bernardo, C.; Dias, C. O.; Züge, L. C. B.; Silveira, J. L. M.; Amante, E. R.; Candido, L. M. B., Fruits, 2014,69(5), 381-390.
CrossRef - Nivas, M. D.; Vijaya, K. N., Research Journal of Phytochemistry, 2024, 18 (1), 13-19.
CrossRef - Putra, N. R.; Rizkiyah, D. N.; Faizal, A. N. M.; Aziz, A. H. A, Waste Management Bulletin, 2024, 2(2), 49-58.
CrossRef - Dutta, D., Journal of Sol-Gel Science and Technology,2016, 77, 48-56.
CrossRef - Tharp, W. F.; Karem, L. K. A., Moroccan Journal of Chemistry, 2024, 12(2), 643-656.
- Qadir, S. A.; Fathulla, C. N.; Amin, S. A.; Polytechnic Journal, 2024,13(1), 23.
CrossRef - Chemingui, H.; Moulahi, A.; Missaoui, T.; Al-Marri, A. H.; Hafiane, A., Environmental Technology, 2024,45(5), 926-944.
CrossRef - Andrade, P. H.; Volkringer, C.; Loiseau, T.; Tejeda, A.; Hureau, M.; Moissette, A., Applied Materials Today,2024, 37, 102094.
CrossRef - Alam, M. K.; Hossain, M. S.; Bahadur, N. M.; Ahmed, S., Journal of Molecular Structure, 2024, 1306, 137820.
CrossRef - Kamal, A.; Yang, J.; Batool, M.; Ara, U.; Khattak, W. A.; Touhami, D.; Elshikh, M. S., Journal of Crop Health, 2025, 77(1), 1-12.
CrossRef - Serrano-Lotina, A.; Portela, R.; Baeza, P.; Alcolea-Rodríguez, V.; Villarroel, M.; Ávila, P., Catalysis Today, 2023, 423, 113862.
CrossRef - Jia, Z.; Li, J.; Gao, L.; Yang, D.; Kanaev, A., Colloids and Interfaces, 2023, 7(1), 15.
CrossRef - Irudayaraj, A. R. S.; John, F. F.; Chinnasamy, D. P.; Raman, K.; Joseph, A. I. J., Zastita Materijala, 2025, 66, 1-13.
- Hipni, R.; Maslani, N.; Daiyah, I.; Rizani, A., Pharmacognosy Journal, 2023, 15(6).
CrossRef - Kanmani, R.; Florence, J. F.; Joice, J.; Megala, R.; Kavitha, M., Oriental Journal of Chemistry, 2023, 39(4).
CrossRef - Subhani, A. A.; Irshad, M.; Ali, S.; Jawad, M.; Akhtar, M. F.; Summer, M., Journal of Fluorescence, 2024, 34(2), 655-666.
CrossRef - Villagrán, Z.; Anaya-Esparza, L. M.; Velázquez-Carriles, C. A.; Silva-Jara, J. M.,; Ruvalcaba-Gómez, J. M.; Aurora-Vigo, E. F.; Martínez-Esquivias, F.,Resources, 2024, 13(6), 70.
CrossRef - Perkasa, D. P.; Arozal, W.; Cholil, M. Y. Y. B. I.; Purwanti, T., AIP Conference Proceedings, 2024, 2967(1).
CrossRef - Basuliman, M. M.; Bamahel, A. S.; Al-Kathiri, D. G.; Al-Suhily, A. M., Moroccan Journal of Chemistry, 2023, 11(2), 11-2.
- Rasool, A.; Kiran, S.; Gulzar, T.; Abrar, S.; Ghaffar, A.; Shahid, M.; Naz, S., Journal of Cleaner Production,2023, 398, 136616.
CrossRef - Femina, F.; Thabassoom, H. A.; Ruby, S. A.; Florence, J. F., Oriental Journal of Chemistry, 2021, 37(4), 911.
CrossRef - Jalasutram, J. K.; Nowduri, A.; Kumari, P. P.; Shaik, T. B., Moroccan Journal of Chemistry, 2024, 12(1), 12-1.
- Ismail, S. M. M.; Ahmed, S. M.; Abdulrahman, A. F.; Al-Messiere, M. A., Journal of Molecular Structure, 2023,1280, 135063.
CrossRef - Naseer, H.; Iqbal, T., Ceramics International, 2023, 49(5), 8634-8645.
CrossRef - Thabassoom, H. A.; Florence, J. F., Surface Review and Letters, 2024, 2550058.
- Jayachandran, A.; Aswathy, T. R.; Nair, A. S., Biochemistry and Biophysics Reports, 2021, 26, 100995
CrossRef - Shitu, I. G.; Katibi, K. K.; Muhammad, A.; Chiromawa, I. M.; Tafida, R. A.; Amusa, A. A.; Babani, S., Optical and Quantum Electronics, 2024, 56(2), 266.
CrossRef - Erdoğan, Ö.; Paşa, S.; Demirbolat, G. M.; Birtekocak, F.; Abbak, M.; Çevik, Ö., Inorganic and Nano-Metal Chemistry, 2025, 55(1), 67-75.
CrossRef - Rodriguez-Loya, J.; Lerma, M.; Gardea-Torresdey, J. L., Micromachines, 2023, 15(1), 24.
CrossRef - Mohammad, F.; Bwatanglang, I. B.; Al-Lohedan, H. A.; Shaik, J. P.; Al-Tilasi, H. H.; Soleiman, A. A., Coatings, 2023, 13(1), 172.
CrossRef - Sharma, R.; Kumar, N.; Sharma, P.; Yadav, A.; Aggarwal, N. K. Results in Surfaces and Interfaces, 2025,18, 100372.
CrossRef - Nivethika, D.; Raji, P., Physica Scripta, 2024, 99(8), 085981.
CrossRef - Ammu, V. K.; Pushpadass, H. A.; Franklin, M. E. E.; Duraisamy, R., Journal of Molecular Structure, 2025,1323, 140737.
CrossRef - Tamizhselvan, A.; Muthumanickam, D.; Murugesan, A. K.; Malathi, G.; Liu, B.; Sengottuvelan, B., Surfaces and Interfaces, 2025, 59, 105906.
CrossRef
Accepted on: 02 Mar 2025


![]()


