Advanced UPLC-Photo Diode Array Method for Precise Quantification of Sotagliflozin in Bulk and Commercial Formulations
 , Prasenjit Mondal1*and Suman Acharyya2
1Department of Pharmaceutical Technology, Brainware University, Ramkrishnapur Rd, Barasat, Kolkata, West Bengal, India
2Netaji Subhas Chandra Bose Institute of Pharmacy, Chakdaha - Bongaon Rd, Roypara, Tatla, West Bengal, India.
Corresponding Author E-mail:prasenjitmyname@gmail.com
DOI : http://dx.doi.org/10.13005/ojc/410238
Download this article as:
![]()
The estimation of sotagliflozin in tablet and bulk dose forms was accomplished by developing and validating an ultra-performance liquid chromatographic technique. A 2.1 x 50 mm, 1.7-micron BEH Waters UPLC column was used to do the chromatographic separation. The eluent was detected by UV at 225 nm using a mobile phase consisting of 70% acetonitrile and 30% OPA buffer (0.1% ortho-phosphoric acid) in isocratic mode. The approach was upheld and verified in accordance with the rules of the international conference on harmonization. The validation investigation confirmed the technique's accuracy and dependability. The retention time for sotagliflozin elution was 0.516 minutes. linearity was demonstrated in the concentration range of 10–50 μg/mL by the standard calibration curve for sotagliflozin. It was determined that the detection limit, or LOD, was 0.05 μg/mL, while the quantitation limit, or LOD, was 0.10 μg/mL. Stability was evidenced in the force degradation evaluation by the present approach. Empirical evidence has established that it is appropriate to estimate Sotagliflozin in both tablet and bulk dosage forms.
KEYWORDS:ICH Guidelines; Method Validation; Sotagliflozin; UPLC, Method Development
Introduction
Sodium-dependent glucose cotransporter (SGLT) inhibitors have garnered significant attention as a prospective treatment for diabetes mellitus. A number of SGLT2-selective inhibitors have been approved by authorities to reduce blood glucose levels by preventing the kidneys from reabsorbing glucose1. Clinical research has demonstrated that Sotagliflozin (C21H25ClO5S), a pharmaceutical candidate from Lexicon, helps patients with depressed renal function by decreasing the gastrointestinal tract’s absorption of glucose. It is an inhibitor of both SGLT1 (mostly located in the gut) and SGLT2 (mainly found in the kidneys)2. Sotagliflozin features a unique chemical structure with five adjacent chiral centers, which augment its selective activity3. The molecular weight is 424.9 g/mol, and the IUPAC designation is 2-[4-chloro-3-[(4-ethoxyphenyl) methyl] phenyl]-6-methylsulfanyloxane-3,4,5-triol4. Sotagliflozin undergoes metabolism via hepatic and renal routes, mostly producing inert glucuronide conjugates. Studies assessing a liquid formulation with dosages up to 500 mg have determined that its pharmacokinetic half-life and elimination are 29 hours. On the seventh day, the peak plasma concentration (Cmax) following several doses was 165 ng/mL, with the cumulative exposure (AUC₀−τ) amounted to 1172 ng·h/mL. Sotagliflozin is more appropriate for once-daily use due to its prolonged half-life5,6,7. To develop and establish the analytical procedures for sotagliflozin and its tablet dosage form utilizing a variety of analytical techniques and contemporary analytical methods, a thorough literature review was conducted. It was observed that, other from a few pertinent publications on pharmacological and toxicological issues, no analytical method for this specific substance has been accessible. The analytical processes, whether proprietary or undisclosed by manufacturers. Consequently, Sotagliflozin is extensively prescribed in the Indian market8, necessitating the development of a validated rapid analytical method employing contemporary instruments. This will benefit research laboratories, research and development sectors of small-scale industries, and facilitate the routine analysis of Sotagliflozin, both as an active pharmaceutical ingredient and within pharmaceutical formulations. In order to accomplish the stated goal, the authors of this article have worked to create and publish an accurate and trustworthy analytical method for sotagliflozin. The approach was designed and validated in accordance against the International Conference on Harmonization’s (ICH) Q2 (R1) requirements 9,10. Furthermore, an attempt was undertaken to delineate the forced degradation profile of the pharmaceutical under diverse stress circumstances, encompassing acidic, basic, peroxide, thermal, and photolytic stress.
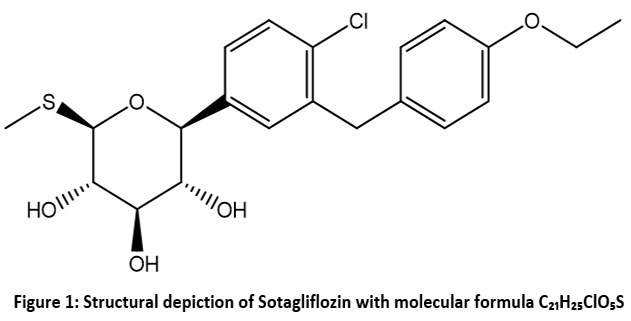 |
Figure 1: Structural depiction of Sotagliflozin with molecular formula C₂₁H₂₅ClO₅S.Click here to View Figure |
Methodology and Resources
Reagents and Chemical Components
Sura Labs, located at SS Towers, 4th floor, next to Kamala Hospital, Gaddiannaram, Hyderabad, Telangana, India, donated a free sample of medical quality working standards of sotagliflozin (99.97% purity). The sotagliflozin tablets used in this study were purchased at a Kolkata neighborhood market. Fisher Scientific, Merck, and Finar Chemicals Ltd. provided all of the chemicals, the reagents and solvents needed for developing methods, validation, and stability studies.
Operational Conditions of Instruments
Acquity Waters Ultra Performance Liquid Chromatography (UPLC) with a PDA detector was used for the analysis. The software is Empower 2, which includes an Auto Sampler, PDA detector, pH meter (Adwa-AD 1020), analytical balance (Afcoset ER-200A) with a 0.1 mg sensitivity, and Ultra Sonicator. This experiment uses a BEH Waters 2.1 x 50mm, 1.7-micron UPLC Column that has an isocratic flow rate of 0.25 ml/min. The column was maintained at ambient temperature, with an injection volume of 5 μL and a total run time of 3 minutes. The wavelength of detection was 225 nm.
Orthophosphoric acid 0.1% preparation
A 0.1% OPA buffer solution is made by mixing 1 ml of ortho phosphoric acid with 1000 ml of water. The solution can be modified to pH 3 with the incorporation of sodium hydroxide 11.
Mobile Phase Development
Combine 300 ml of 0.1% OPA buffer (30%) with 700 ml of UPLC grade Acetonitrile (70%) and sonicated in an ultrasonic water bath for 5 minutes. Filter under vacuum filtering using a 4.5 µ filter12.
Preparation and Dilution of Standard Solution
Weighed and transferred with precision 10 mg of Sotagliflozin into a 10 ml dry and clean volumetric flask, subsequently followed by the addition of 2ml of acetonitrile. The solution was sonicated until completely dissolved, and the volume was set to the calibration mark with the prepared mobile phase (standard stock solution). From the previously indicated stock solution, 0.3 ml of sotagliflozin was placed into a volumetric flask of 10 ml and the diluent is then poured into it up to the mark 13.
Assay of marketed dosage form
Sotagliflozin tablets (200 mg) were broken down and accurately measured to obtain 10 mg of Sotagliflozin, thereafter transferred into a 10 ml fresh, dried volumetric flask. To completely dissolve the sample, introduce 2ml of acetonitrile, sonicate, and thereafter utilize the prepared mobile phase to make the volume up to the mark. It is then passed through an injection filter with a pore size of 0.45 microns, which is considered the stock solution. Then take 0.3 ml of sotagliflozin from the stock solution mentioned above and put it in a 10 ml volumetric flask. Then, use the mobile phase to dilute it up to the mark. Fill the chromatographic system with 5 μl of the standard, sample and measure the areas that correspond to both Sotagliflozin peaks, then estimate the assay percentage13.
Method Validation
Specificity
The sample solution was subjected to a placebo interference experiment with 200 milligrams of placebo (one tablet) dissolved in 100 ml of mobile phase. As the reference solution placebo solution was used. The prepared solution was then subjected into the chromatographic system to evaluate any interfering peaks 14.
Instrumentation Suitability Check
This investigation’s goal was to verify that the method of analysis is operating as intended. For this study, a 10 μg/mL standard solution was prepared from the standard stock solution Six duplicates were injected with a standard solution of sotagliflozin to perform the procedure. The percentage relative standard deviation (%RSD) (limit is below 2%) was calculated for several optimal parameters, including peak area, retention period, theoretical plates, and asymmetry factor15.
Accuracy
To support the accuracy of the proposed method, recovery trials were conducted at various concentrations of pure sotagliflozin (50%, 100%, and 150%). For this study, the pure Sotagliflozin was spiked into the placebo tablet sample solution and the labels were made 50% (contains 5mg), 100% (contains 10mg) and 150% (contains 15mg). This investigation was conducted three times, and the percentage recovery together with the mean recovery percentage was determined16.
Precision Evaluation (Intraday and Interday)
The method’s accuracy was assessed by determining at 10 µg/mL of the Sotagliflozin solution both intra-day and inter-day studies. The assessment entailed the analysis of six test solutions with triplicate (n=6) of a 10 µg/mL Sotagliflozin solution. Performing six analyses on the same day (intra-day study) and repeating the procedure on the second and third days (inter-day study) allowed for the assessment of both intra- and inter-day precision. The chromatograms were taken into account. The relative standard deviation (RSD) has been established after determining the peak area along with the retention time of sotagliflozin17.
Minimal Detectable and Quantifiable Concentrations
The detection limit, or LOD, is defined as the concentration yielding a signal-to-noise proportion of 3, whereas the quantitation limit, or LOQ, is defined at a signal-to-noise proportion of 1018. Ten milligrams of sotagliflozin were precisely measured and put into a sterile, dried 10 mL volumetric flask in order to create standard solutions of the drug. After adding the diluent, the mixture has been sonicated to guarantee total dissolve. The solvent was then used to dilute the solution to the necessary volume. Using a progressive dilution technique, a range of concentrations from 0.01 to 10 µg/mL was obtained by pipetting specific quantities from the initial stock solution to create a series of aliquots. Following that, the aliquots were gradually added to the chromatographic system in amounts ranging from 0.01 to 10 µg/mL. The LOD was the lowest concentration at which sotagliflozin was detected, and the LOQ was the lowest concentration at which the quantification was carried out.
Linearity
To establish linearity, a working standard solution of Sotagliflozin was made as previously described. An aliquot of the above solution has been diluted with the solvent to acquire five particular concentrations between 10 and 50 µg/ml of Sotagliflozin. A standard calibration curve was generated for the drug being studied, displaying concentration vs peak area, and the resultant data was subjected to regression analysis.
Reliability Under Varied Conditions
The resilience of the novel methodology was assessed by deliberately modifying the chromatographic elution parameters. Six solutions of the sample were prepared and the analysis was carried out in triplicate under specified conditions by modifying analytical parameters, including flow rate, mobile phase compositions, and detection band at two different levels 19. To evaluate the impact, a single variable was changed at a time. All optimal parameters were identified within the specified limits. The tailing factor was considered in the estimation of percent RSD.
Stability-Indicating Degradation Assessment of Sotagliflozin
Investigation on force degradation was performed under several ICH suggested stress environments, involving acidic, basic, oxidative, thermal, and photolytic stresses. Every sort of degradation investigation was carried out in triplicate, and estimations were made using the mean peak area20.
Acid degradation
The acid degradation study was carried out using 1M HCl at 60°C and 75% relative humidity in a controlled testing chamber (Acamus Technologies, India). After adding 0.3 mL of 1 M HCl into a 10 mL volumetric flask containing 0.3 mL of the stock solution (1 mg/mL), the flask was left in an environmental test room for 16 hours. 1M NaOH was used to neutralize the solution after the stress period, and mobile phase was used to replenish the volume.
Base degradation
A base degradation study was carried out using an identical environmental chamber at 60°C and 75% of relative humidity. In a 10 ml volumetric flask, the 0.3 ml of the standard solution and 0.3 ml of 1 M sodium hydroxide were mixed and left for 16 hours. The solution was treated with 1 M HCl after the appropriate stress period, and the mobile phase was used to adjust the volume.
Oxidative Breakdown
The experiment was carried out using a 30% w/v hydrogen peroxide solution in a variable environmental compartment at 40°C and 75% of relative humidity. This was done by putting 0.3 ml of the stock solution into a 10 ml volumetric flask and then introducing a single ml of 30% w/v hydrogen peroxide into it. After 15 minutes of standing at ambient temperature, the mixture’s volume was adjusted using the mobile phase.
Thermal degradation
Following an oven treatment at 110°C, the experiment was carried out in a chamber with environmental conditions of 40°C and 75% of relative humidity. A 10 ml volumetric flask containing 0.3 ml of the initial solution was kept in the chamber for three hours. The sample was then diluted with a diluent and subjected to UPLC analysis.
Photolytic degradation
Throughout the day, this study was carried out in daylight (60,000–70,000 lux) and under UV light for 48 hours at 254 nm. Upon transferring 0.3 ml of the initial solution into a 10 ml volumetric flask, the volume was adjusted using the mobile phase for the study.
Experimental Findings
A stability-indicating UPLC method that is specific, linear, and accurate for measuring sotagliflozin was created by analysing several chromatographic conditions. This investigation employed isocratic elution. Among the studied columns, the BEH Waters column (2.1 x 50 mm, 1.7 µm) turned out to be optimal, providing improved peak shape and absorbance. Based on the API’s solubility with different buffer and organic solvent ratios, including methanol and acetonitrile, the mobile phase was determined to be 0.1 percent Ortho Phosphoric Acid (with a pH 3.0) and acetonitrile with a 30:70 v/v ratio. Sotagliflozin’s retention time was found to be 0.516 minutes, as illustrated in Figure 2. The calibration curve demonstrated remarkable linearity for Sotagliflozin in the measured concentration range of 10–50 µg/mL, with an apparent correlation coefficient (R²) of 0.999. The formula for regression for the standard calibration curve is y=15274x + 51822, indicating a strong linear relationship in between concentration and response. The accuracy study revealed mean percentage recovery values of 100.38% (50%), 99.35% (100%), and 99.34% (150%), each falling within the suitable range of 98–102%, with percentage relative standard deviation values below 2%, as shown in Table 2 below. The precision research demonstrated a repeatability % RSD of 0.70, intraday precision % RSD of 0.50, and interday precision % RSD of 0.50, hence affirming the method’s reproducibility. Sotagliflozin has a limit of detection, or LOD, of 0.05 µg/mL and a limit of quantification, or LOQ, of 0.10 µg/mL, indicating high sensitivity of the procedure. The analysis of Sotagliflozin tablets from Lexicon Pharmaceutical Ltd. revealed a purity of 99.39%, equating to 198.78 mg of the specified 200 mg content, as illustrated in Table 1. The method’s resilience was demonstrated by the % RSD measurements for the tailing factor of less than 2%, as reported in Table 5, as a result of the robustness analysis, which comprised modifications in the composition of the mobile phase (±5%), flow rate (±0.02 mL/min), and detection wavelength (±2 nm). Sotagliflozin shown minimal deterioration under stressful settings. The medication exhibited degradation rates of 3.94% in acidic settings, 3.11% in alkaline conditions, 4.87% in oxidative conditions, 3.66% under thermal stress, and 3.11% in photolytic conditions. The results demonstrated that Sotagliflozin exhibited relative stability under stress, with negligible deterioration noted. Figure 4 displays the chromatograms for the stressful situations, while Table 6 provides a comprehensive summary of the data. The observed degradant peaks has not been identified for the present study. The approach’s specificity for sotagliflozin was validated by the absence of co-eluting peaks corresponding to the primary peak, even when degradation products were present.
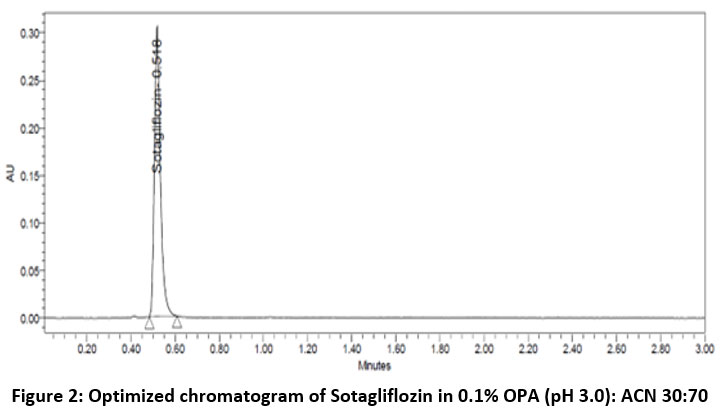 |
Figure 2: Optimized chromatogram of Sotagliflozin in 0.1% OPA (pH 3.0): ACN 30:70Click here to View Figure |
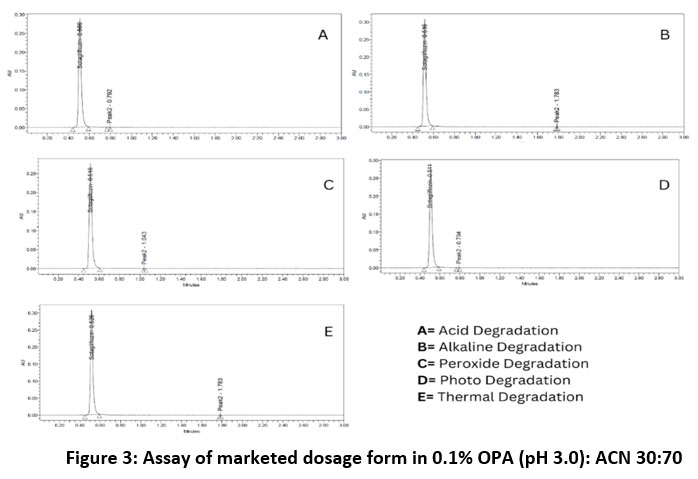 |
Figure 3: Assay of marketed dosage form in 0.1% OPA (pH 3.0): ACN 30:70.Click here to View Figure |
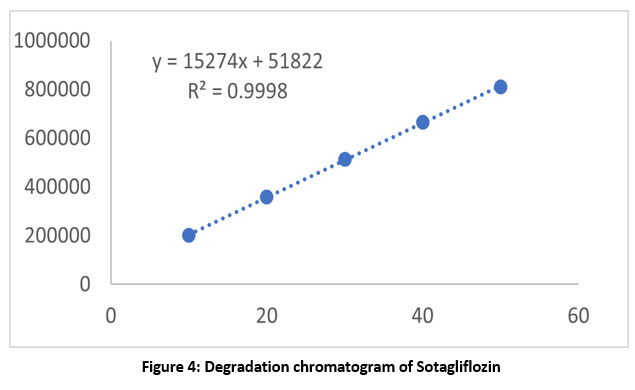 |
Figure 4: Degradation chromatogram of SotagliflozinClick here to View Figure |
Table 1: Assay of marketed formulation
| Brand name of Sotagliflozin | Labelled amount of drug | Mean value (± SD) obtained through the recommended approach (n=6)) | % Assay |
| Inpefa (Sotagliflozin 200mg tablets) (Lexicon Pharmaceuticals) | 200mg | 198.78 | 99.39% |
Table 2: Sotagliflozin’s accuracy findings
| Specified Threshold Concentration | Integrated Peak Region | Mass Introduced (mg) | Amount Found(mg) | % Recovery |
| 50% | 259165 | 5 | 5.02 | 100.38 |
| 100% | 512988 | 10 | 9.93 | 99.35 |
| 150% | 769433 | 15 | 14.9 | 99.34 |
| Mean | – | – | – | 99.69 |
| SD | – | – | – | 0.59 |
| %RSD | – | – | – | 0.55% |
Table 3: Analytical System Suitability Results for Sotagliflozin
| S. No | System Suitability Results | ||
| Mobile Phase Flow Rate (ml/min) | USP Plate Count | USP Tailing | |
| 1 | 0.225 | 3512.96 | 1.33 |
| 2 | 0.25 | 3559.77 | 1.34 |
| 3 | 0.254 | 3565.64 | 1.35 |
| 4 | 0.265 | 3586.32 | 1.34 |
| 5 | 0.273 | 3555.23 | 1.32 |
| 6 | 0.275 | 3577.23 | 1.33 |
| Mean | 3559.53 | 1.335 | |
| SD deviation | 25.517204 | 0.010488 | |
| %RSD | 0.72% | 0.79% | |
Table 4: An overview of the validation parameters
| Parameters | Sotagliflozin |
| Calibration Concentration Range (mg/mL) | 10 to 50 |
| Coefficient of Determination (R²) | 0.999 |
| Lowest Detectable Limit (μg/mL) | 0.05 |
| Lowest Quantifiable Limit (μg/mL) | 0.10 |
| Intra-Day Precision (% RSD) | 0.70 |
| Inter-Day Precision (% RSD) | 0.50 |
| Mean Recovery Rate (%) | 99.69 |
Table 5: Robustness of the method development
| S. No | Change in parameter | % RSD (n=3) |
| 1 | Adjusted Flow Rate: 0.27 mL/min (±0.02 mL) | 0.39 |
| 2 | Flow Rate Adjustment: 0.23 mL/min (−0.02 mL) | 0.46 |
| 3 | Change is mobile phase composition (-5%) | 0.55 |
| 4 | Change is mobile phase composition (+5%) | 0.61 |
| 5 | Wavelength of detection (+2nm) 227nm | 0.33 |
| 6 | Wavelength of detection (-2nm) 223nm | 0.54 |
Table 6: Forced Degradation Study Results for Sotagliflozin Solution
| Sample Name | Sotagliflozin | ||||
| Mean Area | % Degraded | Purity Angle | Purity Threshold | Peak purity | |
| Acidic Degradation | 499327 | 3.94 | 0.438 | 1.219 | Passes |
| Alkaline Degradation | 495047 | 3.11 | 0.665 | 3.329 | Passes |
| Oxidative Degradation | 499327 | 4.87 | 0.546 | 1.264 | Passes |
| Temperature-Induced Degradation | 490258 | 3.66 | 0.379 | 1.146 | Passes |
| Photolytic Degradation | 496473 | 3.11 | 0.786 | 2.744 | Passes |
Discussion
The optimized chromatographic settings were verified following many trials in the current research study. Utilizing the optimized conditions, Sotagliflozin exhibited a satisfactory peak shape and an exceptionally quick retention time of 0.516 minutes, employing a mobile phase consisting of 30:70 v/v acetonitrile and 0.1% orthophosphoric acid (pH 3.0), with a detection band of 225 nm and an effective flow rate of 0.25 mL/min. These settings yielded enhanced resolution, increased theoretical plate count, and improved peak symmetry. The suggested chromatographic settings were considered suitable for the quantitative analysis of Sotagliflozin. The comprehensive validation research results unequivocally substantiated the new approach and its suitability for commercial dosage forms. Every result was determined to satisfy the acceptance criteria. Precision and accuracy were assessed according to ICH norms, with the percentage recovery remaining within the permitted threshold of no more than 2.0%, hence demonstrating the method’s accuracy. The repeatability investigation yielded satisfactory computed amounts and % RSD values, confirming the method’s precision within acceptable limits. Sotagliflozin showed remarkable linearity in the linearity evaluation using the standard method, with a correlation coefficient of 0.9998. The calibration curves showed linearity over the range under investigation, and the regression line was found using the least squares method. The average test percentage of 99.39% was deemed satisfactory, validating the method’s efficacy for analysing Sotagliflozin in commercial dose forms. The sensitivity and effectiveness of the approach were demonstrated by the limit of detection, or LOD, and limit of quantitation, or LOQ, values. The method’s specificity was validated by the specificity analysis, which showed no excipient peaks within the analyte’s retention time. The investigation’s robustness was evaluated by tracking the tailing factor’s percentage RSD while purposefully altering the ideal variables (such as rate of flow, the mobile phase setup, and the wavelength). demonstrated % RSD values below 2.0. This validated the method’s resilience, as no substantial alterations were detected under these adjustments. The forced degradation investigations indicated that Sotagliflozin had minimal degradation under stressful conditions, with marginally greater degradation noted under oxidative (4.87%) and thermal (3.66%) settings relative to acidic (3.94%), alkaline (3.11%), and photolytic (3.11%) conditions. Notwithstanding this, the technique exhibited specificity as Sotagliflozin was eluted without interference from degradation products under all stressful conditions. The findings underscore the stability-indicating efficacy of the devised approach, rendering it exceptionally appropriate for the quantification of Sotagliflozin in diverse formulations.
Conclusion
Based on the observed results of this produced approach, the authors may assert the uniqueness of the present method in comparison to existing methods. This is the inaugural stability-indicating UPLC method that is ‘fast,’ as it substantially decreases the overall analysis time to 0.516 minutes, with the least time required. The current approach is “stability indicating” since it has demonstrated a reduced pattern of deterioration in stressful circumstances and an adequate separation of sotagliflozin from the other deteriorated peaks. All validation parameter findings fell within the ICH Q2 (R1) recommendations’ acceptable range. The current developed method can therefore be used as a new, trustworthy, and validated useful method for regular analysis and quality monitoring assays of sotagliflozin in tablet dosage form.
Conflict of Interest
The authors declare that there is no conflict of interest regarding the publication of this paper.
Source of figures
The chemical structure of the sotagliflozin was drawn using chemdraw software. All the chromatograms were obtained as a result of chromatographic detection of the UPLC system of Empower 2 software. The calibration graph was prepared using Microsoft Excel.
References
- Seidu, S., Alabraba, V., Davies, S., Newland, J. P., Fernando, K., Bain, S. C., et al. SGLT2 Inhibitors – The New Standard of Care for Cardiovascular, Renal and Metabolic Protection in Type 2 Diabetes: A Narrative Review. Diabetes Ther. 2024; 15(5):1099.
CrossRef - Lexicon’s Sotagliflozin Demonstrates Benefits in Heart: https://www.globenewswire.com/news-release/2021/11/14/2333731/0/en/Lexicon-s-Sotagliflozin-Demonstrates-Benefits-in-Heart-Failure-and-Blood-Glucose-Control-Across-the-Full-Range-of-Kidney-Function-in-New-Analysis-of-Clinical-Data.html [accessed on 2024 Dec 7].
- Zhao, M. M., Zhang, H., Iimura, S., Bednarz, M. S., Song, Q. L., Lim, N. K., et al. Process Development of Sotagliflozin, a Dual Inhibitor of Sodium-Glucose Cotransporter-1/2 for the Treatment of Diabetes. Org Process Res Dev. 2020; 24(11):2689–701.
CrossRef - Sotagliflozin | C21H25ClO5S | CID 24831714 – PubChem: https://pubchem.ncbi.nlm.nih.gov/ compound/ Sotagliflozin [accessed on 2024 Dec 7].
- Bhatt, D. L., Szarek, M., Pitt, B., Cannon, C. P., Leiter, L. A., McGuire, D. K., et al. Sotagliflozin in Patients with Diabetes and Chronic Kidney Disease. N Engl J Med. 2021; 384(2):129–39.
CrossRef - He, X., Gao, X., Xie, P., Liu, Y., Bai, W., Liu, Y., et al. Pharmacokinetics, Pharmacodynamics, Safety and Tolerability of Sotagliflozin After Multiple Ascending Doses in Chinese Healthy Subjects. Drug Des Devel Ther. 2022; 16:2967–80.
CrossRef - Lapuerta, P., Zambrowicz, B., Strumph, P., Sands, A. Development of Sotagliflozin, a Dual Sodium-Dependent Glucose Transporter 1/2 Inhibitor. Diab Vasc Dis Res. 2015; 12(2):101–10.
CrossRef - Sriram S, Amutha EA, Akila L. Cost analysis of SGLT2 inhibitors in patients with type 2 diabetes. Res J Pharm Technol. 2020; 13(12):5861–5.
CrossRef - International Conference on Harmonisation of Technical Requirements for Registration of Pharmaceuticals for Human Use. ICH Harmonised Tripartite Guideline Validation of Analytical Procedures: Text and Methodology Q2(R1).
- Buch, M., Vaghani, H. Stability Indicating RP-UPLC Method for Impurity Profiling of Darunavir and Ritonavir in Fixed Dose Drug Combination Product. Indian J Pharm Educ Res. 2024; 58(2): 558–65.
CrossRef - Padmaja, N., Veerabhadram, G. A Novel Stability Indicating RP-UPLC-DAD Method for Determination of Metformin and Empagliflozin in Bulk and Tablet Dosage Form. Orient J Chem. 2017; 33(4):1949–58.
CrossRef - Vankalapati, K. R., Alegete, P., Boodida, S. Stability-Indicating Ultra Performance Liquid Chromatography Method Development and Validation for Simultaneous Estimation of Metformin, Linagliptin, and Empagliflozin in Bulk and Pharmaceutical Dosage Form. Biomed Chromatogr. 2021; 35(4).
CrossRef - Biswal, S., Mondal, S., Mondal, P. A Novel Ultra Performance Liquid Chromatography-PDA Method Development and Validation for Darunavir in Bulk and Its Application to Marketed Dosage Form. J Pharm Bioallied Sci. 2021; 13(1):69–75.
CrossRef - Narikimalli, A., Galla, R. A Stability-Indicating UPLC Method Development and Validation for the Simultaneous Estimation of Nateglinide and Metformin Hydrochloride in Bulk and Tablet Dosage Form. Future J Pharm Sci. 2023; 9(1):1–12.
CrossRef - Urich, J. A. A., Marko, V., Boehm, K., García, R. A. L., Jeremic, D., Paudel, A. Development and Validation of a Stability-Indicating UPLC Method for the Determination of Hexoprenaline in Injectable Dosage Form Using AQbD Principles. 2021; 26(21):6597.
CrossRef - Medabalimi, M., Saravanakumar, K., Satyanarayana, S. V. Development and Validation of Stability Indicating RP-UPLC Method for Quantitative Estimation of Safinamide Mesylate in Bulk and Its Tablet Dosage Form. Curr Trends Biotechnol Pharm. 2022; 16(3):50–9.
- Merugu, Manasa V. A. M. Stability Indicating RP-UPLC Method Development Validation and Dissolution Testing of Semaglutide. J Pharm Negat Results. 2022; 13(4):1459–64.
- Sha’at, M., Spac, A. F., Stoleriu, I., Bujor, A., Cretan, M. S., Hartan, M., et al. Implementation of QbD Approach to the Analytical Method Development and Validation for the Estimation of Metformin Hydrochloride in Tablet Dosage Forms by HPLC. 2022; 14(6):1187.
CrossRef - Buch, M., Vaghani, H. Stability Indicating RP-UPLC Method for Impurity Profiling of Darunavir and Ritonavir in Fixed Dose Drug Combination Product. Indian J Pharm Educ Res. 2024; 58(2):558–65.
CrossRef - Mondal S, Biswal S, Senapati P, Mondal P, Bhar K, Parveen N. Development and validation of ultra performance liquid chromatography method for the estimation of etodolac in bulk and its application to marketed dosage form. Int J Pharm Res. 2021; 13(3):375–82.
CrossRef
Accepted on: 20 Mar 2025
Second Review by: Dr. Majid Khan
Final Approval by: Dr. Ravindra M Kumbhare


![]()


