Adsorption of Methylene Blue Dye from Textile Industry Effluent using Activated Carbon Synthesized from Various Plant-Based Precursors

Department of Chemistry, School of Sciences and Humanities, Vel Tech Rangarajan Dr.Sagunthala R and D Institute of Science and Technology, Chennai, Tamil Nadu, India.
Corresponding Author E-mail:drakanniraj@veltech.edu.in
DOI : http://dx.doi.org/10.13005/ojc/410236
Download this article as:
![]()
Methylene blue dye is used in textile industry. Through effluent discharge, it enters water bodies and pollutes them. It can cause skin cancer and other health problems. Adsorption of methylene blue by activated carbon is analyzed in this article. Dye removal efficiency of activated carbon synthesized from Denolix Regia pods is 99.9%. The exact fitness of Freundlich’s model is proving that the adsorption process is multilayer adsorption at room temperature. Kinetics data fit well to pseudo second order model, and so the rate determining step is chemisorptions. As the fitness of intraparticle diffusion kinetic model is also good, rate determining step involves the transport of dye molecules within the pores of activated carbon. As ∆G < -20 KJ/mol, physisorption is operating mechanism. A list of adsorbent carbons synthesized from plant-based precursors is considered for textile effluent treatment purpose. These findings show that the adsorbent surface is heterogeneous and multi-layered, and the nature of the adsorption is physical. In general, this adsorbent material is promising to be scaled up at the industrial level.
KEYWORDS:Adsorption; Activated Carbon; Isotherm; Kinetics; Methylene Blue; Effluent
Introduction
Organic dyes such as methylene blue or torquoise blue are commonly used in the textile industry, resulting in dye effluent contamination in water bodies such as rivers, streams, ponds and lakes. Dyes are nothing but textile colouring organic compounds. More than 10,000 chemical compounds (mainly organic dyes and few inorganic pigments) are used for colouring clothing, plastics, foods, so on. Dyes annual usage in textile industry crossed 7,00,000 metric tonnes1-3. India’s dye production is currently at > 60,000 metric tonnes per year, that means it is 6.6% of world’s dye production. Unfortunately, these dyes such as methylene blue are non-biodegradable, and also are carcinogenic, posing environmental risks. This affects water quality, water aesthetic, and damages aqua quality totally. Most of the dyes create health problems to humans, such as skin cancer, cyanosis, nausal problems, lung’s disorder, convulsion, gastric troubles, and eye irritation1,2,4. So, researchers perform adsorption experiments with methylene blue and others dyes. Important other dyes include synthetic Indigo, Rhodamine B, Condo Red, Methyl Red, Methyl Orange, Phenol Red, Torquoise Blue and Toluidine Blue5-7. These dyes enter water bodies through the discharge of texile industrial waste water. The concentration of methylene blue alone is 10-200ppm in water bodies. Amount is varying depending on textile processes and treatment methods. Environmental protection agency of USA recommends a limit value of < 0.2ppm. So, researchers have explored various methods to remove this dye from effluent water, including coagulation, adsorption, precipitation, electrochemical techniques, and enzyme decolorization3,8,9. Among various dye removal methods, adsorption using activated carbon stands out due to its high efficiency, cost-effectiveness, and ease of application in large-scale wastewater treatment. Activated carbon is made from coal or from plant-based precurors. One promising approach involves using activated carbon developed from various plant parts, viz, cashew nut shell, date palm stone, khat stem, coconut shell or delonix regia pods. Plant precursor based activated carbon is useful in waste water purification through adsorption techniques, achieving a remarkable removal efficiency of 99.9% for methylene blue at specific conditions6,10,-16. This sustainable solution could significantly contribute to industrial waste water treatment containing dyes, COD, heavy metal ions and cations and anions17-20. Activated carbon, also called activated charcoal, is a form of carbon commonly used to filter contaminants from water and air, among many other uses10,21-24. It is processed (activated) to have small, low-volume pores that greatly increase the surface area available for adsorption or chemical reactions that can be thought of as a microscopic “sponge” structure. Activation is analogous to making popcorn from dried corn kernels: popcorn is light, fluffy, and its kernels have a high surface-area-to-volume ratio. Activated is sometimes replaced by active. Researchers have reported that its surface area is as high as 1000-3000m2/g and maximum adsorption for organic dyes is 100-1100mg/g. It finds many applications, from cosmetics to water treatment. In market, activated carbon is sold in various forms such as granules, flakes, powder, and sponge3,10,14,25,26. Despite numerous studies on methylene blue adsorption, comprehensive comparisons of adsorption isotherms, kinetic models, and thermodynamic principles are still limited. This review aims to bridge this gap by analyzing recent studies and evaluating the feasibility of plant-based activated carbon for large-scale applications. More than 30 research articles on adsorption of methylene blue on activated carbon are used to make the reaction more suitable for large scale application1,2,3,8,27,28. As environmental scientists suggest effluent treatment in source areas, this method may be very useful for industries wish to do. In this analysis, Freundlich, Langmuir, and Sips isotherms; Lagrergren psudo I order, Ho-McKay pseudo II order, and Weber-Morris intraparticle diffusion kinetics, and Vant Hoff’s thermodynamic equations are analysed to depth and others are discussed to some extent then and there whenever required29,30,31,32,33,34. Literature contains 30+ adsorption isotherm models, and many kinetic models (I order, II order and intraparticle diffusion). Similarly, this adsorption process has been simulated in Monte Carlo method, and Anova techniques18,29,30. Monte Carlo can be used to model adsorption of methylene blue onto activated carbon and proves that it is physisorption by Van der Waal’s forces29. As it is a review, comparison is given in detail and vague data presentation is omitted.
Materials and Methods
Chemicals and apparatus
Analar chemicals and chemistry laboratory grade apparatus are used. Reactants are organic dye (methylene blue), and activated carbon (from denolix regia pods). Chemical formula of methylene blue trihydrate is shown in Figures1. For the study of effect of pH on adsorption process, NaOH or other bases, HCl or other acids, are used. Apparatus used are spectrophotometer, electronic balance, timer, magnetic stirrer, shaker, centrifuge, standard measuring flasks, measuring jar, glass beakers, glass rod, muffle furnace, silica crucible, oven and desicattor. Dry fine powder made from delonix regia pods are carbonized in muffle furnace at 400°C for 1hour in nitrogen atmosphere. Adsorbent carbon is characterized to get its composition and other properties. IR spectroscopy is used to get the details about the presence of multifuctionalities in activated carbon.
 |
Figure 1: Chemical formula of methylene blue trihydrate40Click here to View Figure |
Adsorption process protocols
The design of adsorption is based on the six independent factors, such as, initial MB dye concentration, contact time, ambient temperature, pH of adsorption medium, volume of adsorbate dye solution, and adsorbent dosage. Duplicate or triplicate sample analyses are used and average value is used. The batch adsorption experiment is undertaken by agitating the adsorption solution at a fixed contact time. The concentration of MB was determined using a UV–Visible spectrophotometer at a wavelength of 668 nm. Finally, the removal efficiency of MB and the adsorption capacity of the adsorbent are analyzed by using common models of isotherms, kinetics and thermodynmics3,15,31,36,38-40.
A stock solution of MB dye of concentration 500ppm is prepared at the start of each set experiments, ie, fixing variables , isotherm study, kinetic study, and temperature effect. Solutions of different initial concentrations are made from stock solution by dilution. Batch adsorption experiments are carried out in 250mL conical flask. Volume of the adsorbate dye solution taken (v) is 50 mL. For 10-100ppm dye concentration, and solution volume of 50mL, the optimum fixed adsorbent dose (x) is 0.6g. It is decided based on experiments conducted with varying x amounts from 0.1g to 1.0g in steps of 0.1g. For 10-100ppm dye concentration, solution volume of 50mL, and for adsorbent dose of 0.6g, adsorption efficiency is optimum at pH value 7. It is also fixed by varying pH value from 1 to 14 in steps of 1. Concentrations of aliquots taken from various extent of adsorption are measured using spectrophotometer absorbance (A) measurement. The instrument is first used to draw two calibration charts. For v=50mL, x=0.6g and pH=7, first of all the initial concentrations (Co) varied from 1 to 10ppm in steps of 1ppm, to get C=A/0.191 for 1-10ppm concentrations. Similarly, the initial concentrations (Co) varied from 10 to 100ppm in steps of 10ppm, to get C=A/0.157 for 10-100ppm concentrations.
For constructing isotherm plots (of Freundlich Model, Langmuir Model or Sips model), v=50mL, x=0.6g and pH=7, the initial concentrations (Co’s) are varied from 10 to 100ppm in steps of 10ppm. For each concentration, the ingredients of 50mL dye solution, and 0.6g carbon are added to 250mL conical flask and shaked thrice by hand, an aliquot of 5mL is taken to get concentration at the start of experiment. The conical flask is shaked for 60min at 120rpm speed in a mechanical shaker. After 60 min, another aliquot is taken for concentration measurement. With the help of spectrophotometer, the concentration at the start of experiment and at the end are measured. Adsorption reaches a maximum of 99.9% within 60min shaking. Adsorption is not appreciable changing after 60min. So, to plot isotherms, adsorption solution mixture is shaked only for 60min. This experiment is done at room temperature (298K) and at a little higher temperature of 308K.
For analyzing the pseudo I and II order kinetics, and intraparticle diffustion kinetics, adsorption experiment system is v=50mL, x=0.6g, pH=7, Co=50ppm and T=298K. Aliquots of 1mL is taken at regular time intervals from 10min to 120min in steps of 10min. With the help of spectrophotometer, the concentration is measured for each aliquot. This experiment is repeated at little higher temperature of 308K. For plotting Vant Hoff isotherm (to study the effect of temperature), the adsorption isotherm experiment is repeated at another higher temperature of 318K. For evaluating thermochemical or thermodynamic properties, isotherm data for initial dye concentration (Co) of 50ppm is only considered.
Methods of data analysis
Table 1 elaborates the equations used in this simple research and comprehensive review project. It lists equations for calculating adsorption capacity, adsorbate uptake, dye removal efficiency, adsorption isotherms, adsorption kinetics and thermodynamic parameters15,31,36-40.
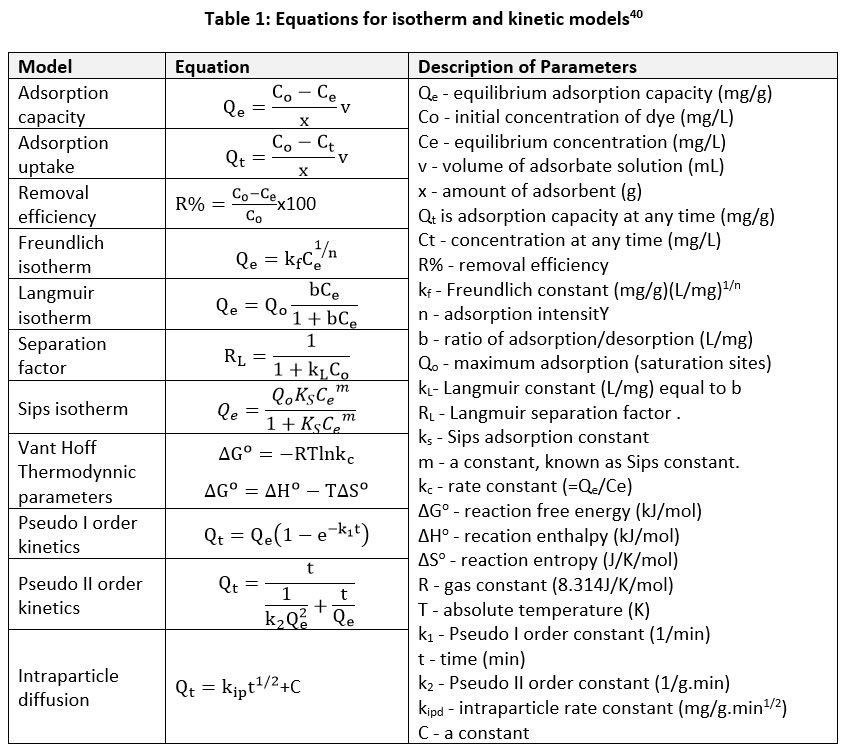 |
Table 1: Equations for isotherm and kinetic models40 |
Results and Discussion
Adsorbent Characteristics
A typical composition of adsorbent carbon is moisture 9.22%, ash 1.5%, volatile matter 7.358%, and fixed carbon 81.922%. Other properties of adsorbent carbon are particle size in 100-300μm range, pore sizes in 0.4-4nm range (ie, from microporous 0.4-0.8nm to mesoporous 2-4nm range), specific surface area in 300-2463m2/g, high density of 451 kg/m3, iodine number of 986mg/g, pH of 7, methylene blue number of 148mg/g, surface area of 965m2/g to list a few35,-40,46. Figure 2 is IR spectra of activated carbon41-46.
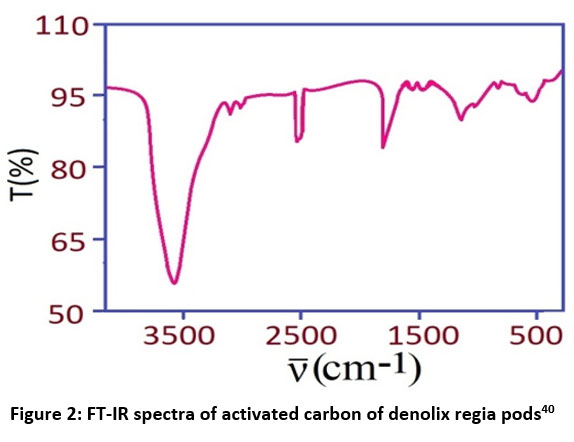 |
Figure 2: FT-IR spectra of activated carbon of denolix regia pods40 |
FT-IR spectrum shows peaks at approximately 2700cm-1 (crystalline graphite), 1600cm-1 (G band, sp2 bonded carbon atoms), and 1350cm-1 (D band, disordered graphite structure). Also, in the FT-IR spectra, it is noted that the adsorbent samples show many peaks showing the presence of multifunctionalities other than those of carbon and graphite. The peaks appear the origin of the starting material (precursor) used in the preparation processes from the same source. The appearance of very strong peaks around 3500cm-1 is attributed to the O–H stretch vibrations. The bands from 3000cm-1 show the presence of an aliphatic-CH stretching peak. The band at 1700cm-1 indicates the existence of the stretching vibrations peak of the C=O group. The peak noted in the range 1650cm-1 could be attributed to the presence of C=C aromatic skeletal stretching. The peak detected at 1570cm-1 could be attributed to the carboxylic, and carboxylate anion stretching mode. The peaks detected at 1450cm-1 are assigned to C-H asymmetric bending bands. The peaks detected at 1350 cm-1 are assigned to C-H asymmetric and symmetric bending bands. The peaks at 1200cm-1 were associated with -C-O stretching and -OH bending modes of alcoholic, phenolic, carboxylic, ester, or the P=O bond in phosphate esters in the case of activation with H3PO4 acid. These observations indicate that the carboxylic group had been successfully introduced on the surface of sorbents. The peak appeared at 600cm-1 for adsorbent prepared with iron chloride. Multifunctionalities aid in adsorption to rise manyfold41,43,40,46. Multifunctionalities vary with the variation of plant-based precursors. Adsorption capacity also depends on particle size and carbonization variables (temperature, time, inert atmosphere, and surfactant added).
Adsorption of activated carbon for organic compounds and metal ions makes the many commercial application, such as domestic water treatment, industrial effluent treatment, face wash creams, in many medical uses, and in chemical synthesis for colour removal (purification of organic compounds). From the literature review, production of the activated carbon from various sources are reported in Table 2. As states earlier, the adsorption capacity of carbon varies depending on biomass sources, carbonization conditions and carbon porosity and texture3,9,33. As seen in Table 2, activated carbon derived from Mongosteen shell exhibited the highest adsorption efficiency (1193 mg/g), likely due to its high porosity and surface functional groups. In contrast, neem leaf-derived carbon showed a much lower adsorption capacity (15 mg/g), suggesting poor pore development and surface area limitations. Also, as we know that adsorption capacity is proportional to surface area. Table 3 lists down surface area of activated carbon made from some selected plant-based precursors. To obtain surface area accurately, BET method is used. By better control of biomass powder making and carbonizing, it is possible to achieve high surface are in activated carbon9,10,14. As seen in Table 3, activated carbon derived from Denolix Regia or Flamboyant Tree Pods exhibited the highest surface area (2854m2/g), likely due to its small particle size. In contrast, cow dung-derived carbon showed a much lower surface area (75 m2/g), suggesting larger particle size.
Table 2: Removal efficiency (batch experimentation)40
| Carbon Source | Adsorption Efficiency (mg/g) |
| Mongosteen Shell | 1193 |
| Starbons | 891 |
| Buxus Wallichiana | 866 |
| Dates Palm Stones | 460 |
| Rumex Abyssinicus | 387 |
| Soybean Oil Cake | 278 |
| Banana Trunk | 227 |
| Saw Dust | 200 |
| Coconut Leaf | 147 |
| Moringa Leaf | 136 |
| Tea Waste | 86 |
| Musa Paradisiaca | 65 |
| Sugar Cane | 51 |
| Ficus Carcica Bast | 47 |
| Rice husk | 40 |
| Denolix regia pods | 34 |
| Neem leaf | 15 |
| Beech saw dust | 13 |
Table 3: Specific surface area (BET model based)40
| Carbon Source | Surface Area (m2/g) |
| Flamboyant Pods | 2854 |
| Buxus Wallichiana | 2236 |
| Dates Palm Stones | 1669 |
| Khat Stem Biomass | 1323 |
| Spathodea Campanulata | 1054 |
| Cashew Nut Shells | 635 |
| Cow Dung | 75 |
Adsorption Isotherms
These are plots of equilibrium adsorption capacity of adsorbent (activated carbon) against concentration of adsorbate (methylene blue dye solution). Figures 3-5 show typical isotherm plots of Freundlich, Langmuir and Sips isotherm equations. Form the slope and intercept of graph, maximum adsorption capacity (Qo), rate constant and other parameters are obtained. As far as adsorption of methylene blue on activated carbon is concerned, Langmuir isotherm (Ce/Qe versus Ce, where Ce is equilibrium dye concentration and Qe is equilibrium adsorption capacity) is the well suited at room temperature and is used to get maximum adsorption capacity (Qo) of adsorbent4,6,10,15,31. The wide range of adsorption capacities (10-1100 mg/g) indicates that precursor material and activation conditions significantly influence carbon performance. Higher adsorption capacities correlate with increased surface area and microporosity, as observed for materials such as Mongosteen shell (1193 mg/g) and Buxus Wallichiana (866 mg/g). Fitness of Freundlich model is very good compared to Langmuir model. Langmuir’s model fitness suggests monolayer sorbate coverage on adsorbent surfaces, whilst Freundlich model suggests multilayer sorbate coverage. The Sips isotherm is an extension of the Langmuir and Freundlich models, combining features of both. When m = 1, it reduces to Langmuir behavior, indicating monolayer adsorption. For 1/m < 1, the model aligns with Freundlich behavior, suggesting multilayer adsorption on heterogeneous surfaces. From Langmuir plot, calculated RL values of the Langmuir isotherms varied 0-1 representing favorable adsorption. Adsorption data were fitted to isotherm models using nonlinear regression. Freundlich model exhibited the best fit (R² = 0.99) at room temperature and at 308K, while Langmuir showed good fir at room temperature (R2=0.99) and moderate correlation at high temperature (R² = 0.85), indicating predominant monolayer adsorption behavior. Langmuir defined a parameter RL which gives the nature of adsorption. It has 3 cases (i) favourable, if 0<RL<1, (ii) unfavourable, if RL>1, (iii) linear, if RL=1, and (iv) irreversible, if RL=0. In our cases of adsorption system, case (i) is observed. Though not discussed explicitly, BET isotherm is useful to get surface area accurately of adsorbent carbon. BET method plots 1/[x(Co-Ct)-1] versus Ct/Co and calculates surface area (S) from slope and intercept (in this approach, x-adsorbent dose, Co-initial dye concentration, Ct-dye concentration and any time, and S=WA.NA.CSA/MV, WA-weight of dye adsorbed, NA-Avagadro number, CSA = cross-sectional area of dye molecule=130Å2 for MB dye, Mv=molar volume = 22414 mL). Adsorption efficiency (dye removal efficiency) is proportional to the surface area (eg. 1000-3000m2/g : it is surface area in square meter per gram of carbon adsorbent)14,15,25,32. From the Arrheius equation kc=Ae-Ea/RT, adsorption activation energy Ea is also calculated. It is assumed that kc=kL=b for calculation purpose. Calculated activation energy of adsorption is always <+5kJ/mol showing the process of adsorption is physisorption involving Van der Waal’s forces29.
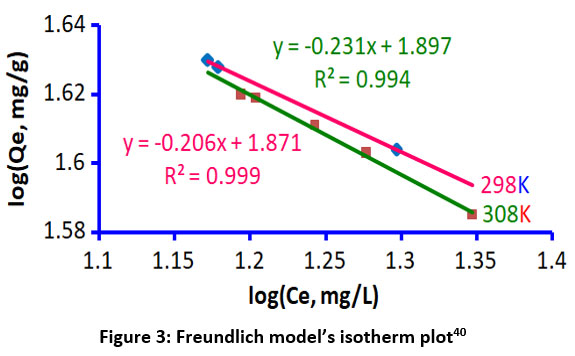 |
Figure 3: Freundlich model’s isotherm plot40 |
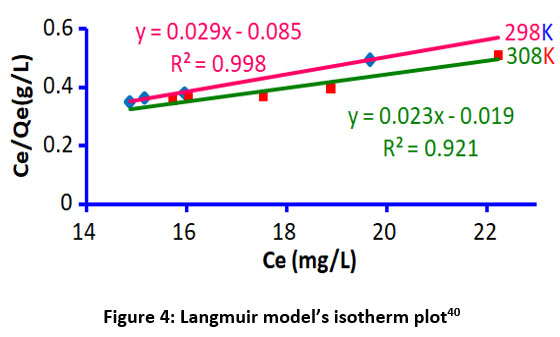 |
Figure 4: Langmuir model’s isotherm plot40 |
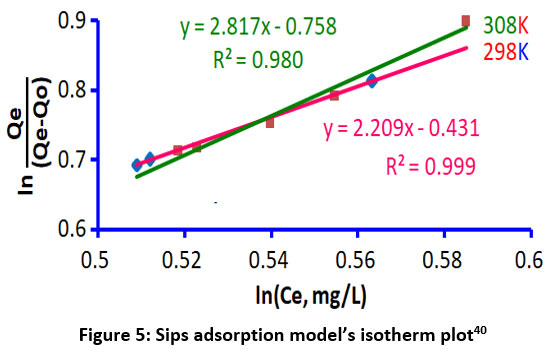 |
Figure 5: Sips adsorption model’s isotherm plot40 |
Adsorption Kinetics
Per cent dye removal or dye removal efficiency is followed by kinetics (it is nothing but the amount of dye removed against time). Figures 6-8 show three typical kinetics plots to manipulate the speed of adsorption. These are used to calculate rate constant, activation energy and adsorption mechanism, whether the adsorption process so adopted is I order or II order. Plots presented in this article show adsorption is showing best fit for pseudo II order rather than for pseudo I order. Intraparticle diffusion model also shows good correlation with experimental data. However, the adsorption process depends upon adsorbate (dye), adsorbent (carbon) and reaction conditions (surfactant, pH and temperature) vastly3,4,9. So, it has been proven that some adsorption reactions are I order and others are II order, some are unilayer and others are multilayer (proved in isotherm analysis)12,14,15. Adsorbent carbon is mixed with biomass or zeolite to rise its adsorption efficiency12,17,29. Meanwhile, adsorbate dye is present with other compounds and metal ions. In many cases, it has been proved that adsorption of dye is either drastically decreased or increased when other ions are present in the solution along with dyes. When ferrous ions are present in dye solution, methylene blue adsorption increases onto activated carbon. When cupric ions are present in the dye solution, methylene blue adsorption decreases over carbon surface and pores. Adsorbent interaction with metal ions are also important to deduce adsorption mechanism23,24,30. As seen in Figure 6, pseudo I order kinetics is not obayed (R2<0.7). For same adsorption system, Figure 7 shows pseudo II order is very well fit, and Figure 8 shows very good fit for intrapraticle diffusion also.
 |
Figure 6: Lagergren pseudo I order kinetics40 |
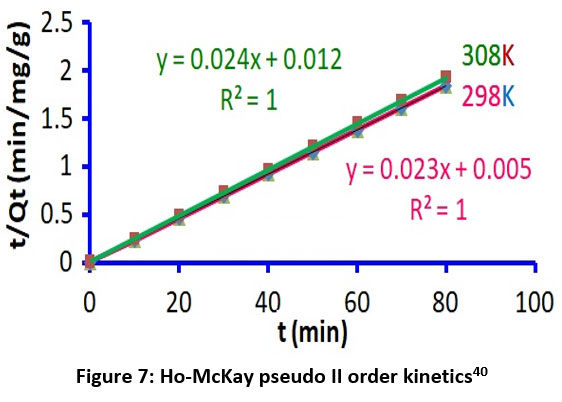 |
Figure 7: Ho-McKay pseudo II order kinetics40 |
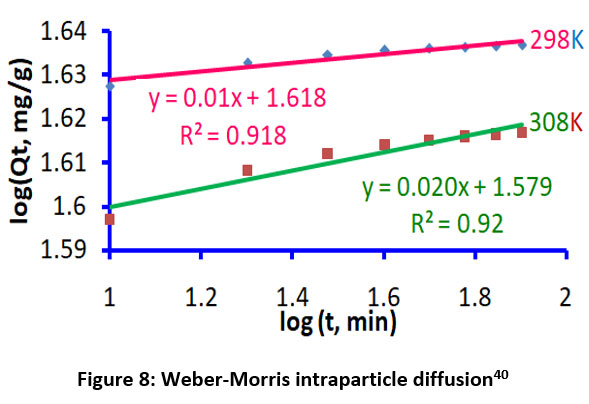 |
Figure 8: Weber-Morris intraparticle diffusion40 |
Thermodynamic Properties
Adsorption free energy, enthalpy of adsorption and disorderliness of the adsorption system are best described by Vant Hoff’s equations (ΔG=-RTlnKc and ΔG=ΔH-TΔS), in Figures 9 and 10. Ease of dye removal and disorder of the carbon-dye adsorption system is understood by this analysis. The spontaneity of adsorption is obtained using ΔG. For adsorption ΔG is negative, indicating its spontaneity. For adsorption ΔH is either negative or positive. It is mostly positive and so adsorption is endothermic. In some cases, adsorption is exothermic. In most cases of the adsorption experiments, ΔS is positive, showing disorderliness of the adsorption system1,13,16,33. The positive enthalpy change (ΔH > 0) suggests that adsorption is endothermic, meaning dye molecules gain energy to overcome activation barriers. Some cases, ΔH< 0 and exothermic nature of adsorption. The positive entropy change (ΔS > 0) indicates increased disorder at the solid-liquid interface, likely due to desolvation effects as dye molecules move from bulk solution to the carbon surface. When ΔS <0, it indicates the adsorption of molecules forming more ordered system.
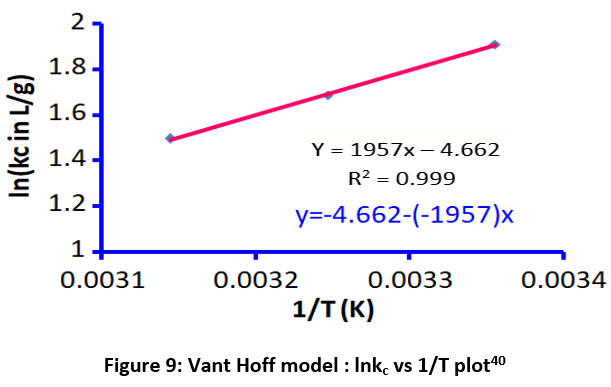 |
Figure 9: Vant Hoff model : lnkc vs 1/T plot40 |
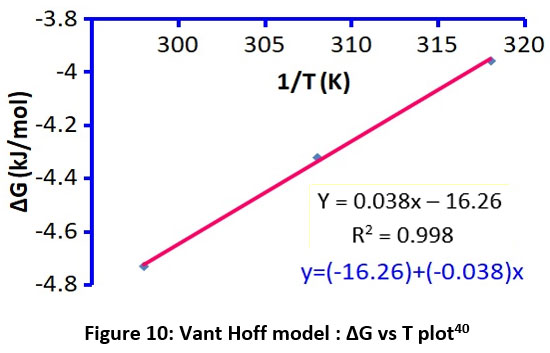 |
Figure 10: Vant Hoff model : ∆G vs T plot40 |
On Adsorption Variables
Adsorption of dye over carbon is chemically a simple reaction called reaction involving Van der Waal’s forces called physiosorption. Table 4 briefs the outcomes of adsorption experiments, clearly depicting adsorption of methylene blue over activated carbon made from denolix regia pods. To tell in short, carbon is a simple chemical, with large active surface area and highly porous structure. It adsorbs and removes dyes such as methylene blue very well (removal efficiency 99.9%). The process is influenced by many variables23,24,30. To brief, let us see activated carbon made from African tulip tree parts and the adsorbate is methylene blue dye solution. Equation 1 represents the removal efficiency of activated carbon.
%R=73.64+0.45A-8.26B+10.5C+4.85D–0.2988AB+0.985AC+0.655AD–1.88BC+0.8112BD–1.29CD …..(1)
Where A=pH (adjusted dye solution by adding NaOH or HCl), B=CMB (concentration of dye solution), C=x (amount of adsorbent carbon added), D=t (time variable during kinetics of adsorption). Simple regression software Origin (version 8) is used for forming this equation. From this, it is inferred that for C of 10-100ppm, pH=7, x=0.6g (600mg) and t is 60-120min to achieve equilibrium adsorption. Temperature shows drastic changes in adsorption pattern and amount. For example, Qo rise from 100 to 2000 by rising T by 100°C. It is very important for thermodynamics of adsorption, such as spontaneity, endothermic or exothermic and disorder of the system (Table 5)1,13,17,32,33.
Table 4: Experimental data for isotherm and kinetic models40
| Model | Parameter | T=398K | T=308K | T=318K |
| Freundlich AdsorptionIsotherm | 1/n | 0.21 | 0.23 | |
| kF (mg/g)/(mg/L)1/n | 75 | 79 | ||
| R2 | 0.99, Best Fit | 0.99, Best Fit | ||
| Langmuir AdsorptionIsotherm | Qo (mg/g) | 34 | 43 | |
| Qe (mg/g) | 40 | 39 | ||
| b or kL(L/mg) | 0.3 | 1.0 | ||
| RL | 0.03 | 0.01 | ||
| R2 | 0.99, Best Fit | 0.92, Good Fit | ||
| Sips isotherm | ks (L/mg)m | 0.38 | 0.19 | |
| m | 2.2 | 2.8 | ||
| R2 | 0.99, Best Fit | 0.98, Best Fit | ||
| Vant HoffThermodynamic Parameters | ∆Go (kJ/mol | -4.7 | -4.3 | -4.0 |
| ∆Ho (kJ/mol) | -16.3 | |||
| ∆So (J/K/mol) | -38.8 | |||
| R2 | 1.0, Exact Fit | |||
| LagergrenPseudoI Order
Kinetics |
Qe (mg/g) | 36 | 35 | |
| k1 (1/min) | 0.0009 | 0.0014 | ||
| R2 | 0.68, Poor Fit | 0.70, Poor Fit | ||
| Ho-McKay PseudoII OrderKinetics | Qe (mg/g) | 42.7 | 42.5 | |
| k2 (g/mg/min) | 0.094 | 0.043 | ||
| R2 | 1.0, Exact Fit | 1.0, Exact Fit | ||
| Weber-Morris Intraparticle DiffusionKinetics | Kip (mg/g.min1/2) | 41.5 | 37.9 | |
| Ce (mg/g) | 1.618 | 1.579 | ||
| R2 | 0.91, Low Fit | 0.92, Low Fit |
Table 5: Thermodynamic parameters40
| Carbon Sources /Chemical Treatment | ΔG(kJ/mol) | ΔH(kJ/mol) | ΔS(J/K/mol) |
| Fucus Carcica Bast / Acid | -1.55 | +21.5 | +76.2 |
| Coal-based Carbon / Alkali | -3.5 | +9.36 | +40.7 |
| Rafia Taedegera / Alkai | -4.7 | -15.6 | -36 |
| Denolix regia pods / Neutral | -4.7 | -16.3 | -38.8 |
Acid activation of carbon is done with phosphoric acid. It is endothermic process (ΔH is positive). Also it is a disorderliness increasing process (ΔS is positive). For alkali activation of cartbon, ΔH is slightly positive or strongly negative showing the shift to exothermic process of adsorption. Similarly, for alkali treated adsorption process, ΔS is positive or negative showing the possibility of both disordered or ordered adsorption system. Adsorption rate can be increased 20 times by rising temperature by 100°C. Adsorption energy is always around 1kJ/mol as reported in literature showing the process is physisorption by Van der Waal’s forces3,9,29. . These findings suggest that plant-derived activated carbons offer a low-cost, sustainable alternative for wastewater treatment3,35,40.
Conclusions
This study demonstrated the effectiveness of plant-derived activated carbon for removing methylene blue dye from wastewater, highlighting its potential for sustainable wastewater treatment. The adsorption capacity of 40-1100 mg/g and surface area of 1000-3000 m²/g indicate significant variability depending on precursor material and activation method. These values are comparable to commercial activated carbons, demonstrating the high efficiency of plant-based carbon adsorbents. Chemical activation using zinc chloride and phosphoric acid significantly enhanced the surface area and porosity of the carbon, leading to higher adsorption capacity. The addition of surfactants such as sodium lauryl sulfate further improved dye removal efficiency by modifying surface charge and increasing hydrophilicity. Adsorption equilibrium was reached within 60-120 minutes, suggesting a rapid uptake of methylene blue dye by activated carbon. The optimized dosage of 0.6 g per 100 mL solution at 298K for dye concentrations of 10-100 mg/L indicates efficient adsorption kinetics suitable for practical applications.”The adsorption followed the Langmuir model, confirming monolayer adsorption with RL values between 0 and 1, indicating a favorable adsorption process. The estimated b value (~2) and low activation energy (1 kJ/mol) confirmed physisorption via Van der Waals interactions, making the process highly reversible and suitable for regeneration of adsorbents. Thermodynamic analysis using Van’t Hoff’s method confirmed the spontaneous nature of adsorption (ΔG < 0), with positive enthalpy change (ΔH > 0) indicating an endothermic process. The positive entropy change (ΔS > 0) suggests increased disorder at the solid-liquid interface, likely due to desolvation of dye molecules and their random distribution on the carbon surface. Alkali-treated carbon exhibited a shift towards exothermic adsorption, indicating a stronger interaction between dye molecules and the adsorbent. Unlike acid-activated carbons, which favor endothermic adsorption, alkali-treated carbons demonstrated more ordered adsorption behavior due to enhanced surface charge and specific interactions with dye molecules. These findings suggest that plant-derived activated carbons offer a low-cost, sustainable alternative for wastewater treatment. Future research should focus on optimizing activation methods, exploring adsorption under real industrial conditions, and evaluating the reusability of spent adsorbents.
Acknowledgement
Author’s special thanks go to his wife and son for their continuous moral support.
Conflict of Interest
There is no conflict of interests in this work.
References
- Abegunde, S.M.; Idowu, K.S. Eur J Sci Technol. 2023, 3(3), 109-124.
- Khan, I.; Saeed, K.; Zekker, I.; Zhang, B.; Hendi, A.H.; Ahmad, A.; Ahmad, S.; Zada, N.; Ahmad, H.; Shah, L.A.; Shah, T.; Khan, I. Water, 2022, 14(2), 242.
CrossRef - Vijayakumar, V.; Shreedevi, S.; Ramesh, K. Orient. J. Chem. 2024, 4(4), 1145-1150.
CrossRef - Ramesh, K.; Rajappa, A.; Nandhakumar, V. Z. Phys. Chem., 2017, 231(5), 1057–1076.
CrossRef - Srinivasakannan, C.; Balasubramaniam, N. Part. Sci. Technol. 2007, 25, 535-548.
CrossRef - Li, H.; Budarin, V.L.; Clark, J.H. Michael North , M.; Wu, X. J. Hazard. Mater. 2022, 436, 29174.
CrossRef - Sridharan, G.; Sankar, A.A. J. OraL Maxillofac. Pathol. 2012, 16(2), 251-255.
CrossRef - Tay, T.; Erdem, M.; Ceylan, B.; Karagoz, S. BioRes. 2012, 7(3), 3175-3187.
CrossRef - Samal, D.B. BTech Dissertation. NIT Rourkela, 2014.
- Do, T.H.; Nguyen, V.T.; Dung, N.Q.; Chu, M.N.; Kiet, D.V.; Ngan, T.T.K.; Tan, L.V. Mater. Today Proc. 2021, 38, 3405-3413.
CrossRef - Kuang, Y.; Zhang, X.; Zhou, S. Water. 2020, 12, 587.
CrossRef - Kanawade, S.M.; Gaikwad, R.W. Int. J. Chem. Eng. Appl. 2011, 2(5), 317-319.
CrossRef - Adam, O.E.A.A. Amer. Chem. Sci. J. 2012, 16(1), 1-13.
- Alexandro, M.M.; Vargas, C.A.; Garcia, E.M.R.; Lenzi, E.; Costa, W.F.; Almeida, V.C. Chem. Eng. J. 2010, 162(1), 43-50.
CrossRef - Fito, J.; Abewaa, M.; Mengistu, A.; Angassa, K.; Ambaye, A.D.; Moyo, W.; Nkambule, T. Sci Reps. 2023, 13, 5427.
CrossRef - Pathania, D.; Sharma, S.; Singh, P. Arab. J. Chem. 2017, 10(s1), S1445-S1451.
CrossRef - Etemadinia, T.; Allahrasani, A.; Barikbin, B. Polym. Bull. 2019, 76, 6089–6109.
CrossRef - Daud, Z.; Ahmad, B.; Awang, H.; Abubakar, M.H.; Ridzuan, M.B.; Tajarudin, H.A. Int. J. Integr. Eng. 2018, 10(9), 177-183.
- Daud, Z.; Ahmad, B.; Awang, H.; Abubakar, M.H.; Nasir, N.; Tajarudin, H.A. Int. J. Integr. Eng. 2018, 10(9), 184-189.
- Arivoli, S.; Nandhakumar, V.; Saravanan, S.; Sulochana, N. Arab. J. Sci. Eng. 2008, 34(1A), 1-12.
- Bakara, U.; Nurhafizah, M.D.; Abdullah, N.; Akinnawo, O.O.; Ul-Hamid, A. Inorg. Chem. Commun. 2024, 166, 112609.
CrossRef - Verma, C.; Quraishi, M.A. Activated Carbon: Progress and Applications. RSC (London, UK), 2023.
CrossRef - Belhachemi,M.; Addoun, F. Appl. Water Sci. 2011, 1, 111-117.
CrossRef - Bouchelta, C.; Medjram, M.S.; Bertrand, O.; Bellat, J.P. J. Anal. Appl. Pyrolysis. 2008, 82(1), 70-77. doi:10.1016/j.jaap.2007.12.009
CrossRef - Takele, T.; Angassa, K.; Abewaa, M.; Kebede, A.M.; Tessema, I. Biomass Conv. Bioref. 2025, 15, 4085-4108
CrossRef - Kandasamy, S.; Neeraja, M.; Senthilkumar, P.; Muneeswaran, V.; Manickam, N.; Myneni, V.R. Biomass Conv. Bioref. 2023, 13, 260907780
- Abin-Bazaine, A.; Trujillo, A.C.; Olmos-Marquez, M. in Wastewater Treatment (Intech Open, London, UK), 2022, 1-15. 104260
- Ayawei, N.; Ebelegi, A.N.; Wankasi, D. J. Chem, 2017, 2017, 3039817.
CrossRef - Mohamed, F.; Shaban, M.; Zaki, S.K.; Abd-Elsamie, M.S.; Sayed, R.; Zayed, M.; Khalid, N.; Saad, S.; Omar, S.; Ahmed, A.M.; Abanoub Gerges, A.; H. R. Abd El-Mageed, H.R.A; Soliman, N.K. Sci Reps, 2022, 12, 18031.
CrossRef - Dimbo, D.; Abewa, M.; Adino, E.; Mengistu, A.; Takale, T.; Oro, A.; Rangaraju, M. Sci Reps. 2024, 21, 101910.
CrossRef - Olasehinde, E.F.; Abegunde, S.M.; Adebayo, M.A. Casp. J. Env. Sci. 2020, 18(4), 329-344.
- Thang, N.H.; Khang, D.S.; Hai, T.D.; Nga, D.T.; Tuan, P.D. RSC Adv. 2021, 11, 26563.
CrossRef - Rashid, R.A.; Jawad, A.H.; Ishak, M.A.M.; Kasim, N.N. Desalination Water Treat. 2016, 57, 27226–27236.
CrossRef - Villabona-Ortiz, A.; Gonzalez-Delgado, A.D.; Tejada-Tovar, C. Water, 2022, 14, 1383.
CrossRef - Quintero-Castaneda, C.Y.; Acevedo, P.A.; Hernandez-Angulo, L.R.; Tobon-Velez, ; Franco-Leyva, A.; Sierra-Carrillo, M.M. Eng, 2024, 5(4), 2441-2461.
CrossRef - Sari, A.; Tuzen, M.; Citak, D.; Soylak, M. Hazard. Mater., 2007, 149, 283–91.
CrossRef - Wang, D.; Shan, H.; Sun, X.; Zhang, H.; Wu, Y. Sci. Technol., 2018, 36, 1366 – 1385.
CrossRef - Chiou, M.S.; Ho, P.Y.; Li, H.Y. Dyes Pigm., 2004, 60, 69-84.
CrossRef - Ho, Y.S.; Ofomaja, A.E. Hazard. Mater., 2006, 129(1-3), 137-142.
CrossRef - Evangaline, S.; Kanniraj, A. Int. Conf. Integrat. Basic Sci. Humanit. 2025
- Benhachem, F.Z.; Attar, T.; Bouabdallah, F. Rev. Lett. 2019, 2, 33-39
- EIgazzar, A.H.; Ali, M.M.S.: EI-Sayed, A.E.; Saad, E.A. Radioanal. Nuc. Chem., 2020, 326, 1733-1748
CrossRef - Bhatta, L.K.G.; Venkatesh, K.; Kiran, N.; Gundanna, S.K.; Bhatta, U.M. Energy Clim. Change, 2021, 2, 100064
CrossRef - Hussain, O.A.; Hathout, A.S.; Abdel-Mobdy, Y.E.; Rashed, M.M.; Abdul Rahim, E.A.; Fouzy, A.S.M. Rep. 2023, 10, 146-154
CrossRef - Zbair, M.; Ainassaari, K.; Drif, A.; Ojala, S.; Bottlinger, M.; Pirila, Keiski, R.L.; Bensitel, M., M.; Brahmi, R. Sci. Pollut. Res. Int., 2018, 25, 1869-1882
CrossRef - Latinwo, G.K.; Alade, A.O.; Agarry, S.E.; Dada, E.O. J. Envir. Sci. 2019, 5(1), 75-78
Accepted on: 15 Apr 2025
Second Review by: Dr. Manisha Rathore
Final Approval by: Dr. Tanay Pramanik


![]()


