Validation and Development of a Method for Identification and Stability Analysis of Delafloxacin Separation Using LC-MS/MS
M. Sarbudeen1, V D N Kumar Abbaraju2 , K. Padmalatha3, Unati Sai Kodali4, Satya Vani Chinnamaneni5, BhuvanTej Mandava6, Mandava Venkata Basaveswara Rao1*
1Department of Chemistry, Krishna University, Machilipatnam,Andhra Pradesh, India.
2Department of Environmental Sciences, GITAM University, Visakhapatnam, Andhra Pradesh, India.
3Vijaya institute of pharmaceutical sciences for women, Vijayawada - 521108, India.
4Medical House Surgeon, Dr Pinnamaneni Siddhartha Institute of Medical sciences and Research Foundation, Dr NTR university of Health sciences, Vijayawada, A.P. India.
5Principal QC Lab Tech, Waters Corporation, Massachusetts, USA.
6Department of Healthcare informatics, Sacred Heart University, 5151 Park Avenue, Fair Fields, CT06825, Connecticut, USA.
Corresponding Author E-mail: vbrmandava@yahoo.com
DOI : http://dx.doi.org/10.13005/ojc/400112
Download this article as:
![]()
In order todevelop and validate the technique for delafloxacin authors are used the peak intense which is furthermore improved to this present investigation employing a variety of parameters, which includes column, alteration of eluent ratio, and rate of flow.For this development authors are usedWaters column with 2.1 mm x 100 mm, 5µm, C18. Mobile phase as 0.2% formic acid with pH of 2.6 and acetonitrile in the proportion of 30v/v:70v/v. The retention was 1.2 minutes and the rate of flow is identified as 0.12 µL/min. Forced degradation studies reveals that the peaksobtained are homogeneousand there are noco-elutingpeaks. The % RSD was found to be 3.5. Six LLOQ concentrations (10 ng/ml-1)of delafloxacin were evaluated in order to carry out the precision study.The results of calibration curve were 232.8, 0.9968, and 1273, respectivelyfor slope, coefficient of correlation (r2), and intercept.Mass spectrum development is done by the utilization of MRM ion mode (ES+) with mass transitions of m/z 441.10 > 379.10 (amu). On ionization,both parent and daughter ions were identified. 10–150 ng/mL is the calibration curve which reveals that linear by lower quantification limit of 10.00ng/ml. LOQ- 50.00ng/ml, MOQ-100.00ng/ml, HOQ -150.00ng/ml set to accuracy studies.In this present study, the research could be very helpful inlocating other potential DPs and process-related impurities that might be present indelafloxacin in very small amounts.
KEYWORDS:LC-MS/MS; MRM ion modeDelafloxacin; Nano gram; Validation, Linearity
Introduction
Delafloxacin(DFA) is used for treating adults those who are facing the problem with ABSSSI.1 This drug is well admitted as ABT-492, RX-3341, and WQ-3034 at the same time it is concealed by the development.2 One of the famous pharmaceuticals named as Rib-X seized this drug.3 Rib-X is renamed as Melinta Therapeutics in the year 2013.4 This is later associated by Cempra.5 Veronica Hernandis et.al.,6measured plasma delafloxacin strengths by RP chromatography. Wavelength is 405m and 450 nm. Column as Kromasil C18 column 250 × 4.6 mm id, 5 µm. Mobile phase is 0.05% trifluoroacetic acid/acetonitrile as 52/48. Rt values are 5.4 and 11.6min. Calibration curves are 0.1 µg/mL to 2.5 µg/mL. LOD and LOQ are 0.05 µg/mL, 0.1 µg/mL. Accuracy and precision values are less to than to 11%> LOQ is 16%. Recovery is 98.3%. Iqbal, M et.al.,7used UPLC BEH C18 column (50 × 2.1 mm; 1.7μm. Mobile phase is 0.1% formic acid in both acetonitrile and in water. Iqbal, M et.al.,8 information the MRM transitions are arranged as 441.14 > 379.09 as well as 436.89 > 144.87 for internal standard. Alam P et.al.,9usedRP-18 silica gel 60 F254S HPTLC plates. Ethanol 5v/v, water 4v/v and ammonia 2v/v used as mobile phase. Wavelength is 295 nm. % assay is 98.2 and 101.0% and SLNs are 94.4 and 95.0%. Jorgensen SCJ et.al.,10 reveals that maximized penetration of intracellular, enhanced bactericidal exercise beneath to acidic circumstances. D. Chandrapal Reddy et.al.,11 used X-terra RP8 (50 mmx4.6 mm, 5 μm particle size) column. 30 mM ammonium formate (pH-5.0±0.05) and acetonitrile are used as mobile phase. Rate of flow is 0.40mL/min. The linearity is 0.100 ng/mL – 100.017 ng/mL. LOD is 0.04 ng/mL and LOQ is 0.100 ng/mL. Intra and Inter precisions are 5.21 to 7.02. Accuracy is 97.14 to 103.50. Recovery is 80.31% and ISTD recovery is 81.09%. Lou Y et.al., 12 used Waters X Bridge C18 (2.1 mm × 100 mm, 3.5 µm). buffer as 0.2 % formic acid in water and acetonitrile. Run time is 4.0 min. Volume injected is 5μL. Linearity is 2 ng/mL to 500 ng/ml. By using this literature review authors are performed this validation and observed that the values obtained in this work are more accurate when compared with other values.
Experimental
Pure delafloxacin contain 99.9% purity of drug was procured from sigma Aldrich. 70%Acetonitrile, NaOH, 0.2% Formic acid as 30%, and HCl were obtained from Merck life sciences, and di-methyl sulphoxide procured from loba company pvt. Ltd., Mumbai. All the solutions are subjected to filtration via Millipore 0.22µm filter paper (India). Merck millipore provided Milli-Q-Water. The LC-MS/MS experiments are performed using a Waters micro mass Quattro Premier XEseriesliquidchromatography system all weighing processes were settled using an analyticalbalance. At all weighing events, a (Mettler Toledo) scale was used. Photo stability chamber, sonicator and hot air oven were used as well. The software used for monitoring and integration of chromatographic and spectrumpeakswas executedwithMass Lynxsoftware.
Detection Method
For optimal results, use a Waters column measuring 2.1 mm x 100 mm, 5 m, C18, with a precise mobile phase ratio as 30:70 for acetonitrile and 0.2% formic acid (pH 2.6). The flow rate of 0.12 µL/min produced the best retention of delafloxacin.
Mass parameter
Optimized for this approach is positive ionization mode (ES+) and triple TOF mass spectrometer from the 4600 series with an ESI source. The capillary voltage was kept at 2.94 KV and pure nitrogen gas was employed as the nebulizer. The source temperature is appropriate at 119 °C, and the mass spectrum collision energy is fixed at 32 eV.The sample of delafloxacin for the injection into mass spectrometry was modify to 10 µL for better ionization of given sample and both parent daughter ion identified. The desolvation gas flow (L/Hr) 850 and desolvation Temperature (°C) 400. The Cone Gas Flow (L/Hr) 102 was fixed. Cone voltage and Extractor voltage were set to 33 V, 3V respectively. Mass spectrum development was performed using MRM ion mode (ES+) with mass transitions of m/z 441.10 > 379.10 (amu) at retention time of 1.2 minutes for DLF and data acquired with Software Version: 1.40.1248 (MassLynx 4.1 SCN805). The related information is shown in the figure 1 to 3.
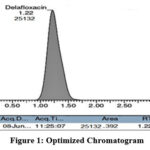 |
Figure 1: Optimized Chromatogram |
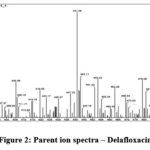 |
Figure 2: Parent ion spectra – Delafloxacin. |
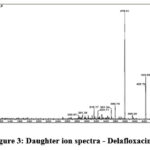 |
Figure 3: Daughter ion spectra – Delafloxacin |
Results And Discussion
StressDecompositionBehaviourofDelafloxacin
To start with, a working standard of delafloxacin containing 100 ng/ml (ppb) was established. This working standard is recycled to establish the purity peak for delafloxacin during the stress inquiry and to determine the synthesis of its DPs using the photo diode array (PDA) detector. The outcome of delafloxacin is shown in the table.1.
Degradation in acidic condition
Degradation was carried out on a wide variety of acidic pH values. 30 mins of individual exposure to 2 ml of 1% Hcl were given to each sample. It was cooled to room temperature after 30 mints. The aforesaid sample was then diluted to a final concentration of 100ngmL-1 (ppb) using diluents. Stressed samples were strained through a 0.22 m filter. With RT: 1.25 minutes, 11.1% degradation was attained, although 88.9% of the purity was retained.
Degradation in alkaline condition
Alkaline degradation was carried out over a wide range of basic pH values. Each sample was separately exposed for 30 minutes with 2 millilitres of 1M NaOH. A basic condition was used for the alkaline degradation investigation. 98% of the delafloxacin was still present with an Rt of 1.26 mints during the analysis of the DLF, which revealed 2% degradation.
Oxidative degradation
Degradation studies are carried out using a variety of oxidizing agents, including metal ions and radical initiators, however hydrogen peroxide is among the most common oxidizing agent (for oxidative degradation). Oxidative drug degradation for the product of reactive anions and cations served as a representation of the electron transfer mechanism. For 30 minutes, 3% H2O2 was treated with delafloxacin and kept at room temperature (28°C). 7.2% degradation was recorded during oxidative stressed degradation. The stressed sample wasdiluted to achieve a final concentration of 100ngmL1 (ppb). During oxidation, DLF degradation (Rt 1.24 min) was discovered.
Thermal conditions
To determine how temperature affects a substance’s capacity to withstand heat. The drug component is placed in a Petri dish and is done in a dry oven to 105°C for six hours. Once the required period of time passed, the sample was removed from the dry oven, and the final concentration was adjusted to 100 ng mL-1 using diluents. 85% of the drug was recognized by thermal analysis (RT: 1.02 mints).
Table 1: Degradation Analysis Report for Delafloxacin
|
Categoryof Stress |
PeakArea response |
Assay Value |
%DegradationofDLF |
Interference |
|
Undegraded |
26398 |
100 |
0 |
Peak is homogeneous and there is no co-eluting peaks |
|
Acid |
23474 |
88.9 |
11.1 |
|
|
Base |
25873 |
98 |
2 |
|
|
Peroxide (oxidation) |
24518 |
92.8 |
7.2 |
|
|
Thermal |
22538 |
85 |
15 |
Analytical Method Validation of delafloxacin
System Suitability
System suitability assessment is important in analytical procedures. At an LLOQ concentration of 100 ng mL-1, standard solution is passed. Both the system’s features as well as % RSD are established in order to evaluate its suitability. A total of six cloned injections were utilized to calculate the area responses’ percent RSD. Predefined requirements were followed for parameters including resolution, tailing factor, and retention time spent. The system was suitable to undertake other validation parameters since the acquired% RSD of area responses for delafloxacin was 3.5%, which agreed with the maximum limit of not more than 5%. The result of the use of delafloxacin is shown in the table.2.
Table 2: System Suitability Evaluation
|
Sr.No |
Area |
Retention timein min. |
|
1 |
22071 |
1.24 |
|
2 |
21948 |
1.23 |
|
3 |
22624 |
1.24 |
|
4 |
23151 |
1.23 |
|
5 |
23343 |
1.23 |
|
6 |
24039 |
1.23 |
|
Mean |
22862.67 |
|
|
Std.Deviation |
802.238 |
|
|
%RSD |
3.5 |
|
Specificity
With a maximum concentration of 150 ng/ml over six repetitions, selectivity ensures that the procedure reliably measures the target analyte without interference from other substances. There was no interference at the analyte’s retention period, and the analyte’s identity was verified by distinctive MS/MS transitions.The selectivity of the suggested methods report was demonstrated below by contrasting the chromatogram of the working standard solution, blank. Six successive concentrations that do not showed any additional peaks proved that the method being used is adequately appropriate for the task at concern.
Accuracy and Precision of delafloxacin
For the purpose of an accuracy, a known concentration of the delafloxacin (100 ngml-1) was divided into three concentration levels were low, medium and high (LOQ-50%, MOQ-100, and HOQ-150%). For LOQ, MOQ, and HOQ, respectively, the average recovery was determined to be 99.3%, and the percentage RSD was computed as 4.5, 7.8, and 2.7 (mean of three replicates). The chromatogram’s result is shown in Figure 4. The accuracy has to range from 85 to 115% of the nominal values, and % RSD should be within ±15%. Six LLOQ concentrations (10 ngml-1) of delafloxacin were evaluated in order to carry out the precision study. The determined percent RSD was 0.71%, which yielded results that were within tolerances. The acceptable threshold for precision is 15% or less %RSD. The table (3, 4) below contains the delafloxacin outcome. And the related chromatograms are represented in the figure 4.
Table 3: Accuracy data of Delafloxacin(n=3).
|
Spiked conce. as ngml-1 |
Conce. found as ngml-1 |
Area |
RSD as % |
%Recovery |
|
LOQ-50 |
49.81 |
n=3=13012 |
4.5 |
113.83 |
|
MOQ- 100 |
91.12 |
n=3=20831 |
7.8 |
91.12 |
|
HOQ- 150 |
139.3 |
n=3=31863 |
2.7 |
92.91 |
Table 4: Precision method of Delafloxacin.
|
SampleNo |
LLOQ conce. |
Precision of DLF |
|
|
Area |
RSD as % |
||
|
1 |
10 |
3306 |
0.71 |
|
2 |
10 |
3317 |
|
|
3 |
10 |
3369 |
|
|
4 |
10 |
3347 |
|
|
5 |
10 |
3316 |
|
|
6 |
10 |
3339 |
|
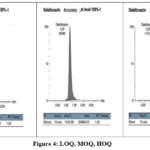 |
Figure 4: LOQ, MOQ, HOQ. |
Linearity
Seven distinct concentrations (7-point) of the standard solution of delafloxacin, ranging from 10 to 150 ng/ml, were used to analyze the method’s linearity. Calculate the slope, correlation coefficient, and intercept for concentration versus response of area plot.The results of calibration curve were 232.8, 0.9968, and 1273, respectively, for slope, coefficient of correlation (r2), and intercept. The linearity curve and results are represented in the table 5 and figure 5.
Table 5: Linearity of delafloxacin.
|
Conce. In ng/ ml |
PeakArea |
Slopeas m |
Intercept Value asb |
Correlation Co-efficient asr2 |
|
10 |
3368 |
232.8 |
1273 |
0.9968 |
|
25 |
7870 |
|||
|
50 |
12305 |
|||
|
75 |
19243 |
|||
|
100 |
25142 |
|||
|
125 |
29653 |
|||
|
150 |
35931 |
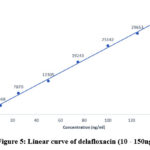 |
Figure 5: Linear curve of delafloxacin (10 – 150ng/ml). |
Sensitivity of delafloxacin
By using LOD and LOQ, the approach’s sensitivity has been rendered clear. Select a diluted solution (lowest possible known concentration) from the linearity curve to display the LOD and LOQ values. For LLOD (detection limit) and LLOQ (quantitation limit), the S/N ratio was calculated.The LOQ’s %RSD was calculated as 1.6, and the LOD’s %RSD was 2.0. These estimated values were within acceptable.On measuring the concentration (LLOQ-10 ng/ ml, LLOD-3 ng/ ml) of the technique having signal-to-noise ratio LOD should be three times to noise level, also LOQ should be ten times tolevel of noise. [18-19]Results showed in table.6.
Table 6: LOD and LOQ- Sensitivity of delafloxacin.
|
Conce. In ppb |
Retentiontime in min. |
Area |
S/N |
Conce. In ppb |
Retention |
Area |
S/N |
|
10 |
1.23 |
3396 |
447 |
3 |
1.24 |
1134 |
249 |
|
10 |
1.23 |
2791 |
443 |
3 |
1.24 |
1198 |
248 |
|
10 |
1.23 |
3305 |
451 |
3 |
1.24 |
1193 |
247 |
|
10 |
1.23 |
3368 |
458 |
3 |
1.24 |
1108 |
245 |
|
10 |
1.23 |
3346 |
439 |
3 |
1.24 |
1263 |
259 |
|
10 |
1.23 |
3316 |
441 |
3 |
1.24 |
1207 |
257 |
|
Mean |
447 |
251 |
|||||
|
%RSD |
1.6 |
2.08 |
|||||
Conclusion
A linear, accurate, and specific stability indicating LC-MS/MS technique is established also completely validated in consonence with FDA criteria to determine the stability of delafloxacin in the form of its degradation products. It was described as a particularly sensitive UPLC-MS/MS method that could identifyits degradation to the nanogram level. Delafloxacin investigation was found to be less susceptible to circumstances that cause acidic, alkaline, oxidative, basic, and thermal degradation. Delafloxacin and its DP were identified and characterized using the MS/MS technique in ESI mode of positive. In current study, the research could be very helpful in locating other potential DPs and process-related impurities that might be present in delafloxacin in very small amounts. With the effective identification and characterization of delafloxacin’s degradation during stress testing.
Acknowledgements
The authors are thankful for management of Krishna University for conditional necessary facilities to accomplish this research work.
Conflicts of Interest
There are no conflicts of interest among the authors to perform this work.
References
- Baxdela- delafloxacin meglumine tablet Baxdela- delafloxacin meglumine injection, powder, lyophilized, for solution”. DailyMed. 12 February 2020. Retrieved 12 May 2020.
- “Delafloxacin”. AdisInsight. Retrieved 10 July 2017.
- Cartwright H. “Rib-X Pharmaceuticals Signs Global Antibiotic Research Collaboration with Sanofi”. PharmaDeals Review. 2011No. 7. doi:10.3833/pdr.v2011i7.1494 .
- Stearns J (August 1, 2016). “Melinta Therapeutics takes aim at deadly drug-resistant bacteria”. Hartford Business Journal.
- “Cempra and Melinta Announce Merger to Form Leading, Vertically Integrated Commercial-Stage Anti-Infectives Company”. Melinta Therapeutics. 9 August 2017. Retrieved 24 November 2022.
- Veronica Hernandis, Elisa escudero, Pedro Marin; “A novel liquid chromatography-fluorescence method for the determination of delafloxacin in human plasma; Journal of separation science; 2021; 45(6): 706-716: https://doi.org/10.1002/jssc.202100768.
CrossRef - Iqbal, M.; Ezzeldin, E.; Anwer, M.K.; Imam, F. Eco-Friendly UPLC-MS/MS Quantitation of Delafloxacin in Plasma and Its Application in a Pharmacokinetic Study in Rats. Separations 2021, 8, 146. https://doi.org/10.3390/separations8090146.
CrossRef - Iqbal M, Ezzeldin E, Herqash RN, Anwer MK, Azam F. Development and validation of a novel UPLC-MS/MS method for quantification of delafloxacin in plasma and aqueous humour for pharmacokinetic analyses. J Chromatogr. B Analyt. Technol. Biomed Life Sci. 2020; 1138:121961. doi: 10.1016/j.jchromb.2019.121961.
CrossRef - Alam P, Ezzeldin E, Iqbal M, Mostafa GAE, Anwer MK, Alqarni MH, Foudah AI, Shakeel F. Determination of Delafloxacin in Pharmaceutical Formulations Using a Green RP-HPTLC and NP-HPTLC Methods: A Comparative Study. Antibiotics (Basel). 2020; 9(6):359. doi: 10.3390/antibiotics9060359.
CrossRef - Jorgensen SCJ, Mercuro NJ, Davis SL, Rybak MJ. Delafloxacin: Place in Therapy and Review of Microbiologic, Clinical and Pharmacologic Properties. Infect Dis Ther. 2018;7(2):197-217. doi: 10.1007/s40121-018-0198-x.
CrossRef - D. Chandrapal Reddy, A. T. Bapuji, V. Surayanarayana Rao, V. Himabindu, D. Rama Raju, Syed Syedba, H. L. V. Ravikiran, “Development and Validation of a LC/MS/MS Method for the Determination of Duloxetine in Human Plasma and Its Application to Pharmacokinetic Study”, Journal of Chemistry, 2012; vol. 9, Article ID 912568, 13 pages. https://doi.org/10.1155/2012/912568.
CrossRef - Lou Y, Qin H, Hu Q, Chai Y, Zhou H, Chen M, Wang Q, Huang P, Gu J, Zhang Y. Development and validation of a novel LC-MS/MS method for simultaneous quantitative determination of tyrosine kinase inhibitors in human plasma. J Chromatogr B AnalytTechnol Biomed Life Sci. 2022; 1208:123394. doi: 10.1016/j.jchromb.2022.123394.
CrossRef
Second Review by: Dr. Smita Pawar
Final Approval by: Dr. Dinesh Chand Sharma


![]()


