UHPLC Specific Method for Simultaneous Determination of Probable Impurities of Ezetimibeand Simvastatin in Combined Dosage Form
Anantha Lakshmi Vadivelu2, Sathapathy Panduranga Vittal1 and Duvvuri Suryakala2*
1APL Research centre (A division of Aurobindo Pharma Limited), Hyderabad, Telangana, India.
2Department of Chemistry, Institute of Science, GITAM University, Visakhapatnam. Andhra Pradesh, India.
Corresponding Author E-mail: duvvurisuryakala@gmail.com
DOI : http://dx.doi.org/10.13005/ojc/400128
Download this article as:
![]()
Method development, degradation impurities that may appear in Ezetimibe, Simvastatin tablets with Ultra High Performance Liquid Chromatography (UHPLC or UPLC) technique. Water’s Acquity High strength (HSS) T31.8µ, 100x 2.1mm column is used for critical separation between closely eluting impurities originating from the combined dosage form. Perchloric acid buffer (1.0 mL/L)and acetonitrile are selected as Elution phase A, B. The resolution between polar, mid polar and highly polar impurities is achieved with flow of 0.5 mL per minute in step gradient mode with short run time. Detection was done at 238nm for quantification of both Ezetimibe and Simvastatin impurities. Method validation is performed as per compound requirement. The validated UHPLC method is specific and stability demonstrating for process or degradation impurities that may originate from drug product or peaks appears during stress degradation in Ezetimibe and Simvastatin tablets . The method was accurate, robust and validation is as per ICH guide lines. The results are more reliable, precise and reproducible.
KEYWORDS:Combined dose form; Ezetimibe; probable impurities; Simvastatin; Stability demonstrating; Validation
Introduction
Ezetimibe (EZE) (Figure 1), is known to selectively inhibit the intestinal cholesterol and its related phytosterol absorption, EZE is crystalline in nature and practically do not dissolve in water, but in methanol, acetone and ethanol. It is white in color. It chemically entitled as “(3R, 4S)-1-(p-Fluorophenyl)-3-[(3S)-3-(p-fluorophenyl)-3-hydroxypropyl]-4-(p-hydroxyphenyl)-2-azetidinone” C24H21F2NO3 and molar mass 409.43 g.mol-1. EZE reduces cholesterol in plasma [1]. The therapeutic nature of the drug is it reduces the assimilation of cholesterol in the small intestine. Assimilation of fat soluble vitamins, nutrients etc. from food or other sources are not affected. Eze can be taken alone or in combination with statins.
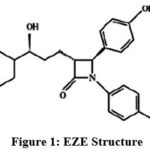 |
Figure 1: EZE Structure |
Simvastatin (SIM)
(Figure 2), is a hypolipedemic agent [2]. It is off-white to practically white in color
and exhibits crystalline nature. Solubility of SIM is poor or practically
insoluble in aqueous media such as water, whereas it freely dissolves in
chloroform, ethanol and methanol. SIM is chemically entitled as “Butanoic acid,
2,2-dimethyl-,
1,2,3,7,8,8a-hexahydro-3,7-dimethyl-8-[2-(tetrahydro-4-hydroxy-6-oxo-2H -pyran-2-yl)ethyl]-1-naphthalenyl
ester, [1S -[1α,3α,7β,8β(2S *,4S
*),8aβ]]” with a molecularformula C25H38O5 and molar mass 418.57 g.mol-1[3]. The
therapeutic nature of this drug is to lower the amount of cholesterol produced
by liver. SIM lowers the threat of heart disease by lowering the production of
bad cholesterol and raising good cholesterol.
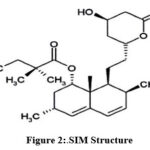 |
Figure 2:.SIM Structure. |
EZE and SIM tablets are marketed with the name VYTORIN. It is available for oral administration. In the combined drug product EZE is present as 10mg only, but SIM is present as 10mg, 20mg, 40mg, and 80mg. The therapeutic nature of this combined drug is to lower the amount of bad cholesterol produced by liver and to enhance the good cholesterol. The combination of EZE and SIM is more effective in lowering the production of bad cholesterol, elevate good cholesterol and hence minimize the chances of heart stroke. [4].
As per the wide-ranging literature hunt, estimation of the EZE and SIM in its combined dose form is reported by Spectrophotometric determination [5-7], by HPTLC [8-9] and by HPLC [10-15]. There are also HPLC methods cited for impurities quantification in their individual dosage forms [16-18]. There are HPLC methods reported to determine probable impurities in their combination dosage form [19]. LCMS method is also reported for quantification of EZE and SIM in human plasma [20]. Literature search indicates absence of method for quantification of probable impurities originating from EZE and SIM in combined dose combination using UHPLC. High variations are seen in the polarity nature of the impurities of EZE and SIM. Hence for quantification of probable impurities from EZE and SIM by ultra-performance liquid chromatographic technique (UHPLC) is the preliminary option to get shorter run time and to achieve specific and stability demonstrating so that number of samples can be analyzed in a day.The current method is more precise and robust when compared to Seshukumar et al.,
This method is capable to separate all the probable impurities and peaks formed during different stress conditions in forced degradation studies and meets the ICH requirement parameters [21-25]. Probable impurities that are formed from EZE is EZE impurity-1, EZE impurity-2, (Figure3). For SIM is SIM Impurity-1, SIM Impurity-2a, SIM Impurity-2b, SIM Impurity-3,4, 5, 6 and 7 (Figure 4). SIM Impurity-2a and SIM Impurity-2b elute as split peak as both peaks are epimers.
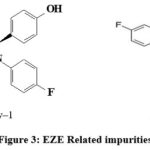 |
Figure 3: EZE Related impurities. |
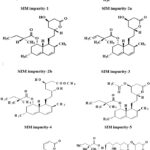 |
Figure 4: SIM Related impurities. |
Materials and Methods
Instruments
Waters acquity UPLC instrument with binary pump, auto injector, thermostated column controller and PDA detector used for evaluation of peak homogeneity, purity of analytes and for quantification purpose. Empower Pro software was used as interphase. Waters Acquity High strength silica (HSS) T3 1.8µ, 100 × 2.1 mm column was used for separation of components and the probable impurities originating from EZE and SIM.
Chemicals
Pure components (EZE and SIM), EZE and SIM impurities, Ezetimibe and Simvastatin tablets (VYTORIN 10/20 tablets) Acetonitrile, Perchloric acid Sodium dihydrogen orthophosphate dihydrateare sponsored by Aurobindo Pharma Limited. Milli Q water is used for all purposes.
Method development and optimization
EZE and its impurities are polar when compared to SIM and its impurities. Attaining specific and stability demonstrating with short run time method is difficult in HPLC. In order to develop a short run time method which is specific, the choice of separation for these impurities which are polar and highly non polar is likely dependent on low ID and low micron columns using UHPLC.
Trials were initiated using Acquity BEH C18, 1.7µ, 100 x 2.1 mm column using pH 3.0 sodium phosphate buffer along with acetonitrile in step gradient mode with 0.5 mL/min, at temperature 40°C. EZE, its impurities and SIM, its impurities were injected to observe the pattern of elution. EZE and its impurities eluted very closely and SIM, SIM Impurity-5 co-eluted. Trials were extended with the above conditions by modifying gradient programme, but satisfactory separation could not be achieved.
Trials were continued further using same above conditions by using the column High strength silica (HSS)-T3, 1.8µ, 100 x 2.1mm. In initial trials SIM Impurity-7 merged with an unknown peak and later in further trails SIM Impurity-2a, SIM Impurity-2b, SIM Impurity-3 co-eluted. Trials could not be succeeded by modifying gradients, column temperature and flow.
From the above experiments it could be understood that separation of impurities is favorable in lower pH only. The idea to select perchloric acid is, it acts as ion pair and less viscous in nature. Elution Phase~A is 0.1% Perchloric acid and phase~B is acetonitrile. Step gradient mode elution is opted with High strength silica (HSS)-T3, 1.8µ, 100 x 2.1 mm column. Logical trials were initiated and the elution pattern of the components and its impurities were studied at 0.5 mLflow.
Finally chromatographic conditions were finalized with high strength silica (HSS)-T3,1.8µ, 100 x 2.1mm column kept at 40°C with 0.5mL.min-1 flow. Acetonitrile along with 20 mM sodium phosphate buffer mixed in the proportion of 40:60 is opted as diluent for preparing solutions.
To check the individual impurities wavelength maxima between 220 nm and 240 nm and whereas SIM shows at about 280 nm (Fig.3). To adopt a common quantification wavelength for all impurities, it is proposed to keep 238nm. 5 µL injection volume showed satisfactory responses at 200µg/mL for EZE and 400 µg/mL for SIM.
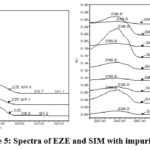 |
Figure 5: Spectra of EZE and SIM with impurities. |
Finalized chromatographic conditions
Finalized conditions are depicted in Table 1.
Table 1: Chromatographic conditions
|
Chromatographic conditions |
||||
|
Column |
Waters Acquity(HSS)-T3 1.8µ, 100 x 2.1 mm |
|||
|
Temperature |
40°C. |
|||
|
Inj. volume |
5 µL. |
|||
|
Detection |
238 nm. |
|||
|
Elution phase~A |
0.1% perchloric acid. |
|||
|
Elution phase~B |
Degassed acetonitrile |
|||
|
Diluent |
20 mM sodium phosphate buffer and acetonitrile in the proportion of 40:60. |
|||
|
Step Gradient programme
|
Time (in min) |
Flow(mL |
% Elution phase~A |
% Elution phase~B |
|
0.01 |
0.5 |
65.0 |
35.0 |
|
|
2.0 |
0.5 |
65.0 |
35.0 |
|
|
10.0 |
0.5 |
10.0 |
90.0 |
|
|
14.0 |
0.5 |
10.0 |
90.0 |
|
|
14.5 |
0.5 |
65.0 |
35.0 |
|
|
18.0 |
0.5 |
65.0 |
35.0 |
|
System suitability data have been summarized in Table 2.
Table 2: System suitability data
|
Name of Drug/Impurity |
Retention times in minutes |
USP # Resolution |
USP # Tailing factor |
USP # Theoretical plates |
|
EZE Impurity_1 |
2.05 |
— |
1.52 |
3705 |
|
EZE |
2.51 |
3.19 |
1.39 |
4802 |
|
EZE Impurity_2 |
3.68 |
8.84 |
1.24 |
15844 |
|
SIM Impurity_1 |
5.10 |
12.25 |
1.18 |
32476 |
|
SIM Impurity _ 2a&2b |
5.74 |
5.59 |
1.74 |
40427 |
|
SIM Impurity _3 |
6.12 |
3.39 |
1.14 |
52349 |
|
SIM |
6.57 |
4.27 |
1.13 |
61659 |
|
SIM Impurity_4 |
6.89 |
3.05 |
1.13 |
68290 |
|
SIM Impurity_5 |
8.29 |
13.79 |
1.09 |
118209 |
|
SIM Impurity_6 |
8.55 |
2.73 |
1.10 |
123099 |
|
SIM Impurity_7 |
13.74 |
40.10 |
1.06 |
122171 |
Solution Preparations
Standard solution preparation
Pure drug solution concentration containing 0.20 and 0.60 μg/mL of EZE and SIM respectively is prepared
Sample solution preparation
Take not less than 10 tablets and crush them to get finer power. Take sample powder corresponding to 10 mg of EZE or 20 mg of SIM and sonicated for 30 minutes. Test solution is mixed intermittently to get homogeneity of solution. 15 mL of sample solution is taken into centrifuge tube and performed centrifugation at 5000 rpm for about 10 minutes. The upper clear solution filtered and sample concentration is about 200 and 400 μg/mL of EZE, SIM.
Method Validation
VYTORIN tablets are used in 10 mg for EZE. 10mg, 20mg, 40mg and 80mg for SIM.VYTORIN (10/20mg) tablets containing EZE 10 mg and SIM 20mg are considered.
Specificity and Stress degradation
Specificity of the optimized method was confirmed by injecting placebo, individual impurities
Table 3: Specification limit of impurities
|
Name of the component |
Specification Limit in % |
Specification Limit in µg.mL-1 |
|
EZE Impurity _1 |
0.2 |
0.4 |
|
EZE Impurity _2 |
0.2 |
0.4 |
|
SIM Impurity _1 |
0.2 |
0.8 |
|
SIM Impurity _2a |
0.2 |
0.8 |
|
SIM Impurity _2b |
0.2 |
0.8 |
|
SIM Impurity _3 |
0.2 |
0.8 |
|
SIM Impurity _4 |
0.2 |
0.8 |
|
SIM Impurity _ 5 |
0.2 |
0.8 |
|
SIM Impurity _6 |
0.2 |
0.8 |
|
SIM Impurity _7 |
0.2 |
0.8 |
For oxidative stress condition, sample was stressed with 30% H2O2 for about 15 minutes.
Precision
Sample powder taken for analysis and prepared six individual test preparations, spiked with impurities at proposed specification level and loaded into UHPLC. Observed results were calculated for % w/w and % RSD and is assessed for each impurity. Similarly ruggedness experiment was repeated with another lot column, different UHPLC system on different day.
Sensitivity of the test method
LOD along with LOQ values were determined by loading series of injections ranging from (1 to 150) % of proposed specifications, using impurity stock solutions and precision was performed based on predicted concentrations derived from linearity curves.
Linearity and range
Linearity and range was established by injecting series of injections ranging from observed LOQ level of each impurity to 150% to the proposed specification limit. Slope, correlation coefficient and Y-intercept for each impurity were calculated individually from linearity curve.
Accuracy
Impurity stock solution was prepared and accuracy was proved by spiking them to the control sample at proposed LOQ, 50%, 100% and 150% concentration level. Based on % w/w observed results, calculated the accuracy values. Each spiking procedure was done in triplicate preparations.
Solution Stability
To establish solution stability, standard and sample solutions were periodically injected at refrigerated temperature (~6°C) at different time intervals. Values at different time points were extrapolated from initial freshly injected solutions of standard and sample.
Robustness
By performing deliberate changes in the proposed methodology, robustness of the method was assessed. Flow rate was from 0.45mL and 0.55mL per minute, temperature is 35°C and 45°C, and wavelength is 233nm and 243 nm. In each experiment one parameter was deliberately altered and rest of the parameters were kept unchanged.
Results and Discussion
Specificity and Stress studies
Comprehensive degradation data suggests the following behavior . Table 4 and Figure 6 explain the data.
Table 4: Comprehensive forced degradation study
|
Stress condition |
Time interval |
% impurities+ %Degradation products |
Major Appeared impurities |
|
|
EZE |
SIM |
|||
|
Acid (0.1M HCl / 25°C) |
5 minutes |
— |
5.89 |
SIM Impurity-I significantly formed & Major unknown of EZE and SIM is not seen. |
|
Base (0.05M NaOH / 25°C) |
1 minutes |
0.35 |
7.4 |
SIM Impurity-I significantly formed & Major unknown of EZE and SIM is not seen. |
|
Oxidation (30% H2O2 / 25°C ) |
60 minutes |
0.31 |
0.22 |
No significant known and unknown impurities of EZE and SIM were seen. |
|
Thermal (Heated at 85°C) |
48 hours |
0.62 |
0.48 |
SIM Impurity-I insignificantly formed & unknown of EZE and SIM seen at insignificant levels. |
|
Humidity (90%RH at 25°C) |
120 hours |
— |
— |
No significant known and unknown impurities of EZE and SIM were seen. |
|
Photolytic (10K Lux along with UV 200 watt hours/m2). |
7 days |
— |
— |
No significant known and unknown impurities of EZE and SIM were seen. |
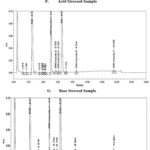 |
Figure 6: Impurity mixture spiked in sample and stressed samples in different conditions. |
Method Validation
Method Validation results for EZE and SIM is summarized in Table 5a & 5b.
Table 5a: Validation results for EZE and impurities
|
Parameter |
IMP-1 |
IMP-2 |
EZE |
|
Precision (%RSD)(n=6) |
1.9 |
1.9 |
— |
|
Ruggedness (%RSD)(n=6) |
3.8 |
2.5 |
— |
|
Accuracy@LOQ (n=3) |
95.8 |
95.6 |
— |
|
Accuracy@50% (n=3) |
94.7 |
96.1 |
— |
|
Accuracy@100% (n=3) |
95.8 |
100.5 |
— |
|
Accuracy@150% (n=3) |
92.8 |
97.5 |
— |
|
LOD (%w/w) |
0.007 |
0.007 |
0.007 |
|
LOQ (%w/w) |
0.020 |
0.021 |
0.020 |
|
Correlation coefficient |
0.99973 |
0.99885 |
0.99944 |
|
slope |
123263 |
19416 |
22790 |
|
Intercept |
-129 |
94 |
11 |
Table 5b: Validation results for SIM and impurities.
|
Parameter |
IMP-1 |
IMP-2a &2b |
IMP-3 |
IMP-4 |
IMP-5 |
IMP-6 |
IMP-7 |
SIM |
|
Precision (%RSD)(n=6) |
1.5 |
1.2 |
2.0 |
2.0 |
2.2 |
1.9 |
3.1 |
— |
|
Ruggedness (%RSD) (n=6) |
3.5 |
1.7 |
0.9 |
2.0 |
3.0 |
1.9 |
2.8 |
— |
|
Accuracy@LOQ (n=3) |
101.1 |
99.2 |
100.8 |
104.5 |
97.6 |
98.7 |
96.7 |
— |
|
Accuracy@50% (n=3) |
95.5 |
101.5 |
97.3 |
94.7 |
97.5 |
104.6 |
99.1 |
— |
|
Accuracy@100% (n=3) |
105.8 |
97.6 |
97.7 |
95.9 |
93.8 |
97.7 |
100.8 |
— |
|
Accuracy@150% (n=3) |
98.8 |
93.7 |
96.6 |
105.0 |
93.1 |
99.3 |
95.5 |
— |
|
LOD (%w/w) |
0.003 |
0.003 |
0.007 |
0.003 |
0.003 |
0.003 |
0.007 |
0.003 |
|
LOQ (%w/w) |
0.010 |
0.012 |
0.021 |
0.013 |
0.015 |
0.012 |
0.022 |
0.012 |
|
Correlation coefficient |
0.99989 |
0.99988 |
0.99972 |
0.99990 |
0.99985 |
0.99984 |
0.99902 |
0.99976 |
|
slope |
32112 |
32639 |
11956 |
21144 |
20168 |
28761 |
7723 |
40189 |
|
Intercept |
-15 |
-149 |
18 |
-52 |
42 |
22 |
-34 |
-25 |
Solution Stability
SIM Impurity-1 show increase in trend and exceeds beyond the acceptance criteria after 10 hours. Hence the standard solution and sample solution are stable for about 36 hours and10 hours at refrigerated temperature (~6°C) respectively.
Robustness
SIM and SIM Impurity-4 shows insignificant change in resolution all conditions. Remaining peaks shows satisfactory resolution for remaining eluting peaks.
Conclusion
Developed method is suitable for quantification of EZE,SIM impurities present in combination drug product in a single injection. This method is robust, specific and stability demonstrating.There is no such method published earlier using UHPLC especially under these optimum conditions. Wavelength of 238 nm is suitable for quantification purpose. Linearity data shows greater than 0.99 correlation coefficient. Accuracy , precision are obeyed and method followed as per ICH guide lines. The samples at different shelf life conditions can be tested using this method without any interference. Also, short run time of the assay method enables analysis of more number of samples. Hence the method is appropriate for estimation of impurities.
Acknowledgement
The author acknowledge Aurobindo Pharma Limited management.
Conflicts of Interest
All authors say no conflict of interest regarding this work.
References
- Margaret,V. H.; Constance, F.; Douglas, S. C.; Lizbeth, H.; Harry, R. D. Br J Pharmacol.2001, 134, 409-417.
- Chang, H.A.; Sung, H,.hoi. Diabetes Metab. 2015, 39, 87-94.
CrossRef - Ugandar, R. E.; Kiran, C. N.; Lui D. L. World J. Pharm. Res. 2015,4, 2693-2718.
- Alberto, C. European Cardiovascular Disease. 2007, 3,12-15.
- Souri, E.; Amanlou, M. E-J. Chem. 2010, 7, S197-S202.
CrossRef - Mane, V.B.; Babar, S.; Kulkarni, N. Int. J. PharmTech Res. 2011, 3, 459-1466.
- Dhole, S.M.; Yeole, M.P. Der Pharm. Lett.2015, 7 , 124-128.
- Shivshanker, K.; Sreekanth, N.; Harikrishnan, N.; Roosewelt, C.; Rao, G.S.; Gunasekaran, V. Asian J. Chem.2007, 19 , 4303-4308.
- Dixit, R.P., Barhate, C.R.; Nagarsenker, M.S. Chromatographia,2008, 67, 101-107.
CrossRef - Nagaraju, P.; Vishnu Vardhan, Z. Journal of Global Pharma Technology, 2 (4), 113-117(2010).
- Dixit, R. P.; Barhate, C. R.; Padhye, S. G.;Viswanathan, C. L.; Nagarsenker, M. S. Indian J Pharm Sci.2010,72 , 204–210.
CrossRef - Ravi Varma, A.; Shanmukha Kumar, J.V.; Mutta Reddy, S. Der Pharm. Lett, 2015, 7, 204-212.
- Bozhanov, S.; Maslarska, V. Pharmacia. 2016, 63, 35-48.
- Wadher Sailesh, J.; Shivpuje Shivraj, S.; Liyakat, S.I. Res. J. Pharm. Technol.2018 ,11, 1553-1558.
CrossRef - Kurbanoglu, S.; Esim, O.; Ozkan, C.K.; Savaser, A.; Ozkan, Y.; Ozkan, S.A. Chromatographia.2019, 82, 279-285.
CrossRef - Anuradha, K.; Gajjar.; Vishal, D.; Shah.; The Open Conference Proceedings Journal. 2011,2, 108-112.
CrossRef - Radha Krishna, S.; Girish, R.; Deshpande.; Rao, B.M.; Someswara, Rao, N. J. Chem. Pharm. Res.2010, 2, 91-99.
- Luo, Z.; Deng, Z.; Liu, Y.; Wang, G.; Yang, W.; Hou, C.; Tang, M.; Yang, R.; Zhou, H. Talanta, 2015, 139, 67-74.
CrossRef - Desai, P.R.; Mehta, P.J.; Ojha, S.K.; Chokshi, A.B. Acta Chromatogr.2017, 30, 1-10.
- Validation of Compendial Methods <1225>, The United States Pharmacopeia., 2012.
- Photo stability Testing of New Drug Substances and Products, ICH, Q1B., 2005.
- Analytical Procedures and Methods Validation, US FDA Guidance., 2000.
- Validation of Analytical Procedures: Text and Methodology, ICH, Q2 (R1)., 2005.
- Stability Testing of New Drug Substances and Products, ICH, Q1A (R2).,2005.
Accepted on: 12 Jan 2024
Second Review by: Dr. A. Durgvanshi
Final Approval by: Dr. Ioana Stanciu


![]()


