PM2.5 Concentrations in a Rapidly Developing Neighborhood in the City of Lomé, Togo
Sonla Hèzouwè1 , Sabi Kokou1*, Michael Giordano2, Garima Raheja3, Daniel M. Westervelt3
1Laboratoire de Chimie Atmosphérique (LCA), Faculté Des Sciences (FDS), Université de Lomé (UL), Togo.
2Univ Paris Est Creteil, CNRS UMS 3563, Ecole Nationale des Ponts et Chaussés, Université de Paris, OSU-EFLUVE – Observatoire Sciences de L’Univers-Envelopes Fluides de La Ville à L’Exobiologie, F-94010 Créteil, France.
3Lamont-Doherty Earth Observatory of Columbia University, New York, USA.
Corresponding Author E-mail: sabikokou@yahoo.fr
DOI : http://dx.doi.org/10.13005/ojc/400117
Download this article as:
![]()
A rapid increase in the population of Togo, and in particular that of the capital city of Lomé, has led to an increase in urban sprawl, anthropogenic activities such as traffic and combustion, and air pollution. To measure and identify trends in concentrations of fine particulate matter (PM2.5) in the city of Lomé in Togo, a PurpleAir PA-II-SD monitor is placed in the rapidly expanding peripheral district of Agoè-Minamadou for three years. A correction factor, based on a colocation with a ThermoFischer TEOM reference monitor at the University of Lomé, is presented and applied to the PurpleAir data. We demonstrate improvement in PM2.5 estimates using this locally-built correction factor over a previous correction factor based on a colocation in nearby Accra, Ghana. Daily mean corrected PM2.5 concentrations were 21.5 µg m-3. Concentrations exceeded the WHO daily recommended thresholds (15 µg/m3) on 68.2% of days measured during the study. Over three years of measurement, air quality in Lomé shows very little improvement.
KEYWORDS:Atmosphere; Agoè-Minamadou; low-cost sensor; Particulate Matter
Introduction
Air pollution is a global human health issue. Anthropogenic sources of particulate matter (PM) emissions include road traffic, air transportation, wood and waste combustion, industrial production, domestic activities, energy production, and other forms of combustion (Lamri Naidja et al., 2018; Delmas et al., 1999). PM2.5, or fine particulate matter (up to 2.5 µm in diameter), consists of natural or anthropogenic airborne solid or liquid particles (aerosols). Depending on their size and composition, PM2.5 has short- and long-term effects on human health (respiratory and cardiovascular diseases) (Chen 2016; WHO 2005), ecosystems, property, and the economy (Greater London Authority 2019).
Our study area is the country of Togo, which belongs to the category of least developed countries (LDCs) and ranks 167th in the world according to the 2020 Human Development Index (HDI) (UNDP – Human Development Report 2020). Lomé, the capital city of Togo, is located on the southwestern coast of the country, along the Gulf of Guinea with a tropical (Guinean-type) climate with annual average temperatures ranging from 23°C in the morning to 30°C in the evening. The majority of the Togolese population is concentrated in Lomé (1.5 million inhabitants out of 6.2 million nationally), according to the 4th General Census of Population and Housing (DGSCN – RGPH Togo 2010) with rapid growth in its outlying areas. A recent study conducted on air quality in Lomé specifically on PM2.5 reveals that the concentrations of these particles are four to five times higher than the recommendations of the World Health Organization (WHO) (Raheja et al., 2022). This study aims to characterize the daily concentrations of PM2.5 in Agoè-Minamadou (AM) in the city of Lomé, Togo. AM is a district of the city of Lomé located southwest of Agoè-Assiyéyé and northwest of Cacaveli with a latitude of 6.225° North and a longitude of 1.186° East. The AM district is rapidly developing, as rising costs in the city center of Lomé have “priced out” many former inhabitants that are seeking more affordable living arrangements. There is concern that this growth has thus generated an increase in the sources of air pollutants, which constitute a danger for the health of the growing population.
While many cities in Africa experience high levels of air pollution, they remain severely undermonitored (UNICEF, 2019 TODO). More than 400 million children in Africa live in areas with no reliable air quality monitoring. This is partially because the cost of traditional air quality measurement instruments is very high. For example, a MetOne Beta Attenuation Monitor 1020, can cost upwards of USD$100,000 when accounting for instrument costs, maintenance, and climate control. However, there is an emerging consensus in the research community that recent advances in low-cost sensor technology, such as PurpleAir (cost: USD$250) combined with data science, can offer affordable advances in real-time, high-density monitoring of PM2.5. (TODO CITE)
In order to best use these low-cost sensors, it is important to colocate them with reference monitors to develop a local correction factor. In this paper, we aim to develop a local correction factor for low-cost PM2.5 sensors, and we use it to estimate PM2.5 in a severely undermonitored location. We present PM2.5 concentrations in a rapidly growing informal neighborhood in greater Lomé (Agoè-Minamadou) over a three year period. We first provide the first ever local air sensor correction factor in Lomé (and one of the first in all of Africa) based on a TEOM colocation with a PurpleAir. Such correction factors are vital to obtain useful, accurate data from the proliferation of air sensors throughout the African continent. We apply the new correction factor to our data in the Agoè-Minamadou (AM) neighborhood of Lomé. Finally, we compare the performance of four correction models and a locally-developed correction factor versus one developed in Accra, Ghana (from Raheja et al. 2022).
Materials and Methods
Our managed methodology is based on the use of a low-cost sensor calibrated in ambient air.
To measure PM2.5 concentrations, we use a PurpleAir (PA) sensor, located at 6,227° north latitude and 1,193° east longitude (Figure 1). The PurpleAir (PA) PA-II-SD sensor contains two Plantower sensors, which use a laser light source and a photodetector to take care of light scattering by particles inside the sensor. The AP also includes Bosch BME 280 sensors to estimate pressure, relative humidity and temperature of the location (Raheja et al., 2022). PA primarily measures PM2.5 and has limited ability to detect supermicron particles. Supermicron dust particles are not easily recorded by a Plantower-based sensor due to unfavorable light scattering angles and particle suction (Rueda et al., 2023).
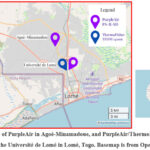 |
Figure 1:Map of PurpleAir in Agoè-Minamadoue, and PurpleAir/ThermoFisher TEOM colocation at the Université de Lomé in Lomé, Togo. Basemap is from Open Street Map. |
We colocate another PurpleAir monitor with a reference-grade ThermoFisher Tapered Element Oscillating Microbalance (TEOM) 1400a installed at the Université de Lomé, located at latitude 6.177o and longitude 1.212o (Figure 1). The TEOM 1400a is a gravimetric PM2.5 monitor that preceded the latest model from Thermo-Fischer, TEOM 1405, which is certified as a Federal Equivalent Method monitor by the United States Environmental Protection Agency. Air is drawn through the TEOM control unit and mass transducer where particles are deposited onto a filter where electronically-sensed changes in the oscillation frequency of a glass tube (tapered element) are used to calculate mass deposited onto the filter (Rupprecht and Patashnick, Co., 2008).
The data sampling period at the AM site is approximately three years between May 2020 and January 2023. The Python language is used for data processing. The data analysis method includes quality assurance and quality control applied on the raw PA data, following literature standards: data entries are removed when they contain NaN values, large negative values, and PM2.5 values outside of the optimal PA measurement range are removed (below 0 µg/m3 and above 1000 µg/m3), and where the Channel A and Channel B measurements differ by more than 20 µg/m3 (Raheja et al., 2022).
A correction to the raw data is made using two approaches: (1) PurpleAir versus MetOne Beta Attenuation Monitor (BAM-1020) colocation carried out in Accra, Ghana and (2) PurpleAir versus TEOM colocation at Université de Lomé. Details on the correction factor development in Accra and applicability to Lomé can be found in McFarlane et al. (2021b) and Raheja et al. (2022b). The correction factors use PM2.5, temperature, and humidity measurements from the PA. Since Lomé has similar sources of pollution as Accra and a very similar climate, and thus likely similar aerosol sizes, compositions, and optical properties, we hypothesize that the correction factors could be transferable between the two sites.We also develop a correction factor using the Lomé colocation. Correction factors derived using the colocation data were developed and tested from four advanced statistical and machine learning models: Multiple Linear Regression (MLR), Gradient Boosting Algorithm (XGBOOST), Random Forest (RF) and Gaussian Mixture Models (GMR). Figure 2 below shows the colocation between the TEOM (“reference”) and the average of the two PurpleAir channels (“PurpleAir”), along with the MLR correction developed from this colocation (“Lomé correction”) from data collected between October 2022 and February 2023 in Lomé, Togo.
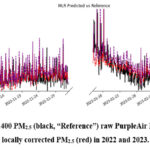 |
Figure 2: TEOM-1400 PM2.5 (black, “Reference”) raw PurpleAir PM2.5 (Purple), and locally corrected PM2.5 (red) in 2022 and 2023. |
Using this approximate 2-month colocated data set, we are able to develop a correction factor using multiple linear regression (MLR) according to equation 1:

Equation 1: PurpleAir correction using Multiple Linear Regression
where PM2.5,C refers to corrected PM2.5, PM2.5,A refers to PurpleAir PM2.5 Channel A, PM2.5,B refers to channel B, T refers to temperature in degrees Celsius, and RH refers to relative humidity in percent. The coefficient of determination for the fit in equation 1 is 0.63 and the p-value is close to zero for each of the explanatory variables.
The colocation of 2 months is the same length as recommended by the Air Quality Sensor Performance Evaluation Center (AQ-SPEC) protocol, a global authority on colocation of sensors versus reference grade (Polidori et al., 2017). Longer colocations can be helpful in covering a greater range of environmental and source conditions (McFarlane et al., 2021b), especially in environments like West Africa where rainy seasons contrast starkly with the dry dusty Harmattan. A drawback of long colocations is that they are not always practical. Given the practicality issue and the time length recommended by AQ-SPEC, we find a 2 month colocation as appropriate for this work, and leave longer colocations to future work.
Results
We present daily average PM2.5 concentrations data between 2020-2023 with and without correction factors as developed using Equation 1 above (Lomé TEOM colocation). We draw our conclusions from the corrected data alone but show the uncorrected, raw data for comparison.
The measurements carried out between May 2020 and January 2023 at the AM site with the MLR correction are presented in Figure 3. Daily concentrations during this time period can be close to zero on very clean days and up to 80 µg/m3 on polluted days, with a daily average of 21.5 µg/m3. Concentrations are highest in months of December, January, and February, corresponding to the Harmattan season in which dust-laden air is transported from the Sahara desert to West Africa. Concentrations are generally lowest during the rainy seasons (April-July, September-October). On the basis of corrected data, the PM2.5 concentrations at AM exceed the thresholds recommended by WHO (15 µg/m3) during most of the year in the area of AM (68.2% of measured days).
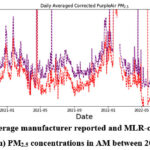 |
Figure 3: Daily average manufacturer reported and MLR-corrected (using UL colocation) PM2.5 concentrations in AM between 2020 – 2023 |
Figures 4, 5 and 6 represent the observations corrected with the Random Forest, XGBoost, and GMR models, respectively. These corrections are based on the local Lomé colocation. We use these four correction models due to their popularity in the literature and their unique advantages. For instance, MLR is the simplest model and therefore is attractive for use, but it can sometimes be outperformed by models that are able to capture nonlinear relationships, handle missing data, and generally have more flexibility. Gaussian Mixture Regression is used as it has been shown to outperform MLR in nearby Accra, Ghana (McFarlane et al., 2021). Random Forest and XGBoost are popular tree-based methods which have been used in past studies (Rueda et al., 2023). Results indicate that each of the models have broadly similar performance. Some of the largest differences come towards the end of the dataset (late 2022 and early 2023). The MLR model (Figure 3) and GMR (Figure 6) model show concentrations near 0 for the end of 2022, whereas the RF and XGboost models (Figures 4 and 5) show higher concentrations during this period. There is a higher frequency of missing data during this period which impacts these findings.
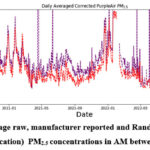 |
Figure 4 : Daily average raw, manufacturer reported and Random Forest-corrected (using UL colocation) PM2.5 concentrations in AM between 2020 – 2023 |
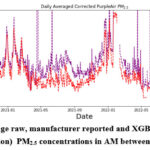 |
Figure 5: Daily average raw, manufacturer reported and XGBoost-corrected (using |
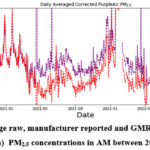 |
Figure 6: Daily average raw, manufacturer reported and GMR-corrected (using UL co location) PM2.5 concentrations in AM between 2020 – 2023 |
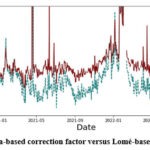 |
Figure 7: Comparison of Accra-based correction factor versus Lomé-based correction factor using MLR |
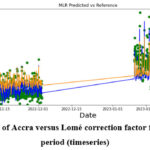 |
Figure 8: Performance of Accra versus Lomé correction factor for the co-location time period (timeseries) |
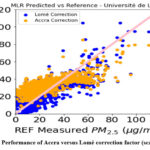 |
Figure 9: Performance of Accra versus Lomé correction factor (scatter plot). |
Figure 7 compares the Lomé-based correction factor with the Accra-based correction factor. The Accra-based correction factor in Figure 7 generally results in much higher estimates of PM2.5 compared to a Lomé based correction factor. This points to the importance of using a locally-built correction factor in order to get the most accurate PM2.5 information, as using an Accra correction factor here may bias high the estimates for PM2.5. Figure 8 and 9 compare the TEOM (green dots) with the Lomé (blue line) and Accra (yellow line) based correction factors, and confirms that the Lomé correction factor almost always performs better, probably because it better represents the aerosol emissions (size and composition) and environmental conditions (relative humidity) in Lomé.
Discussion
Using the colocation technique for observing concentrations measured by the AM site allows for correction of the PA data and the comparison of various correction factors (Figure 10). The RF model is the best performing correction factor model of the sensor data at low concentrations, but other papers (Raheja et al., 2023) have shown that it is unable to account for particulate matter concentrations outside the range of the training data used to build the model. Both the MLR and GMR correction factors perform very well throughout the entire data range. We therefore recommend the use of either of these models for building correction factors. MLR is easier to implement, though GMR has advantages of being able to better deal with nonlinear data.
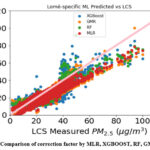 |
Figure 10: Comparison of correction factor by MLR, XGBOOST, RF, GMR models. |
There is little improvement in air quality in Togo during the study period. As seen in Figures 3-6, the concentrations during Summer 2020 (May 2020 – September 2020) are quite similar to the concentrations of Summer 2021 (May 2021 – September 2021), and the Harmattan 2020 (December 2020 – February 2021) concentrations are similar to the Harmattan 2021 (December 2021 – February 2022). There is a decrease in PurpleAir measured and corrected concentrations in Summer 2022; however, the measurement frequency is low in this timeframe and the data sparsity makes it difficult to ascertain trends and errors, and therefore this time period is not considered when assessing change over time.
The concentration of fine particles during periods of intense anthropogenic activity far exceeds the thresholds recommended by the World Health Organization (WHO) (5 µg/m3 annually and 15 µg/m3 daily) (WHO 2021). This means that the air quality may constitute a negative impact to the health of the population during the periods of intense activities but also likely year-round. As these particles are composed of chemical substances such as salts (nitrates, sulfates, carbonates), organic carbon compounds, oxides or polycyclic aromatic hydrocarbons, trace elements (heavy metals) (Amount 2012), reduction measures must be taken to improve air quality in Lomé and in particular in AM area in order to preserve the health of the local residents. Future work could characterize the exact composition of the particles using more advanced techniques.
There is scarce data about the emissions sources contributing to these high concentrations in Lomé. It is therefore difficult to conclude much about sources of pollution without further research, which we leave for future work. According to daily qualitative observations (“source walks”) by residents of Lomé, domestic waste burning is frequently observed in the AM district, which is likely a main contributing emission source along with domestic cooking with solid fuels. Additionally, unlike many of the roads in Lomé including those near the University of Lomé (UL), nearly all of the roads in the AM district are unpaved. Dust particles generated from vehicles traveling on unpaved roads is also a likely source of PM2.5. These qualitative observations should be supplemented in future work with full-scale, high-cost source apportionment studies.
The peak concentrations of particulate matter exceed the WHO thresholds in most cases. PM2.5 levels have not improved in the AM neighborhood over recent years. Consequently, the population living in the vicinity is exposed to short-term and long-term health effects of poor air quality. Thus, mitigation measures must be adopted to limit PM emissions in the ambient air and for health. The results of this work can be used as an information base for decision making in environmental policy and specifically in air quality.
Acknowledgement
The authors would like to thank the University of Lomé and Columbia University as well as the Clean Air Monitoring and Solutions Network and AfriqAir. This work was supported by NSF grant OISE 2020677 and US Dept of State grant SLMAQM21CA3263.
Conflict of Interest
There are no conflict of interest.
References
- Emilio Molina Rueda et al., 2023. Size-Resolved Field Performance of Low-Cost Sensors for Particulate Matter Air Pollution. Environmental Science & Technology Letters, p7. https://doi.org/10.1021/ acs.estlett. 3c00030.
CrossRef - Garima Raheja et al., 2022. A Network of Field-Calibrated Low-Cost Sensor Measurements of PM2.5 in Lomé, Togo, Over One to Two Years. ACS Earth Space Chem. 2022, 6, 4, 1011–1021. https://doi.org/10.1021/acsearthspacechem.1c00391.
CrossRef - Rupprecht and Patashnick, Co. TEOM SERIES 1400a Ambient Particulate Monitor, Operating Manual (AB Serial Numbers), 2008. www.thermo.com/aqi.
- James R. Ouimette et al., 2022. Evaluating the PurpleAir monitor as an aerosol light scattering instrument. Atmos. Meas. Tech., 15, 655–676, 2022. https://doi.org/10.5194/amt-15-655-2022.
CrossRef - WHO 2021. WHO global air quality guidelines. Particulate Matter (PM2.5 and PM10), ozone, nitrogen dioxide, sulfur dioxide and carbon monoxide. https://creativecommons.org/licenses/by-nc-sa/3.0/igo.
- Celeste McFarlane et al., 2021. Application of Gaussian Mixture Regression for the Correction of Low Cost PM2.5 Monitoring Data in Accra, Ghana. ACS Earth Space Chem. 2021, 5, 9, pp 2268–2279. https://doi.org/10.1021/acsearthspacechem.1c00217.
CrossRef - World Bank Groupe 2021. Climate Change Knowledge Portal. https://climateknowledgeportal.worldbank.org/country/togo/climate-data-historical. (Accessed September 2022).
- Manisalidis, I., Stavropoulou, E., & Bezirtzoglou, E. 2020. Environmental and Health Impacts of Air Pollution: A Review. Frontiers Public Health, 8, Article No. 14. https://doi.org/10.3389/fpubh.2020.00014.
CrossRef - UNDP – Human Development Report 2020. Human Development Index (HDI). https://hdr.undp.org/data-center/human-development-index#/indicies/HDI.
- Greater London Authority 2019. PM2.5 in London: Roadmap to meeting Word Health Organization guidelines by 2030. www.london.gov.uk.
- C. Flamant 2018. The dynamics–aerosol–chemistry–cloud interactions in West Africa field campaign: Overview and Research Highlights. American Meteorological Society. DOI:10.1175/BAMS-D-16-0256.1.
CrossRef - Lamri Naidja, Hocine Ali-Khodja & Salah Khardi 2018. Sources and levels of particulate matter in North African and Sub-Saharan cities: a literature review. Environmental Science and Pollution Research (2018) 25:12303–12328. https://doi.org/10.1007/s11356-018-1715-x.
CrossRef - Rui Chen, et al., 2016. Beyond PM2.5: The role of ultrafine particles on adverse health effects of air pollution. BBA – General Subjects (2016). DOI: 10.1016/j.bbagen.2016.03.019.
CrossRef - Max Roser 2014. Human Development Index (HDI). Published online at OurWorldInData.org. Retrieved from: https://ourworldindata.org/ human-development-index [Online Resource].
- Direction Générale de la Statistique et de la Compatibilité Nationale (DGSCN) 2010. Togo Quatrième Recensement Général de la Population et de l’Habitat (PHC). Ref. TGO_2010_PHC_v01_M. Dataset downloaded from https://inseed.tg/ on september 2022.
- WHO 2005. Health effects of transport-related air pollution. Copenhagen : WorldHealth Organization. Report edited by Krzyzanowski et al., 2005.
- Pope, C.A., 3rd, et al., 2002. Lung Cancer, Cardiopulmonary Mortality, and Long-Term Exposure to Fine Particulate Air Pollution. JAMA, 287, 1132-1141. http://dx.doi.org/10.1001/jama.287.9.1132.
CrossRef - Delmas et al., 1999. ‘Experiment for Regional Sources and Sinks of Oxidants (EXPRESSO): An overview. Journal of Geophysical Research 104. DOI: 10.1029/1999JD900291.
CrossRef - Polidori, A., et al. “Field Evaluation of Low-Cost Air Quality Sensors.”. Air Quality Sensor Performance Evaluation Center , 2017. http://www.aqmd.gov/docs/default-source/aq-spec/protocols/sensors-field-testing-protocol.pdf. Last accessed August 28, 2023.
Accepted on: 03 Jan 2024
Second Review by: Dr. Adil khan
Final Approval by: Dr. Tawkir Sheikh


![]()


