Establishment and Validation of Stability-indicating Approach for Quantifying Dihydroquinine in the Quinine Sulphate Pharmaceutical Dosage form by RP-HPLC
Bhagwan S. Mehetre, Shailesh S. Gurav , Satosh V. Raskar and Krishnakant T. Waghmode*
Department of Chemistry, Central Research Laboratory, D. G. Ruparel College, Mumbai, Maharashtra, India.
Corresponding Author E-mail: krishnakantwaghmode@gmail.com
DOI : http://dx.doi.org/10.13005/ojc/400127
Article Received on : 09 Nov 2023
Article Accepted on :
Article Published : 19 Jan 2024
Reviewed by: Dr. Malinee Sriariyanun
Second Review by: Dr. Bharani Pandilla
Final Approval by: Dr. Tanay Pramanik
A rapid, efficient, and precise RP-HPLC protocol has been developed to quantify dihydroquinine content in quinine sulfate pharmaceutical dosage form accurately. This reverse-phase high-performance liquid chromatography (RP-HPLC) method has been validated in compliance with the regulatory guidelines and has efficaciously met specified criteria. The RP-HPLC analysis utilized a Zorbax C18-column with an acetonitrile-buffer mobile phase. A constant 1.2 mL/minute flow rate and a 20 μL injection volume were employed with a 316 nm detection wavelength. The linear range for standard solution concentrations was established at 48.7-193.87 μg/mL of quinine sulfate. Retention times were noted at 4.6 minutes for quinine and 6.9 minutes for dihydroquinine (impurity). The accuracy assessment of the dihydroquinine analysis revealed a recovery rate of 99.4%. In the present study, an analytical technique was devised and employed to quantify dihydroquinine in finished product tablets. The proposed technique is characterized by its precision, simplicity, and ease of adoption, demonstrating its robustness and applicability.
KEYWORDS:Dihydroquinine; Method Validation; Pharmaceutical Drug; Quinine Sulfate; RP-HPLC
Download this article as:| Copy the following to cite this article: Mehetre B. S, Gurav S. S, Raskar S. V, Waghmode K. T. Establishment and Validation of Stability-indicating Approach for Quantifying Dihydroquinine in the Quinine Sulphate Pharmaceutical Dosage form by RP-HPLC. Orient J Chem 2024;40(1). |
| Copy the following to cite this URL: Mehetre B. S, Gurav S. S, Raskar S. V, Waghmode K. T. Establishment and Validation of Stability-indicating Approach for Quantifying Dihydroquinine in the Quinine Sulphate Pharmaceutical Dosage form by RP-HPLC. Orient J Chem 2024;40(1). Available from: https://bit.ly/3O9mo95 |
Introduction
Quinine sulfate dihydrate is a pharmaceutical compound that holds a crucial place in the world of pharmaceuticals1. This compound is a hydrated form of quinine sulfate, a well-known alkaloid with a rich history in the treatment of diseases like malaria and babesiosis2. Quinine sulfate dihydrate, like its anhydrous counterpart, is primarily utilized for its antimalarial properties and remains a valuable tool in the fight against this deadly disease. It is a salt form of quinine, a natural alkaloid found in the bark of cinchona trees. Quinine sulfate dihydrate is valued for its medicinal properties, particularly in the management of malaria and some other health issues. Its effectiveness in treating malaria, especially caused by the Plasmodium falciparum parasite, has made it an important component in the arsenal against this life-threatening disease3. Additionally, quinine is employed in the treatment of nocturnal leg cramps4. Quinine sulfate has a crystalline structure and is often used in the form of a fine powder in tablets for oral administration or via intravenous injection. Quinine sulfate tablets are formulated to contain combined quantities of quinine sulfate and dihydroquinine sulfate, ensuring that the total is not less than 90.0% and not more than 110.0% of the labeled amount of quinine sulfate5. Quinine sulfate and its derivative, dihydroquinine, are commonly used to treat malaria and other parasitic infections. Both compounds have anti-malarial properties, but their pharmacological activities and therapeutic efficacy can differ. Both compounds exhibit some common side effects including headaches, tinnitus, visual disturbances, excessive sweating, irregular heartbeats, and increased sensitivity to sunlight with frequent use6-10. Therefore, determining the dihydroquinine content in a tablet is essential to ensure that the medication will effectively combat the disease it is intended to treat.
Further, the accurate quantification of dihydroquinine allows pharmaceutical companies to guarantee the proper dosage in each tablet. Inconsistent dosages can lead to treatment failure, drug resistance, or undesirable side effects. Hence, meticulous testing is vital to maintain uniformity and reliability in the medication. In the ongoing efforts to improve medication and drug formulations, researchers may need accurate data on the dihydroquinine content. Such information is crucial for optimizing drug delivery, improving therapeutic outcomes, and developing more effective and safer antimalarial treatments. Different compounds within a medication can lead to various side effects or interactions with other drugs11-12. Quantifying dihydroquinine in quinine sulfate tablets is a step towards understanding and minimizing potential side effects and drug interactions, thus contributing to patient safety. As pharmaceuticals are subject to strict regulations and guidelines set forth by health authorities, accurate determination of dihydroquinine content is necessary for compliance with these regulations, ensuring that the medication meets the requisite standards for safety and efficacy. Various liquid chromatographic practical approaches have been developed for maintaining consistent quality13-23. Likewise, several methods including HPLC, ion-pair HPLC-UV, TLC, spectrofluorimetric, and iodometric have been tested for the analysis of dihydroquinine or quinine sulfate in pharmaceutical dosage form24-28.
In conclusion, the determination of dihydroquinine from quinine sulfate tablets is not only necessary but also imperative for ensuring that patients receive the right dosage, maintaining consistent quality, and complying with regulatory requirements. It holds a pivotal role in enhancing the efficacy and safety of antimalarial treatments, thereby contributing significantly to the overall well-being of patients. With this consideration in mind, we report a rapid, efficient, linear, and precise RP-HPLC analytical approach to accurately determine the dihydroquinine content in quinine sulfate pharmaceutical tablets.
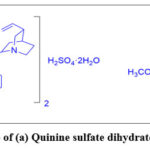 |
Scheme 1: Structure of (a) Quinine sulfate dihydrate (b) Dihydroquinine. |
Experimental
Material and Methods
Analytical (AR) and HPLC grade chemicals and reagents were utilised for the analysis. Analytical development and validation procedures were performed on the Shimadzu HPLC instrument equipped with a PDA detector having Lab solution software. Analysis was achieved using Zorbax Eclipse plus C18 column (100 mm × 4.6 mm, particle size: 5 µm), and 316 nm detection wavelength was used. Based on the response of the peak, 35°Ccolumn temperature and 20 μL injection volume was set with flow rate of 1.2 mL per min and run time of 15 minutes10-11. Buffer used in mobile phase consist of 9.7 g of sodium phosphate in 1 liter of water. Isocratic mode of mobile phase was obtained with a combination of 700 mL of above buffer solution and 2.5 mL of 1-amino hexane as additives. Using dilute ortho-phosphoric acid, the mobile phase pH was adjusted to 2.7. Then, 80 mL acetonitrile added to the mobile phase and mixture was then further diluted to a final volume of 1000 mL with distilled water. To ensure quality of the mobile phase, it underwent an additional filtration step using a 0.45 μm filter and was then degassed through sonication.
General procedures
Preparation of Diluent
Buffer: In 700 mL of water, 6.8 grams of sodium phosphate monobasic was dissolved and 1-amino hexane (2.5 mL) was added to the solution. The pH was adjusted to 2.7 using a (10mL) dilute 85% orthophosphoric acid, and 80 mL of acetonitrile. This mixture was then further diluted to a final volume of 1000 mL with distilled water. Diluent: 600 ml of 0.1N HCl and 400 ml Buffer was mixed.
Standard Solution Preparation
In a 10 mL volumetric flask, 20 mg of dihydroquinine standard was dissolved in diluent (5 mL) under sonication and then diluted to get a 10 mL stock solution. In a 50 mL volumetric flask, 5 mL of this stock solution was diluted further using a diluent to obtain a 50 mL standard solution of 200 ppm.
Sample Solution Preparation
Accurately weighted 20 pharmaceutical tablets were crushed into a powder. In a 500 mL volumetric flask, the powder equivalent to 2000 mg of quinine sulfate was dissolved in 300 mL of diluent and flask was then subjected to 30 minutes of sonication. Following sonication, the flask was allowed to cool to RT and further diluted with diluent to reach the final volume. The resulting sample solution was then subjected to centrifugation, filtered through a 0.45 μm filter, and 5 mL of the filtered solution was subsequently diluted to a total volume of 100 mL with diluent to get 200 ppm sample solution.
Method development
A decision was made to develop a new method for analyzing a pharmaceutical product, as the existing method was found to be lacking in separating the quinine peak from Dihydroquinine. To address this issue, various experimental approaches were explored using different columns (C8 and C18) with varying dimensions, particle sizes, and lengths. A suitable mobile phase was selected, combining a buffer and acetonitrile to achieve the desired resolution between quinine and Dihydroquinine. Ultimately, the Zorbax Eclipse Plus C18 column was chosen for the analysis14. The wavelength at which the maximum absorption was observed guided the selection process, and 1.2 mL/minute flow rate was employed. It was noted that quinine eluted at 4.87 minutes, while Dihydroquinine eluted at 7.155 minutes. A typical chromatogram of dihydroquinine is given in Fig. 1 and 2.
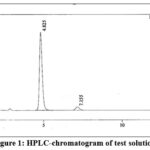 |
Figure 1: HPLC-chromatogram of test solution. |
Results and Discussion
After successful development of the method, it was decided to validate the method with the existing guidelines.
Method Validation
Analytical method validation provides assurance in the reliability and accuracy of a given analytical method, in line with the guidelines outlined by the “International Council for Harmonization (ICH) of technical requirements for pharmaceuticals for human”17.
Specificity
Specificity was performed to check the interference due to blank and placebo that may be caused by excipient at the retention of the quinine and Dihydroquinine peak in the standard or the sample solution.
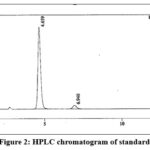 |
Figure 2: HPLC chromatogram of standard. |
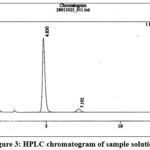 |
Figure 3: HPLC chromatogram of sample solution. |
Force degradation study
Force degradation study serves the purpose of determining the precise degradation pathways of the product or the targeted impurity. Force degradation study was conducted under various conditions, including alkali (sodium hydroxide), acid (hydrochloric acid), oxidation (30% hydrogen peroxide), thermal stress, and photodegradation, in order to comprehensively understand how the product or impurity may degrade under different environmental factors (Table 1), as this information is critical for assessing the stability and quality of the pharmaceutical product. From the result obtained it was evident that there is no observable degradation under any of the stress conditions tested (Fig. 4 to 8). This suggests that dihydroquinine is stable and pure and does not undergo significant degradation when subjected to the specified conditions.
Table 1: Degradation study of dihydroquinine.
|
Condition |
Reagent / source |
Time (h) |
% Content |
|
Alkaline |
1N NaOH |
2 |
100.4 |
|
Acidic |
1N HCl |
2 |
98.1 |
|
Oxidation |
30 % H2O2 |
2 |
100.3 |
|
Thermal |
∆, 80°C |
12 |
97.6 |
|
Photochemical |
UV light |
24 |
100.9 |
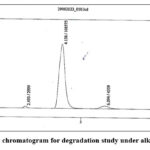 |
Figure 4: HPLC chromatogram for degradation study under alkaline conditions. |
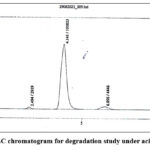 |
Figure 5: HPLC chromatogram for degradation study under acidic conditions. |
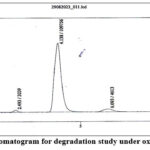 |
Figure 6: HPLC chromatogram for degradation study under oxidative environment. |
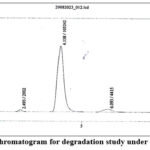 |
Figure 7: HPLC chromatogram for degradation study under thermal condition. |
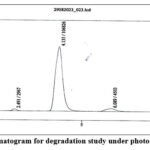 |
Figure 8: HPLC chromatogram for degradation study under photochemical environment. |
LOD and LOQ determination
Limit of Detection (LOD): Lowest detection limit was found to be 0.003 mg/mL. A reliable peak for dihydroquinine can be detected at this concentration as signal-to-noise ratio for the LOD solution was found to be above 3.
Limit of Quantification (LOQ): The lowest quantification limit was determined to be 0.01 mg/mL. At this concentration dihydroquinine can be reliably quantified as the signal-to-noise ratio for the LOQ solution was found to be above 10. Additionally, the % RSD for dihydroquinine was observed to be not more than 10%, indicating the precision and reusability of the technique within the specified concentration range.
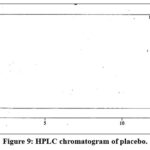 |
Figure 9: HPLC chromatogram of placebo. |
Linearity
The linearity of the protocol was evaluated by preparing linearity solutions according to the guidelines provided by the International Council for Harmonisation (ICH) for validation. These linearity solutions covered a minimum of five concentration levels, ranging from 48.47, 96.93, 116.32, 145.40, & 193.87 μg/mL for quinine sulfate (Table 2). Linearity was established by plotting a curve of serial dilution concentrations versus detector response (Fig. 10 and 11). Obtained results ensure that the analytical technique offers precise and consistent results across the specified concentration range. Interestingly it was noted that obtained results are within the limit as per specifications (Table 3).
Table 2: Linearity solution preparation serial dilution
|
Preparation of Level |
Solution taken in mL |
Final volume |
Concentration |
|
50 |
2.5 |
100 |
48.47 |
|
100 |
5.0 |
100 |
96.93 |
|
120 |
6.0 |
100 |
116.32 |
|
150 |
7.5 |
100 |
145.40 |
|
200 |
10.0 |
100 |
193.87 |
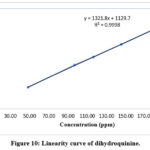 |
Figure 10: Linearity curve of dihydroquinine. |
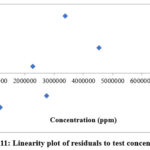 |
Figure 11: Linearity plot of residuals to test concentration. |
Table 3: Linearity data for dihydroquinine.
|
Linearity |
Observation |
Specification* |
|
coefficient of regression |
0.9998 |
> 0.998 |
|
%Y intercept |
0.86 |
≤ ± 5 % |
|
Residual sum of squares |
4043268.791 |
For information |
|
Slope |
1321.79 |
For information |
*Obtained results are within the limit as per specifications.
Accuracy
Accuracy was assessed by adding the active pharmaceutical ingredient (API) to a placebo solution. Analysis was carried out at three different levels, 50%, 100%, and 200% of the expected API concentration. The results obtained (Table 4) were within the range of 98.9% to 100.3%. This range aligns with the acceptable limit, which is set between 98% and 102%. This indicates that the method provides accurate and reliable measurements of the API content in the placebo solution.
Table 4: Recovery at different concentration levels
|
Accuracy preparation |
% Recovery of dihydroquinine |
|
50% |
98.9 |
|
100% |
100.3 |
|
200% |
99.1 |
|
Mean recovery |
99.4 |
Precision (part-A)
Precision was evaluated by preparing six separate samples, each of which was injected and analyzed using different preparations. The relative standard deviation (RSD) was calculated based on these results, and it was compared against an acceptance criterion of 2.0 % (Table 5).
Table 5: Summary of precision analysis (part-A)
|
Sample preparation |
% Content |
|
Preparation 1 |
99.7 |
|
Preparation 2 |
99.0 |
|
Preparation 3 |
101.8 |
|
Preparation 4 |
97.6 |
|
Preparation 5 |
99.1 |
|
Preparation 6 |
100.0 |
|
Mean |
99.5 |
|
% RSD |
1.4 |
Intermediate precision (part-B)
Intermediate precision was conducted to assess the reproducibility of the analytical method across different days, by utilizing separate make instruments, HPLC-grade chemicals, reagents, and different columns. The goal was to ensure that the method consistently produces results similar to those obtained in part-A of the analysis (Table 6).
Table 6: Summary of intermediate precision analysis (part-B)
|
Sample No. |
% Content |
|
Preparation 01 |
98.4 |
|
Preparation 02 |
98.7 |
|
Preparation 03 |
100.1 |
|
Preparation 04 |
98.7 |
|
Preparation 05 |
97.8 |
|
Preparation 06 |
98.9 |
|
Mean |
98.8 |
|
STD dev. |
0.75 |
|
% RSD |
0.76 |
Table 7: Compilation of precision and intermediate precision results
|
Sample Preparation |
% Assay |
|
|
Analyst-I |
Analyst-II |
|
|
1 |
99.7 |
98.4 |
|
2 |
99.0 |
98.7 |
|
3 |
101.8 |
100.1 |
|
4 |
97.6 |
98.7 |
|
5 |
99.1 |
97.8 |
|
6 |
100.0 |
98.9 |
|
Overall Mean |
99.1 |
|
|
Overall SD |
1.14 |
|
|
Overall % RSD |
1.15 |
|
The relative standard deviation (% RSD) for the dihydroquinine content, as determined from 12 different sample preparations, is 1.15%. This falls well within the specified acceptance criteria, with the limit not exceeding 2.0%. Based on these findings, it can be concluded that the method exhibits precision.
Robustness
The robustness study aids in comprehending the influence of these variations on the reliability and consistency of the method. The robustness study is intentionally conducted to assess how variations in instrument conditions, which can occur during routine analysis, might potentially lead to inaccurate results. By focusing on essential variables related to both the analytical method and the instruments used, critical parameters are chosen for this investigation. Variables such as mobile phase pH, column temperature, and flow rate are considered, as they have the potential to yield unexpected outcomes. Parameters selected for analysis are given in Table 8. The percentage relative standard deviation (% RSD) for flow rates of 1.1 and 1.3 mL/min were 0.35 % and 0.22 %, respectively. Similarly, at column temperatures of 30°C and 40°C, the % RSD values were 0.48 % and 0.30 %, respectively. Likewise, for mobile phase, the % RSD was 0.26 % at pH 2.6 and 0.20 % at pH 2.8. Notably, all these % RSD values fall well within the 2.0 % acceptance criteria (NMT 2.0 %).
Table 8: Variable parameters and results of robustness analysis.
|
Parameter |
Condition |
% RSD* |
Symmetry |
% content |
|
Flow rate |
1.1 mL/min |
0.35 |
1.25 |
100.1 |
|
1.3 mL/min |
0.22 |
1.24 |
100.4 |
|
|
Column temperature |
30°C |
0.48 |
1.14 |
100.1 |
|
40°C |
0.30 |
1.14 |
99.9 |
|
|
Mobile phase pH |
pH 2.6 |
0.26 |
1.31 |
101.5 |
|
pH 2.8 |
0.20 |
1.37 |
101.4 |
*% RSD for standard solution of dihydroquinine.
Filter Study
A filter study was performed to demonstrate the appropriateness of the filters employed for the filtration of the test sample. Both Nylon and PVDF filters with a pore size of 0.45µm were tested to ensure that they do not introduce significant bias into the measurement of dihydroquinine concentration in the assay. The criteria for acceptability were set as the % absolute difference between % content of dihydroquinine by using different filters is NMT ± 2.0. Based on the results obtained, it was determined that the 0.45µm PVDF filter is the suitable choice for this purpose (Table 9).
Table 9: Summary of filter study
|
Filter used |
Dihydroquinine |
|
|
% Content |
Absolute difference |
|
|
Centrifuge |
98.1 |
– |
|
PVDF |
99.7 |
1.7 |
|
Nylon |
99.1 |
1.0 |
Stability of analytical solutions
Solution stability was performed to verify the reliability of the analysis concerning the stability of both standard and sample solutions at RT. The investigation of stability involved analyzing identical standard and sample solutions at different time intervals.
Solution stability of standard and sample preparation
To assess the variability and stability of the standard and test solutions, both solutions were prepared and kept at ambient temperature. The analysis was conducted over a 24-hour period at various time intervals to examine their exact impact on the results (Table 10). The difference between the initial measurement and those taken at specified intervals was calculated to ensure it fell within the established limit of less than 5.0%. This process was designed to determine the impact of time on the stability of the solutions and the accuracy of the results.
Table 10: Summary of standard solution stability.
|
Standard peak area response under solution stability |
||
|
Time interval (h) |
% difference from initial |
% Difference |
|
0 |
100.00 |
– |
|
2 |
98.18 |
1.82 |
|
5 |
100.76 |
0.76 |
|
7 |
96.22 |
3.78 |
|
10 |
96.09 |
3.91 |
|
15 |
96.37 |
3.63 |
|
22 |
95.38 |
4.62 |
Table 11: Summary of sample solution stability.
|
Sample peak area response under solution stability |
||
|
Time interval (h) |
% Assay |
% Absolute difference |
|
0 |
99.7 |
– |
|
3 |
103.6 |
3.9 |
|
6 |
97.4 |
2.3 |
|
10 |
97.4 |
2.3 |
|
15 |
96.7 |
3.0 |
|
20 |
98.9 |
0.9 |
|
37 |
97.4 |
2.4 |
The response of the standard and sample solutions for dihydroquinine remains stable for up to 22 hours and 37 hours, respectively. These stability findings were well within the specified acceptance criteria of ± 5.0% with respect to the initial values. Thus, in light of the results obtained, it would be relevant to employ the aforementioned method for both regular and stability studies conducted in the pharmaceutical industry.
Conclusion
In summary, the present study describes an efficient, rapid, linear, and highly precise reverse-phase high-performance liquid chromatography (RP-HPLC) analytical approach to estimate dihydroquinine in quinine sulphate pharmaceutical dosage form. This method is designed to accurately measure dihydroquinine content in quinine sulfate pharmaceutical tablets. This new method has been validated in compliance with current regulatory guidelines and has efficaciously met specified criteria. The proposed technique is simple and easy to adopt for routine sample analysis, providing both precision and accuracy; hence it would be beneficial for both regular sample analysis and stability studies conducted in the pharmaceutical industry.
Acknowledgment
Authors are thankful to Principal, D.G. Ruparel College, Mahim, Mumbai for the laboratory facilities.
Conflict of interest
The authors report there are no competing interests to declare.
Funding Sources
There is no funding sources.
References
- Strauch, S.; Dressman, B. D.; Shah, V. P.; Kopp, S.; Polli, J. E.; Barends D. M. J. Pharm. Sci. 2012, 101, 2271–2280.
CrossRef - Shen, S.; Liu, J. Open Access Library Journal. 2019, 06, 1–8.
- Maier, A. G.; Matuschewski, K.; Zhang, M.; Rug, M. Trends Parasitol. 2019, 35, 481–482.
CrossRef - Man-Son-Hing, M.; Wells, G.; Lau, A. J. Gen. Intern. Med. 1998, 13, 600–606.
CrossRef - Achan, J.; Talisuna, A. O.; Erhart, A.; Yeka, A.; Tibenderana, J. K.; Baliraine, F. N.; Rosenthal, P. J.; D’Alessandro, U. Quinine, an old anti-malarial drug in a modern world: role in the treatment of malaria. Malaria Journal, 2011, 2 10, 144.
CrossRef - Ring, J.; Blaser, K.; Capron, M.; Denburg, J. A.; Holgate, S. T.; Marone, G.; Saito, H. Chemical Immunology and Allergy, 2002, Johannes Ring Munich Monique Capron Lille.
- Antika, L. D., Triana, D. & Ernawati, T. IOP Conf. Ser. Earth Environ. Sci. 2020, 462, 1-9.
CrossRef - Yeboah, E. M. O.; Yeboah, S. O; Singh, G. S. Tetrahedron. 2011, 67, 1725–1762.
CrossRef - White, P. D.; Marvin, H. M.; Burwell, C. S.; Boston medical and surgical journal. 1991, 185, 648-650.
- Kline, B. J.; Turner, V. A.; Barr, W. H. Anal. Chem. 1979, 51, 449–451.
CrossRef - Luchi, R.J.; Helwig, J.; Conn, H. L. Am. Heart. 1992, 65, 340–34.
CrossRef - Malhi, N.; Cheung, C. C.; Deif, B.; Roberts, J. D.; Gula, L. J.; Green, M. S.; Pang, B.; Sultan, O.; Konieczny, K. M.; Angaran, P.; Dorian, P.; Lashevsky, I.; Healey, J. S.; Alak, A.; Tadros, R.; Andorin, A.; Steinberg, C.; Ayala-Paredes, F.; Simpson, C. S.; Atallah, J.; Krahn, A. D. JACC Clin. Electrophysiol. 2019, 5, 376–382.
CrossRef - Snyder, L. R.; Kirkland, J. J.; Dolan J. W. Introduction to modern liquid chromatography, 3rd ed. Anal. Bioanal. Chem. 2011, 399, 1809–1810.
CrossRef - Snyder, L. R.; Kirkland, J. J.; Glajch, J. L. Practical HPLC Method Development. 2nd ed. Anal. Chem. 1992, 64.
CrossRef - Gilroy, J. J.; Dolan, J. W.; Snyder, L. R. Column selectivity in reversed-phase liquid chromatography: IV. Type-B alkyl-silica columns. J. Chromatogr. A, 2003, 1000, 757–778.
CrossRef - Snyder, L. R.; Dolan, J. W. Milestones in the Development of Liquid Chromatography. Liquid Chromatography: Fundamentals and Instrumentation (Elsevier Inc., 2013). doi:10.1016/B978-0-12-415807-8.00001-8.
CrossRef - Borman, P.; Elder, D. Validation of Analytical procedures. ICH Quality Guidelines, 2018, 2, 127–166.
CrossRef - Akhlaq, M.; Khan, G. M.; Wahab, A.; Khan, A.; Hussain, A.; Nawaz, A.; Abdelkader, H. J. Adv. Pharm. Technol. Res. 2011,2, 151.
CrossRef - Habyalimana, V.; Mbinze, J. K.; Yemoa, A. L.; Ntokamunda, Justin-Léonard K.; Hubert, P.; Djang’eing’a, R. M. Am. J. Anal. Chem. 2017, 08, 582–603.
CrossRef - Sahoo, N. K.; Ramya, G.; Harini, D.; Padhiary, T. K. 2021, 1, 1–17.
- Narikimalli, A.; Galla, R. Futur. J. Pharm. Sci. 2023, 9, 55, 1-12.
CrossRef - Babu, N. P.; Ramachandran, D.; Geetha Bhavani, K. Curr. Trends Biotechnol. Pharm. 2021, 15, 51–61.
CrossRef - Trivedi, R. K.; Patel, M. C. Sci. Pharm. 2011, 79, 97–111.
CrossRef - Jeadkong, S.; Sawatdee, S.; Atipairin. A. Research Journal of Pharmacy and Technology, 2017, 10 (6), 1603-1610. doi: http://dx.doi.org/10.5958/0974-360X.2017.00282.7
CrossRef - Bekoe, S. O.; Orman, E.; Adjabui, S. A.; Brobbey, A. A.; Oppong-Kyekyeku, J.; Opuni, K. F.; Kuntworbe, N.; Asare-Nkansah, S. Journal of Chemistry, 2022, 1-11. doi: https://doi.org/10.1155/2022/4625954
CrossRef - Namegabe, L.M.; Kadhesi, M.T.; Hamuli, P.M.; Mahano, A.O.; Brioen, P. American Journal of Analytical Chemistry, 2019, 10, 415-422. https://doi.org/10.4236/ajac.2019.109029
CrossRef - Sarr, S. O.; Fall, D.; Ndiaye, S. M.; Diedhiou, A.; Diop, A.; Ndiaye, B.; Diop, Y. M. Int. J. Biol. Chem. Sci. 2013, 7 (1), 366-376. http://ajol.info/index.php/ijbcs
CrossRef - Iurchenko, I.; Blazheyevskiy, M.; Koretnik, O.; Shlusar, O. International Journal of Scholarly Research in Chemistry and Pharmacy, 2023, 3 (2), 1–12. doi: https://doi.org/10.56781/ijsrcp.2023.3.2.0030
CrossRef

This work is licensed under a Creative Commons Attribution 4.0 International License.
About The Author
![]()
A New Edition of Web of Science
Journal Impact Factor
2022: 0.5
Five Year: 0.8
Journal is Indexed in

Cabells Whitelist
![]()


