Quantification of Marker Compound by HPTLC-Densitometry Method and Assessment of Anti-inflammatory Activity of Root-bark Extract of Berberis aristata with Molecular Docking by COX-1 and COX-2
Alankar Shrivastav1,2* , Arun Kumar Mishra2, Ashessh Kumar Gupta1
1Department of Pharmacology, School of Pharmaceutical Sciences, IFTM University, Moradabad, Uttar Pradesh, India.
2Advanced Phytochemistry laboratory, Pharmacy Academy, IFTM University, Moradabad, Uttar Pradesh, India.
Corresponding Author E-mail: 2ndct.as@gmail.com
DOI : http://dx.doi.org/10.13005/ojc/380210
Download this article as:
![]()
Berberis aristata commonly known as Daruhaldi, which is traditionally used in the various treatment such as inflammation, irritation, wound and other skin aliments. During the tribal time period, Indian people were use the crused from of root-bark directly on infected parts of skin. Most of the people used the matured root bark in crused form and directly apply a thick paste on the inflammated surface. In this investigation, quantify the important marker compound (Berberine and Tetrahydropalmatine) by the HPTLC-densitometry method and further evaluate the anti-inflammatory activity of EEBA and also done the molecular docking, which was done by using Auto-Dock software. Croton oil induced ear oedema and carrageenan induced paw oedema model was used to evaluate the anti-inflammatory efficacy. Auto-Dock software was used to determine the molecular mechanism. The finding of the HPTLC-densitometry validated method revealed that the RSD for interday (0.113-0.343 and 0.116-0.342) and intraday (0.101-0.304 and 0.105-0.296) are as per ICH guidelines. The pharmacological evaluation of anti-inflammatory activity revealed a significant reduction of oedema when using 4% formulation. On behlf of molecular docking berberine and tetrahydropalmatine inhibit the of COX-1 and COX 2 levels. It was concluded that the application of the extract in animals to be used as an anti-inflammatory agent for topical formulations and the phytoconstituent have potentcy to inhibit the effect of COX-1 & 2.
KEYWORDS:Acute toxicity study; Berberis aristata; Ethanolic extract of Berberis aristata (EEBA); Sub-Acute Toxicity Study
Introduction
Plants are alternative pharmaceuticals for the treatment of a variety of illnesses due to their widespread acceptance, effectiveness, affordability, safety, and low cost 1. A growth in public consumption of herbal formulations has also occurred, owing to a strong perception that these products are natural and hence safe for the treatment of a range of ailments 2. Berberine, isoberberine, palmatine, and tetrahydropalmatine may all be found in Berberis aristata‘s root bark. Quercetin, Rutin, and Isoquercetin have all been found in its flowers and leaves. According to various studies 3 berberine and palmatine are key phytochemicals implicated in the reduction of inflammation.
As the known phytoconstituents are important and accountable for various activities, therefore the quantification of such marker compounds in the extract is to be done by analytical technique HPTLC. NSAIDs are widely used to treat inflammation, discomfort, and fever, as well as to protect the heart. However, they are frequently associated with serious adverse effects such as stomach ulcers, renal damage, bronchospasm, and cardiac problems, which restrict their usage. Natural-source drugs are a major source of therapy for numerous ailments across the world 4. One of the most effective and rational tactics in the hunt for novel medications is to investigate and analyse plants used as pain relievers and antiinflammatory compounds in traditional ethnomedicine. Berberis root barks are a plant that grows profusely in the hills. It is used as an anti-inflammatory and fever cure in traditional medicine systems in India, China, Nigeria, and other African nations. The root barks and twining stem are used to alleviate inflammation and fever. To cure rheumatic pain, toothaches, and eye infections, a decoction of the plant’s root and leaves is consumed orally or applied topically 5. Apart from these observations, no further pharmacological effects of this herb connected to its traditional usage for anti-inflammatory activity have been recorded to our knowledge 6. After the detailed literature survey, we concluded that there is no scientific literature available on the quantification of phytochemicals (viz Berberine and Tetrahydropalmetine) by HPTLC-densitometry method. Considering the traditional claim of this plant in ancient books as an anti-inflammatory agent, scientific animal models were used to evaluate the anti-inflammatory activity after quantification of important phytochemicals (viz Berberine and Tetrahydropalmetine) by HPTLC densiometeric method.
Material and methods
Materials
Fresh part of Berberis aristate were collected from the Pauri Garhwal region of Uttarakhand, Dist. Ghansali, India in the month of march 2021. Root bark parts of Berberis aristata were clean and dried under shade. For the authenticity, the sample were sent to the Scientist incharge, Botanical Survey of India, Allahabad (U.P.). The sample was authenticated and a Speciemen no was issued: 104540.
Preparation of root bark extract
Firstly, the root-bark of Berberis aristata was crushed by the help of a grinder until a coarse powder were obtained. Then the powder was passed through sieve no 18. Then the powder were extracted by using solvents like petroleum ether and ethanol usind Soxhlet apparatus. Afterthat the extact was concentrated on a waterbath unitll the dried mass is obtained. The extact were stored in the refrigeraotor at a temperature 2-8°C 7.
TLC chromatography
TLC plates size about 20 x 20 cm, which is precoated with the silica 60G (Sigma-Aldrich) using on glass slide for the support (thickness about 0.2 mm). Glass was utilised as the column. Nanomat 4 (CAMAG) has been used as spotting equipment for the accuracy. 10 µl microsyringe used in that procedure. Solvent chamber cover with a glass cover was employed and the scan was performed by using Camag TLC scanner 8.
TLC: Solvent System development for HPTLC
The number of attemts ware made to select the correct solvent system for the ethanolic extract to get a clear and maximum numbers of spot. The best result was obtained in the solvent system with the ratio butanol: ethyl acetate: formic acid: water (3:1.5:0.5:1.5, v/v) 9.
Quantification of Berberine and Tetrahydropalmatine using HPTLC
Sample solution and Preparation of standard solution of Berberine and Tetrahydropalmatine
1 g of extract was dissolved in ethanol to make an ethanolic extract sample solution for HPTLC 10. Berberine and Tetrahydropalmatine stock solutions (500 g/ml) were prepared in methanol and put to a TLC plate in different concentrations (10, 20, and 30 ng/spot). After the preparation of stock solution, 1, 2, 3, 4, and 5 ml were taken form stock solution separately and make up the volume upto 10ml in a volumetric flask to generate standard solutions, containing varying concentrations of Berberine and Tetrahydropalmatine (10ng/spot – 50ng/spot) 11.s
Preparation of calibration curve of Berberine and Tetrahydropalmetine
On a TLC plate, 5μl of Berberine and Tetrahydropalmatine standard solutions (10, 20, 30, 40, and 50 ng/spot) were apply in triplicate using the conditions (bandwidth: 5 mm). After the preparatioin of the plates, the plates were placed in developing solvent system chamber. Then the plates were dried under the air at RT. Anisaldehyde sulfuric acid reagent spay were used for the visualizing the spots, and the scan was done by using the UV light at 366nm in absorbance mode 12.
Quantification of marker compound in the sample
On a TLC plate, 5μl of sample solution was applied in triplicate manner. The plates were developed and scanned. The peak regions were measured and the amounts of Berberine and Tetrahydropalmatine estimated 13.
Method Validation
The approach was tested for precision, accuracy, and repeatability (ICH guideline, 1996-2005). The accuracy of the method was investigated by assessing standards in concentrations of 10, 20, and 30 ng/spot on the same day and on separate days using the same analytical approach and lab conditions (inter day precision). The percentage RSD was used to express the results. The method’s accuracy was assessed by conducting recovery tests on the pre-analysed sample with the standard at three levels, calculating percentage recovery and average percentage recovery 14-15.
Animals
The Institutional Animal House of IFTM University, Moradabad, provided healthy adult Wistar rats (250-300 grams). The animals were kept in polypropylene cages at a RT, with a relative humidity (60–70%). During the study, all the animals had free access of water and pellet meal. IAEC of IFTM University, Moradabad approved the experimental protocol with a reference no. CPCSEA (2017/837ac/Ph.D)).
Preparation of formulations of EETP
To test anti-inflammatory effects, a semisolid (ointment) formulation was made up of following formula:
|
Expicients |
Concentration (%w/w) |
|
Stearic acid |
15 |
|
White Wax |
2 |
|
Yellow Vaseline |
8 |
|
Triethanolamine |
1 |
|
Propylene glycol |
8 |
|
Purified water |
q.s. to 100g |
The four formulations were Formulated such as placebo (only ointment base) and ointment base containing 1%, 2%, and 4 % (w/w) EEBA. All formulations were kept at a temperature of 8°C after they were prepared 16.
Croton oil-induced ear oedema
The study was carried out using the previously stated approach with a few modifications. In this study, 2.5% v/v croton oil was topically applied on the inner surface of rats ear to produce oedema and another ear were topically treated with acetone considered as reference. 30 minutes after the application of croton oil, oedema induced. A fixed dose 20mg/ear of formulation conatinging EEBA was topically administed for the treated group and equal quantity of dexamethasone cream (1 mg/g) used as a standard group animals, while the control group recivied 20mg/ear placebo ointment. Each formularion use by the help of a cotton swab, each application was completed utilising fix motions of 25 frictions. The animals were terminated after six hours, and a 6mm diameter sample of both ears was taken with the use of a dermatological scapers. Induced oedema was assessed by observing the weight difference between the right (inflamed) and left (control) ear 17-18.
Carrageenan induced paw oedema
With slight adjustments, the test followed prior work published in the literature. The animals (n=6) were given a sub-plantar injection of α-carrageenan (500 µg/paw in 0.5ml of PBS) in the next right hind paw. As a healthy control, the left paw was utilised. The therapy was carried out using the same dosages as in the previous trial. A digital calliper was used to measure the thickness of the paws before, during, and after the injection of the inflammatory agent at 1, 2, 3, and 4 hours. The oedema was measured as the difference in paw thickness between before (baseline) and after (at the relevant periods of measurement) the injection of carrageenan 19.
Molecular Docking
Ligand-Protein docking studies of Berberine & Tetrahydropalmatine were performed with Cyclooxygenase-1 (COX1) and Cyclooxygenase-2 (COX2) 3D structures of designed compounds were simulated into the 3D structure of COX1 and COX2. 3D structures of ligands and proteins were processed with ‘.pdb’ files.
Protein structure preparation
Crystal structure of proteins were collected from protein data bank COX1 (PDB: 6y3c) and COX2 (PDB: 5f19). Files were downloaded in PDB format. Protein files were prepared for docking studies. Preparation was performed by removal of non-protein contents from PDB file, followed by satisfying valency by adding hydrogen. Chain-A of whole protein structure was considered for docking 20.
Statistical analysis
The results of anti-inflammatory and other data were presented as Mean±SEM. All the data of the results were expressed as Mean±SEM (n=6) and analysis was done by one way ANOVA followed by Tukey’s Test, *P<0.05, **P<0.005, ***P<0.005 as compared to control groups animals.
Result
TLC Densitometric Quantification of Berberine and Tetrahydropalmatine using HPTLC
No one can report the Berberine and Tetrahydropalmatine quantification in root-bark of B. aristata by HPTLC till now. These two major phytoconstituents are well-known for their anti-inflammatory properties. As a result, we devised a straightforward and exact method for determining the marker compound’s concentration. To quantify these marker chemicals in an ethanolic extract of B. aristata, the TLC process was refined. The mobile phase of Butanol: Formic acid: Ethyl acetate: Water (3:0.5:1.5:1.5, v/v) produced crisper, sharper, and more well-defined peak resolution. With the use of a chromatogram of the marker chemicals, the spots at Rf = 0.74 and 0.44 were identified as Berberine and Tetrahydropalmatine, respectively (Fig 1). The peak or band of berberine and tetrahydropalmatine in the root bark sample of Berberis aristate, which was confirmed by the standard chromatogram obtained from the berberine and tetrahydropalmatine marker solution [Figure 4 and 5] and by comparing the rf value of Berberine and Tetrahydropalmatine from the sample and standard solution. The peak from the sample solution corresponding to Berberine and Tetrahydropalmatine exhibited the same retention factor as the Berberine and Tetrahydropalmatine standard (Rf = 0.74 and 0.44). (Table 1 and Figure 1).
The precision, reproducibility, LOD, LOQ and accuracy of the TLC densitometric approach have all been proven (Tables 2, 3 and 4). Figures 4 and 5 demonstrate the linearity ranges for Berberine and Tetrahydropalmatine, as well as the correlation coefficient, intercept, and parameters.
Method Validation Parameters for Quantification of Berberine and Tetrahydropalmatine by using Proposed HPTLC Densitometric Method
The results of the recovery studies, which are given in Table 4, were within acceptable bounds, demonstrating that the procedure was accurate. The method’s robustness was demonstrated by the low %RSD value (between the peak area values), demonstrating that Berberine and Tetrahydropalmatine are stable during the extraction operation as well as during analysis. Berberine and tetrahydropalmatine concentrations in B. aristata root bark were discovered to be 0.50 % w/w using TLC densitometric techniques.
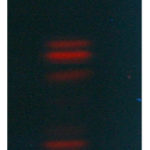 |
Figure 1: under 366 nm |
Table 1: TLC fingerprinting profile of Berberis aristata root bark extract under UV 366nm.
|
S. No. |
Rf Value |
Colour of the band |
|
1. |
0.04 |
Dull red |
|
2. |
0.01 |
Light red |
|
3. |
0.13 |
Light red |
|
4. |
0.23 |
Light Orange |
|
5. |
0.44 |
Orange |
|
6. |
0.52 |
Blackly-Orange |
|
7. |
0.75 |
Dull red |
|
8. |
0.74 |
Light Orange |
Table 2: Validation parameters for Quantifaction
|
S. No. |
Rf value |
Berberine |
Tetrahydropalmatine |
|
1. |
Repeatability |
0.58 |
0.26 |
|
2. |
Mean Recovery (Accuracy) % |
99.37 |
99.94 |
|
3. |
LOD (Limit of Detection in ng) |
1.13 |
1.54 |
|
4. |
LOQ (Limit of quantification in ng) |
3.45 |
4.67 |
|
5. |
Specificity |
0.342 |
0.330 |
|
6. |
Co-relation coefficient (Linearity) |
0.999 |
0.999 |
|
7. |
Range (ng/ml) |
10-50 |
10-50 |
Table 3: Precision data of Berberine and Tetrahydropalmatine by proposed TLC densitometric method.
|
Concentration (ng/ml) |
Berberine |
Tetrahydropalmatine |
||
|
Inter-day precision (n=3) |
Intra-day precision (n=3) |
Inter-day precision (n=3) |
Intra-day precision (n=3) |
|
|
Peak area (mean±S.D.) |
Peak area (mean±S.D.) |
Peak area (mean±S.D.) |
Peak area (mean±S.D.) |
|
|
10 |
0.113±0.006 |
0.116±0.007 |
0.101±0.002 |
0.105±0.002 |
|
20 |
0.228±0.035 |
0.301±0.004 |
0.202±0.004 |
0.201±0.005 |
|
30 |
0.343±0.005 |
0.342±0.009 |
0.304±0.003 |
0.296±0.007 |
TLC- thin layer chromatography; S.D.- Standard deviation
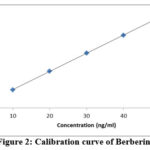 |
Figure 2: Calibration curve of Berberine |
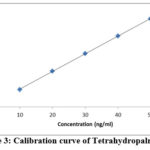 |
Figure 3: Calibration curve of Tetrahydropalmatine |
Table 4: Result of recovery of Berberine and Tetrahydropalmatine with standard addition at 50%, 100% and 125%.
|
Marker compound |
Marker quantity present (ng) |
Quantity of marker added (ng) |
Quantity of marker found (ng) mean ± SEM |
Recovery (%) mean ± SEM |
Average recovery (%) |
|
Berberine |
40 |
20 |
59.41±0.91 |
97.05±0.99 |
99.37 |
|
40 |
40 |
80.65±1.23 |
101.62±1.33 |
||
|
40 |
50 |
89.73±1.59 |
99.46±0.89 |
||
|
Tetrahydropalmatine |
40 |
20 |
59.74±0.91 |
98.70±0.44 |
99.94 |
|
40 |
40 |
79.92±1.26 |
99.80±0.33 |
||
|
40 |
50 |
90.66±1.19 |
101.32±0.69 |
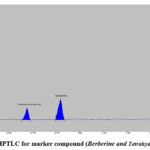 |
Figure 5: Chromatogram of Berberis aristata root bark extract |
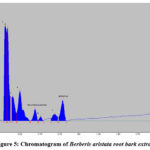 |
Figure 5: Chromatogram of Berberis aristata root bark extract |
Croton oil-induced ear oedema
As can be seen in the placebo group, topical treatment of Croton oil induced an increase in the weight of the animals’ ears due to the development of oedema. When compared to the placebo, the formulations containing three strengths of Berberis aristata root bark extract (1, 2 and 4%) considerably reduced edoema. Dexamethasone, a common anti-inflammatory drug, had a % inhibition of 64.87±7.32%, whereas Berberis aristata concentrations of 1%, 2%, and 4% showed percentages of edoema reduction of 48.09 ±18.13%, 53.41±8.13%, and 61.39±3.13% respectively, which were statistically different from the placebo (Table 5).
Table 5: Effect of Formulation containing EEBA on the ear oedema incuded by croton oil
|
Sr. No. |
Groups |
Percentage inhibition (%) |
|
1. |
Dexamethasone 1 mg/kg |
64.87± 7.32** |
|
2. |
Control (Placebo) |
0.00 |
|
3. |
Berberis aristata 1% |
48.09± 18.13 |
|
4. |
Berberis aristata 2% |
53.41± 8.13* |
|
5. |
Berberis aristata 4% |
61.39± 3.13** |
Carrageenan induced paw oedema
After the injecting of carrageenan, the thickness of the paws of the rats is increases in blank (placebo) during the 4 h of study. The formulation which containing the EEBA in a concentration of 2% shows a slight significant result in the anti-inflammatory effect, they slightly reduced the inflammation in paws of animals but when we seen the 4% formulation, they show better effect which was similar to the standard group, which was more significant result in decrease of oedema in the duration time 4 h. Dexamethasone used as the standard drug had a % inhibition of 50.84 ± 6.09% compared to the placebo. The better effect of formulation containing 4% of the Berberis aristata extract decreased oedema significantly (43.39 ± 5.13%) as compared to the placebo (Table 6).
Table 6: Effect of Formulation containing EEBA on the paw oedema induced by carrageenan.
|
Sr. No. |
Groups |
Percentage inhibition (%) – AUC 0-4 h |
|
1. |
Dexamethasone 1 mg/kg |
50.84± 6.09*** |
|
2. |
Contol (Placebo) |
0.00 |
|
3. |
Berberis aristata 1% |
8.09± 1.3 |
|
4. |
Berberis aristata 2% |
29.41± 2.13* |
|
5. |
Berberis aristata 4% |
43.39± 5.13** |
Docking Analysis
In present study, the ligand compounds (Berberine & Tetrahydropalmatine) were simulated to be docked at chain-A of COX1 (PDB: 6y3c) and COX2 (PDB: 5f19). The blind docking studies were performed i.e. ligands were made free to search their binding site as well as binding pose, without biasing with binding pocket. Each docking simulation was resulted into 09 poses. The comparative binding energy profiles of each ligand against targets were shown in plots (Figure 6, 7; Table 7). The best docked pose was picked to visualise molecular interaction. Docked compounds were found in hydrophobic area of their binding site. Detail of each docked complex is described as:
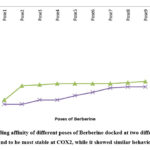 |
Figure 6: Binding affinity of different poses of Berberine docked at two different proteins. Ligand was found to be most stable at COX2, while it showed similar behaviour with COX1. |
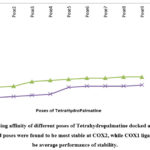 |
Figure 7: Binding affinity of different poses of Tetrahydropalmatine docked at two different proteins. Ligand poses were found to be most stable at COX2, while COX1 ligand was found to be average performance of stability. |
Table 7: Binding affinity of docked compounds Berberine and Tetrahydropalmatine with two proteins COX1 and COX2. Most stable interaction was observed between Berberine vs COX2 and ligands showed similar interaction performance with COX1.
|
Ligand |
Protein |
Binding affinity (kcal/mol) of best docked pose |
|
Berberine |
COX1 |
-8.6 |
|
Berberine |
COX2 |
-9.0 |
|
Tetrahydropalmatine |
COX1 |
-7.3 |
|
Tetrahydropalmatine |
COX2 |
-8.2 |
Berberine with COX1
Molecular interaction between Berberine and COX1 showed binding affinity of -8.6 kcal/mol. It interacted with GLN & PHE with hydrophobic interaction, GLN & THR with H-bond (Table 8). No strong non-polar interaction was observed between Berberine & COX1.
Table 8: Interaction between COX1 and Berberine
|
Hydrophobic Interactions |
Hydrogen Bonds |
|||||||
|
Index |
Residue |
AA |
Distance |
Index |
Residue |
AA |
Distance H-A |
Distance D-A |
|
1 |
203A |
GLN |
3.47 |
1 |
203A |
GLN |
3.40 |
3.74 |
|
2 |
203A |
GLN |
3.47 |
2 |
203A |
THR |
3.24 |
3.82 |
|
3 |
210A |
PHE |
3.48 |
|||||
Tetrahydropalmatine with COX1
Molecular interaction between Tetrahydropalmatine and COX1 showed binding affinity of -7.3 kcal/mol. H-bonds were observed with CYS & GLN; while TYR, ASP & PRO were found to be interacted with hydrophobic interaction (Figure 8 & 9; Table 9).
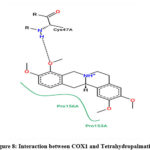 |
Figure 8: Interaction between COX1 and Tetrahydropalmatine |
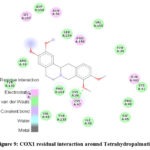 |
Figure 9: COX1 residual interaction around Tetrahydropalmatine |
Table 9: Interaction between COX1 and Tetrahydropalmatine.
|
Hydrophobic Interactions |
Hydrogen Bonds |
|||||||
|
Index |
Residue |
AA |
Distance |
Index |
Residue |
AA |
Distance H-A |
Distance D-A |
|
1 |
39A |
TYR |
3.91 |
1 |
47A |
CYS |
2.01 |
2.95 |
|
2 |
135A |
ASP |
3.66 |
2 |
461A |
GLN |
2.95 |
3.80 |
|
3 |
153A |
PRO |
3.60 |
|||||
Berberine with COX2
Molecular interaction between Berberine and COX2 showed binding affinity of -9.0 kcal/mol. Hydrophobic interactions were found with PRO; while H-bonds were found with HIS & GLN (Figure 10 & 11; Table 10).
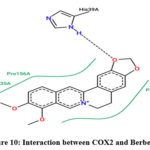 |
Figure 10: Interaction between COX2 and Berberine |
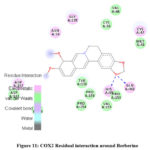 |
Figure 11: COX2 Residual interaction around Berberine. |
Table 10: Interaction between COX2 and Berberine
|
Hydrophobic Interactions |
Hydrogen Bonds |
|||||||
|
Index |
Residue |
AA |
Distance |
Index |
Residue |
AA |
Distance H-A |
Distance D-A |
|
1 |
153A |
PRO |
3.84 |
1 |
39A |
HIS |
1.88 |
2.81 |
|
2 |
154A |
PRO |
3.89 |
2 |
461A |
GLN |
2.49 |
3.05 |
|
3 |
156A |
PRO |
3.61 |
|||||
Tetrahydropalmatine with COX2
Molecular interaction between Tetrahydropalmatine and COX2 showed binding affinity of -8.2 kcal/mol. Hydrophobic interactions were observed with ARG, VAL & ALA; while H-bond were found with ARG (Figure 12 & 13; Table 11).
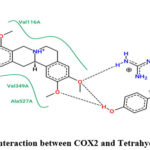 |
Figure 12: Interaction between COX2 and Tetrahydropalmatine. |
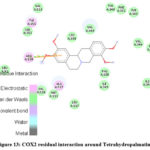 |
Figure 13: COX2 residual interaction around Tetrahydropalmatine |
Table 11: Interaction between COX2 and Tetrahydropalmatine.
|
Hydrophobic Interactions |
Hydrogen Bonds |
|||||||
|
Index |
Residue |
AA |
Distance |
Index |
Residue |
AA |
Distance H-A |
Distance D-A |
|
1 |
120A |
ARG |
3.97 |
1 |
120A |
ARG |
2.78 |
2.58 |
|
2 |
349A |
VAL |
3.69 |
2 |
120A |
ARG |
1.91 |
2.93 |
|
3 |
349A |
VAL |
3.78 |
|||||
|
4 |
527A |
ALA |
3.73 |
|||||
Discussion
Traditional medicine quality evaluation and species authentication have been demonstrated to be a sensible and practicable process using chromatographic fingerprint analysis (21). It employs chromatographic methods to create particular identification patterns for herbal medications. The created component fingerprint pattern may subsequently be utilised to assess not only the presence or absence of interest markers, but also the ratio of all detected analytes (22-23).
Berberine and Tetrahydropalmatine contained in the root bark of Berberis aristata have been quantified using an HPTLC technique that has been devised and verified. The approach utilised in this study produced good peak shape and allowed for good separation of Berberine and Tetrahydropalmatine from other plant elements. There was no interference with the Berberine and Tetrahydropalmatine peak from other elements present in the plant since recovery was close to 100% (24-26). Figure 2 shows HPTLC pictures that show all sample components were separated without tailing or diffuseness. The amount of active principle contained in a plant extract has always an impact on its activity (27-28).
The usual medicine, dexamethasone, is a synthetic glucocorticoid with anti-inflammatory and immunosuppressive effects. In both the croton oil induction model and the carrageenan induction model, the results demonstrate that formulations including the two plants can decrease oedema (29-30). The major characteristic of the ear oedema model is the chronic inflammatory response. The biphasic nature of the carrageenan-induced paw oedema model and the croton oil-induced ear oedema paradigm suggests that the Berberis aristata extract can suppress the inflammatory mediators generated during either phase. As a result, Berberis aristata was shown to have anti-inflammatory properties. The presence of Berberine and Tetrahydropalmatine may be directly linked to the anti-inflammatory activity. These phytoconstituents are classified as natural flavonoids, and both have been shown to have antioxidant and anti-inflammatory properties by inhibiting the free release of inflammation mediators such as IL-9 and PGs. Suppression of inflammatory mediator release and inhibition of PGs might be the mechanisms behind Berberis aristata extract’s powerful anti-inflammatory action.
The anti-inflammatory efficacy of Berberis aristata extract (4 % w/w) formulation was demonstrated in animal models to be safe and effective in the decrease of inflammation (in Croton oil-induced ear oedema mode and Carrageenan induced paw oedema, animal model). It was discovered that this plant might be used as an anti-inflammatory agent on a large scale. Both berberine and tetrahydropalmatine were docked in COX-1/2 via molecular docking. Both substances were shown to be COX-1/2 inhibitors. Among these, the substance berberine showed significant COX-2 inhibitory action as well as a selectivity index that was comparable to that of other conventional preparations (31). The findings point to a mechanism of anti-inflammatory action that has previously been proven in a research. For the most part, a robust link between COX inhibition and anti-inflammatory activity has been shown. According to molecular docking studies, the most active chemicals, berberine and tetrahydropalmatine, may be positioned into the active sites of COX-1/2 in the same subdomain as normal. We described the discovery of a selective COX-2 inhibitor in this paper, which will be subjected to additional computationally aided structural modification to increase its potency and selectivity. All the molecular interaction and hydrophobic area of their binding pose are describe in table and figure.
Conclusions
Berberine and Tetrahydropalmatine were separated and quantified for the first time from ethanolic extract of Berberis aristata. Root bark. An HPTLC densitometric method for the quantification of Berberine and Tetrahydropalmatine from Berberis aristata root bark was established.
The findings of anti-inflammatory activity by the two animal models confirmed the fact that formulation of Berberis aristata (4%) in form of ointment is safe and significantly effective in the reduction of inflammation when comparison was made with control and analysed by one-way ANOVA (Tukey’s post-test). Findings confirmed that due to the presence of Berberine and Tetrahydropalmatine in Berberis aristata root bark and its nontoxic nature along with the anti-inflammatory response, the plant may be used to develop anti-inflammatory formulation which may further be subjected to clinical trial study. On the basis molecular docking study, the analysis reveled better understanding about the intraction between lingands and enzyme active sites in detail. The molecular docking were carried out for both the compound on behalf on COX-1 and COX-2 enzymes. Therefore the isolated compounds berberine and tetrahydropalmatine showed potent binding score, whereas it exhibited the COX-2 inhibitory activity, which are further attributed to the in anti-inflammatory activity of these compounds.
Acknowledgment
The Authors are thankful to Management of IFTM University, Moradabad for the motivation and facilities provided to conduct this work.
Conflict of Interest
There is no conflict of interest.
Funding Sources
There is no funding source.
Reference
- Arya, A.; Mahmood, A.A.; Batoul, S.H.; Mustafa, A.M. Eur. J. Med. 2012, 9(3), 1196-205.
- Said, O.; Khalil, K.; Fulder, S.; Azaizeh, H. J. Ethnopharmacol. 2002, 83, 251-6.
CrossRef - Abou-Arab, A.A.; Abou D.M.A. J. Agric. Food Chem. 2000, 48(6), 2300-4.
CrossRef - Thanaboripat, D.; Suvathi, Y.; Srilohasin, P.; Sripakdee, S.; Patthanawanitchai, O.; Charoensettasilp, S. In J Sci Tech. 2007, 7, 1-7.
- Kneifel, W.; Czech, E.; Kopp, B.; Planta Med. 2002, 68(1), 5-15.
CrossRef - Pushpa, L.B.; Rama, M.R.L.; Mannur, I.S.; Vijaya, T. Asian J. Exp. Biol. Sci. 2010, 1(4), 719-27.
- Smart, D.J.; Ahmedi, K.P.; Harvey, J.S.; Lynch, A.M. Mutat Res. 2011, 715(1-2), 25-31.
CrossRef - Yousfi, F.; Abrigach, F.; Petrovic J.D.; Sokovic, M.; Ramdani, M. S. Afr. J. Bot. 2021, 142, 433-440.
CrossRef - Asante, D.K., Springer Sci. & Bus. Media. 2002, 6.
- Ross, I.A., Springer, 2007, 3.
- Annapurna, A.S.; Abhirami, D.; Umesh, T.G. S.Afr. J. Bot. 2021, 142, 441-450.
CrossRef - Eswani, N.; Kudus, K.A.; Nazre, M.; Awang N, A.G.A.; Ali, M., Pahang. J. Agric. Sci. 2010, 2, 190-210.
CrossRef - Burkill, I.H., Kuala Lumpur: Ministry of Agriculture & Cooperatives, 1966, 2.
- Vyas, J.; Itankar, P.; Tauqeer, M.; Kelkar, A.; Agrawal, M. Pharmacogn. Mag. 2013, 5(6), 259-264.
CrossRef - Kharat, S.; Namdeo, A.; Mehta, P. J. Taibah Univ. Sci. 2017; 11(5), 775-781.
CrossRef - Gosslau, A. Food Sci. Hum. Wellness. 2016, 5(3), 103-115.
CrossRef - Schiantarelli, P.; Cadel, S.; Acerbi, D.; Pavesi, L. Arzneimittel forschung, 1982, 32(2), 230–235.
- Bouchara, N.; Senejoux, F.; Fraisse, D.; Felgines, C.; Chezet, F.C.; Vasson, M.P.; Madani, K.; Rossary, A. S. Afr. J. Bot. 2001, 142, 206-215.
CrossRef - Posadas, I.; Bucci, M.; Roviezzo, F.;, Rossi, A.; Parente, L.; Sautebin, L.; Cirino, G. Br. J. Pharmacol. 2004, 142(3), 331–338.
CrossRef - Prado, O.M.G.; Gutiérrez, A.R.A.; Abrego, R.V.H.; Velázquez, S.A.M.; Muñoz, G. M.A.; Ramírez, N.P.; Angeles, E.; Alba, H.F. Bio Med Res. 2014, 1–10.
CrossRef - Zhai, H.; Wilhelm, K.P.; Maibach, H.I., CRC Press, U.S, 2007, 7.
- Gad S.C. Biomark Med. 2014, 7-69.
CrossRef - DeLorme, M.P.; Ladics, G.S.; Donner, E.M.; Wagner, V.O.; Finlay, C.; Frame, S.R.; Everds, N.E.; Loveless, S.E., Drug Chem Toxicol. 2005, 28, 379–395.
CrossRef - Van Herck, H.; Baumans, V.; Brandt, C.J.; Boere, H.A.; Hesp, A.P.; Van Lith, H.A.; Schurink, M.; Beynen, A.C., Lab. Anim. (Lond.) 2001, 35, 131–139.
CrossRef - Patra, C.R.; Moneim, S.S.A.; Wang, E.; Dutta, S.; Patra, S.; Eshed, M.; Mukherjee, P.; Gedanken, A.; Shah, V.H.; Mukhopadhyay, D., Toxicol Appl Pharm. 2009, 240, 88–98.
CrossRef - Chavda, R.; Valadia, K.R.; Gokani, R., Int J Pharmacol. 2010, 6, 937-43.
CrossRef - Tarkang, P.A.; Agbor, G.A.; Armelle, T.D.; Yamthe, T.L.R.; David, K.; Ngadena, Y.S.M., J Nat Prod Plant Resour. 2012, 2, 617-27.
- Hayes, A.W., New York, CRC Press. 2007, 5.
- Khedir, S.B.; Mzid, M.; Bardaa, S.; Moalla, D.; Sahnoun, Z.; Rebai, T., Alternat. Med. 2016, 12, 1-12.
CrossRef - Coutinho, A.E.; Chapman, K.E. Mol. Cell. Endocrinol. 2011, 335(1), 2–13.
CrossRef - Kroot, E.J.A. Ann. N.Y. Acad. Sci. 2006, 1069 (1), 300–306.
CrossRef
Accepted on: 17 Apr 2022
Second Review by: Dr.R.Santhi
Final Approval by: Dr. Ayssar Nahle


ISSN Online: 2231-5039

![]()


