Synthesis of Ce<sup>3+ </sup>Doped with Cu-Zn Ferrite Nanoparticles and Study Structural, Morphological Properties
1Department of Chemistry, Jawahar College, Andur, Tq. Tuljapur, Osmanabad, Maharashtra, India-413603.
2Department of Chemistry, Art's, Commerce and Science College, Ozar (Mig), Tq. Niphad, Nashik, Maharashtra, India-422206.
Corresponding Author E-mail: patiljayshree86@gmail.com
DOI : http://dx.doi.org/10.13005/ojc/380104
Download this article as:
![]()
Nanoparticles of Ce3+doped Cu0.5Zn0.5Cexfe2-xO4. (x = 0.0,0.025 to 0.10) samples prepared by using sol-gel auto combustion technique. This prepared sample sintering temperature is confirmed by TGA. The prepared samples sintered at 600 ℃ at 4 hrs. The prepared samples phase was confirmed by considering the XRD analysis technique. Structural parameter like lattice, porosity, density, length, etc., was measured with composition x by using XRD. The dopant concentration increases, the lattice constant in increases while crystallite size decreases. The surface morphology was confirmed by scanning electron microscopy (SEM). The Cu, Zn, Ce, Fe and O elements are existence in the composition confirmed by EDAX spectra. The cation distribution revealed that Zn2+ion primarily on tetrahedral-A sites, the octahedral-B site shows high preference to copper (II) and Ce (III) ions. Fe (III) ions are constantly distributed on both sites tetrahedral-A and octahedral-B sites. Indication of two vibrational spectra between 400 to 600cm-1 corresponding to the tetrahedral and octahedral sites occurs by the analysis of FT-IR.
KEYWORDS:Cu-Zn ferrite; Ce3+ion; Sol-gel method; FT-IR.; XRD; SEM
Introduction
The wide use in a variety of technologies such as magnetic sensitive storage chip, microwave base systems, electronic generator, nano material-based medicine, drug also other pharmaceutical application gives the opportunity to researcher in synthesis of spinel shape ferrites nanoparticles 1-3. The general formula for spinel ferrite nanoparticles is AB2O4 whereas letter A represents divalent like Co, Ni, Fe, Sn, and Cu in (+II) statesand B represents trivalent like Fe, Al La, In, Cr and Ho in (+III) states 4. Due to their soft magnetic action ferrites is called as soft ferrite 5. Ferrimagnetic behavior in cubic spinel ferrites cause super exchange (A–O–B) through oxygen anions by tetrahedral and octahedral sub lattices 6. MeO.Fe2O3 has eight formula units, resulting in a 56-atom arrangement within a single unit cell. Soft ferrites have a cubic structure with 32 oxygen ions. The A and B sublattices are filled by these oxygen ions 7-8. Various ferrites with minor component substitutes demonstrating to give materials for an assortment of utilizations. Contingent upon the structure and measure of uncommon earth components utilized, adding a modest quantity of uncommon earth particles to a ferrite test changes its electrical, attractive properties. There are two types of rare-earth ions: those with a radius equal to Fe (III) ions and those with a range more noteworthy than Fe3+ ions particles 9. Owing to their strong ionic radii, the replacement of uncommon earth particles into ferrite brought about the substitution of Ferric ion by uncommon earth particles and decreased solvency in the spinel grid 10. Unpaired 4f electrons are found in rare-earth ions. The particles in the fourth shell are secured by the particles in the fifth shell, and the possible field of the encompassing particles has no impact on them 11.
The Ce3+– Fe3+ cooperation’s show up (3d–4f coupling) when uncommon earth Ce3+ particles are subbed, influencing the electrical and attractive properties of spinel ferrites. As uncommon earth particles are substituted into spinel structure, structural distortion occurs; altering the electrical transport properties 12-13. The synthesis of ferrites using traditional methods is often limited by factors such as experimentation time, high temperature, grain size, and solution PH. Composition, sintering temperature, and sintering time can all be used to tailor the properties of ferrites 14-15. Exploratory strategies for the amalgamation of ferrite nanoparticles incorporate the two-fold sintering fired strategy 16, flash combustion technique 17, a sol-gel technique 18, electrospinning process 19, and micro emulsion technique 20. Roman T. et al. investigated primary changes and magneto-electrical properties of cerium doped copper ferrites during the sintering framework 21. Ghosh M. et al studies microstructural, magnetic, optical characterizations of Ce3+doped nanocrystalline cobalt–zinc ferrite 22. Current project is about synthesis of Cu0.5Zn0.5Fe2-xCexO4, nano ferrites of different compositions.
Experimental
Synthesis of nanoparticles
Nanoparticles of Ce doped Cu-Zn Ferrite having chemical formula Cu0.5Zn0.5Fe2-xCexO4 (x=0.0,0.025,0.050,0.075,0.10) ferrites synthesized by using the sol-gel auto combustion techniques. The insightful grade reagent of Copper Nitrate, Zinc nitrate, ferric nitrate, Cerium nitrate and citrus extract were utilized as beginning materials. Metal nitrate broke up in stoichiometric extent in deionized refined water, and afterward the citrus extract arrangement was included 1:3 molar proportion, the PHof the subsequent arrangement changed up to7, by adding fluid smelling salts, then, at that point, the blended arrangement warmed on the hot plate persistently mixing at 900C, at last because of auto burning, brown-shaded debris got. The sintering not set in stone from TGA/DTA and arranged powders of all the forerunner tests were sintered at 600 0C for 4 h .
Characterization
Utilizing a Shimadzu SDT Q600 warm analyzer, the dried powder was described utilizing TGA/DSC at a warming pace of 10 °C/min in nitrogen (N2) air to decide the crystallization temperature. EDAX (energy dispersive X-beam investigation) was utilized to decide the assessed measure of component and stoichiometry in the arrangement The Rikagu Miniflax X-beam Diffractometer was utilized to record the X-beam diffraction (XRD) examples of tests at room temperature utilizing Cu–K radiation. With a checking pace of 2°/min, X-beam diffraction information were gathered in the 200–70° territory. Checking Electron Micrograph (SEM) was utilized to play out the morphological examination. Oxygen location, lattice parameters, and cation distribution were all determined. A Perkin Elmer infrared spectrophotometer was used to measure infrared spectroscopy (IR) in the range of 800–200 cm-1.
Result and Discussion
Thermogravimetric analysis (TGA)
Figure 1 shows the standard TG/DTA bend of test 0.075. The deficiency of translucent water is seen in the temperature scopes of 120–140 °C and 420–470 °C, as indicated by the investigation, all things considered. The metal hydroxides are changed over into relating metal oxides, which then, at that point, go through strong state response with the development of nanocrystalline ferrite at temperatures somewhere in the range of 550 and 650 °C. As a result, for this sequence, we chose a sintering temperature of 600 °C for 4 hours.
 |
Figure 1: The typical curve of TGA/DTA of sample x= 0.075 |
Scanning electron microscope and Energy Dispersive X-Ray Analysis
The basic investigation of all examples Cu0.5Zn0.5Fe2-xCexO4. (x=0.00, 0.025, 0.05, 0.075, 0.1) were done by the EDAX strategy is displayed in Fig.2. The EDAX spectra got from the focal point of Zn subbed Ni Ce ferrite grains demonstrated the presence of an enormous centralization of n inside the energy range of, 1.2keV, 9keV, and 10keV, Cu in between 0.9keV, 8.1keV and 8.4keV and Ce was seen between 4.25keV,5.8 keV and 6.25 keV whereas Fe was seen between the energy range of 0.7 keV, 6.25 keV, and 7 keV. Fig. 3. The ferrite powder has agglomerated because of the hotness treatment, demonstrating that the pre-arranged examples have a high reactivity 19. SEM and EDAX of all examples had the very component that is exemplified, which is important.
 |
Figure 2: EDS pattern of Cu0.5Zn0.5Fe2-xCexO4 nanoparticles (x=0.1) |
 |
Figure 3: SEM image of Cu0.5Zn0.5Fe2-xCexO4 nanoparticles (x=0.0 and x=0.5) |
X-ray diffraction Study
The x-beam diffraction (XRD) examples of strengthened Cu0.5Zn0.5Fe2-xCexO4 (x=0.0,0.025,0.050,0.075,0.10) are shown in Fig. 4. X-beam diffraction tops identified with Bragg’s appearance from (220), (311), (400), (422), (511) and (440) planes relate to the standard design of Cu0.5Zn0.5Fe2-xCexO4 ( x=0.0,0.025,0.050,0.075,0.10 ). The obtained pattern was indexed using JCPDS Card No. 897409(CuZnFe2O4) 21 and uncovers the way that the orchestrated example is of face-focused cubic design with space bunch Fd3m. Also, weak Secondary peaks corresponding to CeO2 were reflected in the XRD diffractogram shown in Fig.3. The cubic CeO2 phase appears because of the bigger ionic radii of cerium ion particle (1.020 Å) contrasted with the ferric ion particles (0.645 Å) 22. The literature writing revealed that the rare earth (RE) components into the spinel lattice cause phase isolation and precipitation of additional phase 23.
 |
Figure 4: XRD pattern of Cu0.5Zn0.5Fe2-xCexO4. (x=0.00, 0.025, 0.05, 0.075, 0.1). |
The cross-section steady ‘a’ was controlled by the situation 1[5]:
Where h, k, l are Miller indices and d is interplanar spacing. The determined upsides of the grid consistent are summed up. It is seen that the grid consistent increments from 8.368 Å to 8.421Å with Ce3+concentration x the upsides of lattice constant ‘a’ are classified in Table 1. The expansions in lattice constant are because of the distinction in ionic radii, the more modest ionic radii of Fe3+(0.645Å) replaced by larger Ce3+ion (1.02Å) 22.
The X-density (dx) of the examples was dictated by condition 233;
Where M-atomic mass of the relating synthesis, N-Avogadro’s number, and a3-the volume of unit cell. The value of ‘dx’ are introduced in Table 1. It is seen that x-beam densities increment from 5.292 to 5.791 gcm3- with Ce3+concentration x, this might be on the grounds that Ce3+has more prominent nuclear weight m (140 g/mol) supplant more modest Fe3+ (55.84amu), and its outcome expansions in nuclear load with Ce3+ substance 24.
Crystallite size ‘t-XRD’ of the sample was measured using the major peak (311) by Scherer formula 334:
Where, q – Bragg point, B – full width at half most extreme, and λ – frequency of radiation. The upsides of crystallite size are classified in Table 1. The upsides of Crystallite size of the examples decline with expanding the Ce3+ particle content. These impacts are seen as XRD tops increments by the expansion of cerium (Ce) because of the development of the optional stage, which dwells in the grain limits and confines the grain development 22. With an improvement in Ce3+ substitution, the mass thickness expanded from 2.671 (x = 0.0) to 3.291 (x=0.1). One potential clarification for the expanded densities is that the presentation of Ce3+ions brought about more modest ferrite grains, bringing about denser examples, which was steady with upgrades in the rate shrinkage of width and relative densities. One more justification behind the expanding densities in the arrangement of unfamiliar stage CeO2 22. Percentage porosity (p%) of the explored ferrite tests is controlled by utilizing the relations 45.
Where, dx and dB are the X-density and bulk density separately. The percentage porosity was seen from 57.208 – 58.248 % Ce3+ particle content. The upsides of the rate porosity are given in Table 1. The particle surface region (S) was determined from the crystallite size in the nanometer and the deliberate thickness in utilizing the connection relation 5 23.
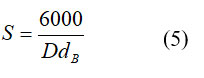
Where D-crystallite size and dB-bulk density. The surface area (S) value with Ce3+ replacement is tabulated in Table 1. The surface area values are decreased with Ce3+ ion concentration increase in Cu-Zn ferrite. The surface area is contrarily corresponding to the bulk density and crystallite size.
The particle bounce length at A (LA) and B-destinations (LB) were determined by formulae 6 and 7;
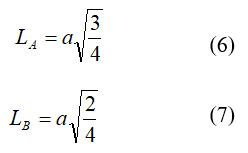
Utilizing the connection talked about somewhere else [22], Hopping lengths (LA, LB) between magnetic ions (the distance between the ions) in the tetrahedral (A) and octahedral (B) destinations not really settled. The hopping length esteems are depicted in Table 1. This shows that the hopping length expanded as the grouping of Ce3+ particles expanded.
Table 1: Composition x, lattice constant (‘a’), xdensity (dx), bulk (dB), percentage Porosity (P), crystallite size (DXRD), hopping lengths (LA and LB) Cu0.5Zn0.5Fe2-xCexO4 (x=0.0, 0.025, 0.05, 0.075, 0.1)
|
Creatn. x |
a (obs.) (A0) |
Dx (A0) |
dB (gm/cm3) |
P (%) |
DXRD (nm) |
S (m2/g) |
LA (Å) |
LB(Å) |
|
0.0 |
8.364 |
5.353 |
2.671 |
57.206 |
14.132 |
60.325 |
3.622 |
2.957 |
|
0.025 |
8.373 |
5.369 |
2.886 |
57.583 |
13.481 |
54.578 |
3.626 |
2.960 |
|
0.05 |
8.394 |
5.371 |
2.987 |
57.984 |
12.273 |
51.897 |
3.635 |
2.968 |
|
0.075 |
8.415 |
5.386 |
3.124 |
58.046 |
11.077 |
48.038 |
3.644 |
2.975 |
|
0.01 |
8.421 |
5.391 |
3.291 |
58.248 |
10.383 |
42.275 |
3.646 |
2.977 |
The allied parameters like octahedral bond and tetrahedral length, tetrahedral edge, shared and unshared octahedral edge (dAXE, dBXE, and dBXEU) still up in the air utilizing oxygen positional boundary ‘u’ (0.375 Å) and grid boundary ‘a’,
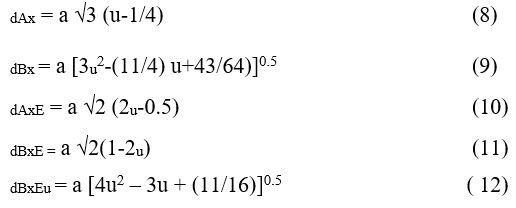
In Cu-Zn ferrite, the variations of allied parameters with Ce3+ concentration are shown in Fig. 5. The radii of Ce3+ and Fe3+ ions are related to the allied parameters. The composition of Ce3+ in Cu-Zn ferrite raises the allied parameters. The dopants used in the doping process, as well as the cation distribution within prepared compositions, cause this increase in edge lengths.
 |
Figure 5: Allied parameter of Cu0.5Zn0.5Fe2-xCexO4. (x=0.00, 0.025, 0.05, 0.075,0.1) Click here to View figure |
The cation flows were constrained by researching the x-bar diffraction patterns’ strength. The saw power extent was diverged from the intentional force extent in this collaboration. Method for Ber inflexible 23. Table 2 shows the cation flow of the 600oc examples. The outcomes show that Cu2+ and Ce3+ cations will in general involve octahedral location, while Zn2+ and Fe3+ particles move toward tetrahedral destinations [A]. The ionic reach (rA and rB) for both tetrahedral (A) and octahedral (B) worked with objections submitting to ideal cationic not actually settled using the going with associations 21,22. With an increment in Ce3+ replacement in Cu-Zn ferrite, both rA and rB stay steady while rB increments. The increment in rB is because of the substitution of more modest Fe3+(0.645) particles by bigger Ce3+ (1.02) particles at an octahedral B site, as displayed in Table 2.
The hypothetical grid boundary (ath) was controlled by connection 22:
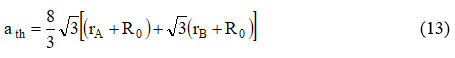
Where RO is the radius of oxygen, for example (RO = 1.32 Å), rB and rA, and are radii of octahedral [B] tetrahedral (A) site. The upsides of ‘ath’ are summed up in Table 2 and it is noticed theoretical lattice constant increases with an increase in Ce3+ replacement.
The oxygen positional boundary ‘u’ not set in stone utilizing the span of oxygen particle RO= 1.32 Ǻ, upsides of ‘a’ and ‘rA’ with the assistance following articulation 22:
Table 2. shows the upsides of oxygen positional boundaries, and it is found that the worth of ‘u’ diminishes with the substitution of Ce3+ in Cu-Zn ferrite. The metallic particles in spinel oxide are smaller than the oxygen ions. Spinel lattice value slightly deviated from the actual value of spinel lattice.24.
Table 2: Composition x, Cation appropriation, band position (ʋ1 and ʋ2), mean ionic radii (rA and rB), theoretical lattice constant constant(ath), Oxygen boundary (u) of Cu0.5Zn0.5Fe2-xCexO4 (x=0.0, 0.025, 0.05, 0.075, 0.1).
|
Comp. X |
Cation appropriation |
Band Position |
mean ionic radii |
ath (A0) |
u (A0) |
|||
|
(A) Position Conc.of Zn2+and Fe3+ = 0.5 |
[B] Position Conc. Of Cu2+ =0.5, Fe3+ ≈ 1.5, Ce3+= | 0.0 to 0.1| |
ʋ1 cm-1 |
ʋ2cm-1 |
rA(Å) |
rB (Å) |
|||
|
0.0 |
(Zn2+and Fe3+) |
[Cu2+ and Fe3+] |
566.41 |
362.45 |
0.641 |
0.671 |
8.25 |
0.392 |
|
0.025 |
(Zn2+and Fe3+) |
[Cu2+and Fe3+and Ce3+] |
570.63 |
367.92 |
0.641 |
0.677 |
8.321 |
0.390 |
|
0.050 |
(Zn2+and Fe3+) |
[Cu2+and Fe3+and Ce3+] |
571.3 |
395.51 |
0.641 |
0.683 |
8.382 |
0.389 |
|
0.075 |
(Zn2+and Fe3+) |
[Cu2+and Fe3+and Ce3+] |
575.17 |
399.64 |
0.641 |
0.689 |
8.447 |
0.387 |
|
0.1 |
(Zn2+and Fe3+) |
[Cu2+and Fe3+and Ce3+] |
627.14 |
418.34 |
0.641 |
0.694 |
8.501 |
0.384 |
Fourier Transform Infrared Spectroscopy (FTIR)
Figure 6 depicts the FT-IR spectral analysis of samples. FT-IR analysis is often used to assign vibrational bands to a specific group in compounds 25-27. There are three retention groups in the scope of 200 – 800 cm-1 in the current example. The absorption bands 1 and 2 in the ranges of 566.41 cm-1 – 627.14 cm-1 and 362.45 cm-1 – 418.34 cm-1, respectively, were allocated shown in Table 2. The intrinsic vibrations of tetrahedral and octahedral are due to the band 1 and 2 bands, respectively. For the A – B site, the Fe3+ O-2 distance is the most important factor. In Table, the band frequency values are tabulated. 2. Show that the frequency of the bands increases as the Ce3+ content rises. The as of now researched ferrite framework Ce3+occupied B-site by supplanting Fe3+ions which influence the band positions 28, 29.
 |
Figure 6: FT-IR spectrum of synthesized Cu0.5Zn0.5Fe2-xCexO4. (x=0.0, 0.025, 0.05, 0.075, 0.1) |
Conclusion
The Cerium ion doped Cu-Zn ferrite nanoparticles of different concentration synthesized by using the sol-gel method and it confirmed by XRD analysis. The XRD pattern of prepared samples revealed the formation of cubic spinel structure. The lattice constant increases in the range (8.364 Å to 8.412 Å) and average crystallite size decreases in the range of (14nm -10nm). The hopping lengths of both sites increases. The allied parameter was increased with increase in Ce-content.
In Cation distribution of Zn2+ prefer to tetrahedral sites, while Cu2+ and Ce3+ ions prefer to octahedral sites. Ferric (Fe3+) ions occupy both tetrahedral and octahedral sites. EDAX spectra shows all the elements are confirmed. Spinel Structure and distribution of ions between two sites confirmed by IR spectra.
Acknowledgement
The author Jayshree Patil is thankful to Chemistry Department, University of Pune, University of Dr. Babasaheb Ambedkar Marathwada university for instrumental facilities. I also thankful to Dr Vishnu Adole for their valuable guidance.
Conflicts of interest
The present research work had no conflict of interest.
Funding Sources
There is no funding source.
References
- Smit J, Wijn HPJ, Ferrites, Philips Technical Library, Eindhoven. The Netherlands, 1959; 139-142.
- Patange SM, Shirsath SE, Lohar KS, Jadhav SS, Kulkarni N, Jadhav KM, Physica B Condens., 2011;406(3): 663-668.
CrossRef - Hosseinpour-Mashkani SM, Sobhani-Nasab A.; Maddahfar, M., J. Nanostruct. 2016; 6(1): 67-70
CrossRef - Goldman A, Modern Ferrite Technology, second ed., Springer, New York, 2006;
- Peng LiD, Cui ZJ, Wang XM, Yang CB, Ge HL, Fu ZQYY, Materials and Engineering, 2009; 920 –923.
- Shirsath SE, Toksha BG, Jadhav KM, Mater. Chem. Phys., 2009; 117(1): 163-168.
CrossRef - Cullity BD, Elements of X-ray Diffraction. Addison-Wesley Publishing. 1956;
- Williamson GK, Hall WH, Acta metallurgica, 1953; 1(1): 22-31.
CrossRef - Rezlescu N, Rezlescu E, Pasnicu C, Craus ML, Journal of Physics: Condensed Matter, 1994; 6(29): 5707.
CrossRef - ShindeTJ, Gadkari AB,Vasambekar PN, J. Magn. Magn. Mater. 2010, 322(18): 2777-2781.
CrossRef - Wu X. Ding Z,Song N, Li L. Wang W, Ceram. International, 2016,42(3): 4246-4255.
CrossRef - Abdellatif MH, El-Komy GM, Azab AA, Moustafa AM, Salerno M, J. Magn. Magn. Mater. 2020, 502: 166517.
CrossRef - Elayakumar K,Dinesh A, Manikandan A, Palanivelu M, Kavitha G, Prakash S, Kumar RT, Jaganathan SK, Baykal A. J. Magn. Magn. Mater. 2009, 476:157-165.
CrossRef - Wei QM, Li JB. Chen, Y.J., J. Mater. Sci. 2001, 36(21): 5115-5118.
CrossRef - Ohnishi H, Teranishi T. J. Phys. Soc. Jpn. 1961, 16: 31.
CrossRef - Nakamura T. J. Magn. Magn. Mater. 1997, 168(3):285-291.
CrossRef - Mangalaraja RV, Ananthakumar S, Manohar P, Gnanam F D. J. Magn. Magn. Mater. 2002, 253:56-64.
CrossRef - Gaffoor A, Ravinder D. Int. J. Eng. Res. Appl, 2014, 4(4): 73-79.
- Wang Wei, Nan Li, Yue Chi, Yanjuan Li, Wenfu Yan, Xiaotian, Li, Changlu Shao. Ceram. International 2013, 39: 3511-3518.
CrossRef - Das Nandini, Majumdar Ranabrata, Sen Amarnath, Maiti Himadri Sekhar. Mater. Lett. 2007, 61: 2100-2104.
CrossRef - Arul, E,Sivaji K, Manohar P. Int. J. Mater. Sci. 12 (2017), 350-357.
- Kamran M, Anis-ur-Rehman M.J. Alloy Comp., 2020, 822:15383.
CrossRef - Roman T, Pui A, Lukacs AV, Cimpoesu N, Lupescu S, Borhan AI, Kordatos K, Ntziouni A, Postolache P, Zaharia M, Stanciu S. Ceram. International, 2019, 45(14): 17243-17251.
CrossRef - Ghosh Prasad, Mritunjoy , Mukherjee, Samrat. J. Mater. Sci.: Mater. Electron. 2020, 31:6207-6216.
CrossRef - Adole VA, Jagdale BS, Pawar TB, Sawant AB. J. Chin. Chem. Soc., 2020, 67(10):1763-1777.
CrossRef - Adole VA, Jagdale, BS, Pawar TB, J. Sulphur Chem., 2021, 21(2): 131-148.
CrossRef - Adole VA, Waghchaure, RH, Pathade SS, Patil MR, Pawar TB, Jagdale BS. Mol. Simul. 2020, 46(14):1045-1054.
CrossRef - Ahamed SKA, Naidu Vasant, Amalorpava S, Anand V. Int. J. Comput. Appl. 2012, 40: 8875 – 8887.
- Hussain K, Bibi A, Jabeen F, Amin N, Mahmood K, Ali A, Iqbal MZ, Arshad MI. Physica B Condens. Matter, 2020, 584: 412078.
CrossRef
Second Review by: Dr. Femina Felix
Final Approval by: Dr. Nenad Ignjatovic


![]()


