A Case Study on Estimation of Air Quality in Hadapsar Suburban of Pune India
Erum Kazi1* , Satish Kulkarni2, Yaseen Ismail Shaikh3, Viquar Sameer Shaikh3, Neeraj Prasad4
1Department of Environmental Science, Abeda Inamdar Senior College, S.P. Pune University, Pune, India.
2Department of Environmental Science, New Arts, Commerce and Science College, S.P. Pune University, Ahmednagar, India.
3Department of Chemistry, Abeda Inamdar Sr. College, S.P. Pune University, Pune, India.
4Department of Nanotechnology, Kolhapur University, Kolhapur, India.
Corresponding Author E-mail: kazierum14@gmail.com
DOI : http://dx.doi.org/10.13005/ojc/380115
Download this article as:
![]()
The impact of air pollution on the roadside plants in the Hadapsar suburban was determined using six different plant species. To assess the effects of air pollutants on roadside plants of Hadapsar area in Pune city, APTI (Air Pollution Tolerance Index) was determined of six plant species. Plants species selected for the study were Polyalthia long folia, Ficus racemosa, Terminalia catappa, Ficus benghalensis, Ficus religiosa, Samanea saman of nearly the same age size and were found in abundance. Physiological and biochemical parameters such as pH, Relative water content (RWC), Total Chlorophyll (T.C.), Ascorbic acid (A.A.) contents were determined to calculate APTI. Results indicated that all of the plants selected for the study were found to be sensitive & heavily impacted due to air pollution. Thus, these plants can be used as Bio-indicators in monitoring air pollution.
KEYWORDS:Air Pollution; Air Pollutants; APTI calculations of Plants; Ficus racemosa; Ficus benghalensis; Ficus religiosa; Polyalthia long folia; Samanea saman; Terminalia catappa
Introduction
The biosphere consists of biotic, abiotic components and resources under the influence of constant degradation 1. It is an active hub of interactions between the living and non-living forms of matter, such as photosynthesis and respiration. The biosphere can be further simplified into simple components called ecosystems. In photosynthesis, green plants synthesize carbohydrates, i.e. complex organic compounds from simple inorganic compounds like carbon dioxide and water in the presence of sunlight and chlorophyll. This is how the physical form of energy is captured and converted into the chemical form of energy. No animal can capture and convert physical forms of energy into chemical forms. However, the plant kingdom can capture the physical form of energy, i.e. solar energy, and converts it into chemical form. Thus, the kingdom Plantae provides energy to entire living systems. Here we observe a direct interaction between biotic and abiotic factors.
On the other hand, if we see the process of respiration, we observe the exact opposite situation, i.e. complex organic compounds are decomposed into simple organic compounds like carbon dioxide and water with a gain of energy. There is also a direct interaction between nature and the living species. There is always a balance between the biosphere and abiotic factors. The quality of life highly depends upon the quality of the environment. At this incredible speed of exploiting renewable resources, extinction of life forms, exhaustion of fossils, and mineral wealth, it becomes impossible for humanity to survive for a very long period. Hence, it becomes our essential duty to closely examine the environmental issues to attain a balanced development without destroying habitats 2.
Man has an unbroken relationship with the environment. An individual on the planet depends upon how sensibly and successfully he maintains the quality of life on the earth. There is a definite genetic formulation of every individual. The individual’s genetic makeup is fixed and cannot change every time with changing environmental conditions. The significant changes in the earth are due to changes in the concentration of carbon dioxide. The human body cannot develop resistance to more toxic materials that enter through the body in the way food we eat, the water we drink, and the air we breathe 3. Man has no choices other than fighting with the environment for sustained quality. This, in general, is mainly reached by combined struggles at the level of individuals, communities, governments, and international bodies 4. Man’s health status represents the interactions of the human internal biological system and the external environment. Environmental pollution: Air pollution is defined as any material added into the air by human activity that causes harmful effects on human health and vegetation and interferes with utilizing natural property 5. There are various air pollution causes such as industrialization, motor vehicle exhaust of carbon dioxide and particulate carbon, solid waste, and construction plants. The study indicates that the chemical composition of pure air, i.e. without any pollutants, consists of 78% Nitrogen, 21% oxygen, and 1% other gases6.
Hazardous Effects of air pollutants
Atmospheres exist as a gaseous shield for the earth’s surface. It comprises numerous gases in trace amounts and particulate matter. The release of smoke, odour and ash particles due to the burning of fossil fuels and forest fires are specific pollutants. The air in nature is free from the influence of the industries and urban influence. The entry of foreign particles by human activities resulting from discharge through chimneys smoke from automobiles into atmospheric air in different concentrations may be excessive and toxic and are considered dangerous air pollutants. The usual range of other gases varies in the atmosphere. Trees experience the most significant exposure and are significantly influenced by pollutant concentration because of their perennial habit 7. Commonly found constituents in air increase in their concentration, becoming more hazardous to life forms—exposure to indoor and outdoor air quality changes entirely with time and diurnal patterns. The health of humans is very much related to environmental quality as the etiology of diseases in humans is connected to man’s living environment. In countries like Africa, the environmental influence is much higher 8. This situation is seen in both developed and developing nations. It is predicted through statistical data that 25% of preventable diseases are caused by environmental factors 9. The concentration of the exposure of the contaminants and the time duration of exposure reveal an individual’s total exposure to a specific pollutant 10. Actual damage to health by the dust generated depends on its composition and nature.
Effects of Air pollutants on plants
The plants being handicapped are unable to move, also regarded as victims of air pollution. Plants exhibit many physiological changes in response to air pollution. Urban air pollution has become a severe issue to trees and crops 11. Though sulphur is essential for vegetation in small amounts, gaseous sulphur dioxide is harmful to man and plant life. The impact of SO2 upon plant life is consistently recognized in terms of damage caused to plants. Air pollutant impact upon vegetation is in terms of the degree of wear, such as suppressing photosynthesis, reduced activity of enzymes, injury symptoms, yield reduction, chlorosis, and plants’ ultimate death about eight concentrations duration of plant exposure the pollutant. Air pollutants cause acute and chronic damage to anatomical, morphological and physiological characteristics 12. SO2 enters through stomata and indirectly through roots. Physiological alterations may be of different kinds. The shape of the stem and leaves are affected. Early senescence and reduced flowering take place. Reduced yield is observed due to biochemical and physiological alteration levels without visible symptoms. The plants exposed to SO2 are classified susceptible 13. SO2 affects chlorophyll, and chlorophyll patches are found to appear on leaves. It is observed that with an increase in the SO2 level, the chloroplast is mainly attacked. The synthesis of RuBP also gets affected. They degrade chlorophyll molecules to phenophytin and Mg. In turn, photorespiration gets involved.
SO2 affects different functions of plants in terms of growth, accumulation of biomass, and the reproductive process. The Ozone concentration is more in suburban areas than in rural areas. SO2 and NO2 concentrations are higher, observed in urban areas 14. Ozone is the most common poisonous photochemical to plants. Carbon monoxide is not toxic to floras. Green plants, through their fixation, are found to play a significant role by reducing their content. Plants are natural sinks to carbon monoxide. Since CO is mainly oxidized to CO2, it is found that these gases are not the primary reasons for global threats. Hydrogen fluoride also enters the plant and inhibits photosynthesis. Recovery of plants from the fluoride effect is slower than sulphur dioxide.
The most noted injury resulting from air pollution may be acute or chronic injury and yield retardation. Degradation of photosynthetic pigment has been widely used as an air pollution indicator 15. Chronic exposure of leaves and needles to air pollution can easily break the waxy coating, reducing water loss and damage from diseases, pests, drought, and frost 16. A plant’s response to pollutants varies between species, genes, and varieties within a given species. It affects morphological, physiological, and biochemical characteristics. Plants do not show similar susceptivity to different pollutants. Among the existing problems in the emerging scenario, air pollution is considered a fundamental problem to the ecological systems. They enter the atmosphere from particular and different sources and harm animals, plants, and human beings on earth for a long time. The present study aims to study the impact of air pollution on selected plant species by determining APTI, which could identify tolerance & sensitivity of plant species towards air pollution.
Material and Methods
Study area
Pune city is located in (18°32′N, 73°51′E, and altitude 559 m) 52. Hadapsar area (18°29 ′N, 73°55′E) is developed Eastern location of Pune city with having an area of 28.77 square km. It originated as an Industrial area and is densely populated. It is well connected to all parts of Pune city. It has a significant Bus stand for public transportation. Study area was selected was Hadapsar Bus Depot – due to heavy traffic inflow , congestion of traffic constant movement of heavy vehicles along with two, three and four wheeler. Also Urbanization in the area has caused a lot of trees to be cut down thus causing rise in air pollution.
Selection of Plant species
Plants selected for the study are –Saraca indica (Ashoka tree) (Figure1.a), Ficus racemosa (Umbar tree) (Figure1.b), Terminalia catappa (Almond tree) (Figure1.c), Ficus benghalensis (Banyan tree) (Figure1.d), Ficus religiosa (Peepal tree) (Figure1.e), Samanea saman (Raintree) (Figure1.f) along Hadapsar Bus stand.
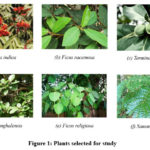 |
Figure 1: Plants selected for study. |
Fully matured leaves of almost the same age and size were collected in the morning hours from the selected plants during the winter and summer season in 2017.
A composite sample of each plant species was collected and immediately taken to the laboratory for analysis.
Analysis of leaves for biochemical parameters
We used roadside plants of six different species to determine air pollution in the study. The plant leaves were collected from others of the same age group and mature. The leaves were thoroughly washed in running water and then in deionized water. Thus, the foreign material adhered to on the surface of the leaves gets removed. The leaves were then dried with cotton cloths and used for further experimentation. To determine the air pollution level, we have herein studied four parameters viz (1) Estimation of leaf extract pH (2) Estimation of relative moisture content, (3) Estimation of total chlorophyll, (4) Ascorbic acid acetone extraction method.
Estimation of Leaf-extract pH 18
It is the negative logarithm of hydrogen ion concentration to base 10. It signifies the air pollution level. Here to determine the pH of the plant leaves, we took 0.5 grams of fresh, thoroughly washed, and then dried leaves. The plant material was brought in a stone- made mortar and crushed into small parts slowly. Then, the new material, i.e., paste, is further diluted with 50 ml deionized water. Now, the solution becomes ready to determine the pH of the plant extract. Then the digital pocket pH meter was dipped into the solution, which gives the direct value of the pH of the solution.
Estimation of Relative moisture content 18-19
Herein, to determine the relative moisture content of the leaves, we collected fresh leaves from the study area and immediately brought them to the laboratory. The sample leaves were washed thoroughly in running water followed by distilled water. The excess of water adhering to the surface of the plant part was removed using blotting paper. Then we took the initial weight of the plant called W1. Then the leaves were kept in the oven and maintained at the temperature of 70°C.
RWC = [(FW –DW)/ (TW –DW)] x 100
Where, FW = Fresh weight, DW = dry weight, and TW = turgid weight.
Estimation of Total Chlorophyll 20
The total chlorophyll was estimated principally by the Arnon method. One gram of fresh leaf was macerated with 80% (v/v) chilled acetone and a pinch of magnesium carbonate in a pre-chilled mortar and pestle. The extract was centrifuged at 2500 rpm for 10 minutes. The process was repeated till the extract became colourless, the extracts were pooled, and the volume was made up to 15mL. All operations were carried out in the ice bath under dark conditions. A UV-visible spectrophotometer measured the absorbance at 645, 663, and 750 nm.
Chlorophyll (a) in mg/g tissue = 12.7 (A663) – 2.69 (A645) × V / 1000 × W
Chlorophyll (b) in mg/g tissue = 22.9 (A645) – 4.68 (A663) × V/1000 × W
Total chlorophyll (mg per g tissue) = 20.2 (A645) +8.02(A663) × V/1000 × W
Ascorbic acid Acetone extraction method 21
Ascorbic acid is estimated by 2, 6- dichlorophenol indophenol’s dye method 21. One gram of fresh leaf was homogenized in 4mL of freshly prepared oxalic acid (0.4% w/v), filtered, and centrifuged at 1000 rpm for 20 minutes. The final volume was made up to 10 mL using oxalic acid. About 5mL of the extract was titrated against standardized 2, 6-dichlorophenol indophenol.
AA = I x S x D/A x 1/W Where, AA = Ascorbic acid in mgg-1 I = mL of indophenol used for titration S = mg of ascorbic acid reacting with 1mL indophenol D = total volume of the extract in mL A = Aliquot titrated in mL W = Weight of the sample in gm.
APTI (Air Pollution Tolerance Index) was calculated using the formula:
Air pollution tolerance index of species = [A (T+P)] +R/ 10]
Where,
A= ascorbic acid content of leaf in mg/g dry weight
T=total chlorophyll content of leaf in mg/g dry weight
P= Leaf extract pH
R= Relative water content (RWC)
10= Total sum is divided by 10 to obtain APTI values
After calculations, results were interpreted, as plants showing APTI value between 30-100 were termed as Tolerant, APTI between 29-17 was termed as Intermediate, and plants with APTI between 16-1 were termed as Sensitive to Air Pollution.
Ramification and Discourse
Table 1 & 2 shows that pH was acidic in 2017 in winter & summer seasons in the plants studied. A similar result was obtained, suggesting that SO2 and NOx in the ambient air causes a change in pH of the leaf sap towards the acidic range 10. Plants with low pH are susceptible to air pollution and with pH seven were tolerant towards air pollution 22-23.
The highest pH was observed in Polyalthia longifolia (Ashoka tree) (2.68 in winter, 2.93 in summer season) & lowest in Terminalia catappa (Almond tree) (2.45 in winter & 2.70 in summer) (Figure 2).
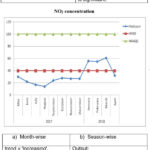 |
Figure 2 : Illustrates Particulate Matter ( PM 10 ) , Particulate Matter (PM 2.5 ), NO2, SO2 concentration seasonal trend analysis using Mann Kendall Test Particulate Matter 10 (PM 10). |
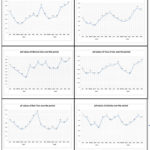 |
Figure 3: Illustrates the pH values of studied plants in 2017 & 2018 Click here to View figure |
Table 1: Showing Plant data (pH, RWC, T.C., A.A., APTI) of Summer & Winter season in 2017
|
Season |
Tree |
Year |
pH |
RWC |
TC |
AA |
APTI |
|
|
Summer |
Almond |
2017 |
Mean |
2.45 |
0.28 |
0.01 |
33.20 |
8.19 |
|
SD |
0.13 |
0.02 |
0.00 |
0.00 |
0.43 |
|||
|
Ashoka |
2017 |
Mean |
2.68 |
0.18 |
0.01 |
70.55 |
19.04 |
|
|
SD |
0.17 |
0.01 |
0.00 |
8.30 |
3.45 |
|||
|
Banyan |
2017 |
Mean |
2.63 |
0.31 |
0.01 |
33.20 |
8.78 |
|
|
SD |
0.05 |
0.01 |
0.00 |
0.00 |
0.17 |
|||
|
Peepal |
2017 |
Mean |
2.50 |
0.20 |
0.01 |
53.95 |
13.55 |
|
|
SD |
0.08 |
0.01 |
0.00 |
8.30 |
2.12 |
|||
|
SD |
0.10 |
0.01 |
0.00 |
7.68 |
2.16 |
|||
|
Rain Tree |
2017 |
Mean |
2.63 |
0.20 |
0.01 |
49.80 |
13.13 |
|
|
SD |
0.13 |
0.02 |
0.00 |
0.00 |
0.63 |
|||
|
Umbar |
2017 |
Mean |
2.50 |
0.18 |
0.01 |
37.35 |
9.43 |
|
|
SD |
0.12 |
0.02 |
0.00 |
8.30 |
2.41 |
|||
|
Winter |
Almond |
2017 |
Mean |
2.70 |
0.33 |
0.01 |
49.80 |
13.52 |
|
SD |
0.08 |
0.01 |
0.00 |
0.00 |
.41 |
|||
|
Ashoka |
2017 |
Mean |
2.93 |
0.20 |
0.01 |
83.00 |
24.37 |
|
|
SD |
0.10 |
0.01 |
0.00 |
0.00 |
0.79 |
|||
|
Banyan |
2017 |
Mean |
2.88 |
0.33 |
0.01 |
45.65 |
13.23 |
|
|
SD |
0.10 |
0.01 |
0.00 |
8.30 |
2.61 |
|||
|
Peepal |
2017 |
Mean |
2.85 |
0.23 |
0.01 |
66.40 |
19.00 |
|
|
SD |
0.13 |
0.01 |
0.00 |
0.00 |
0.86 |
|||
|
Rain Tree |
2017 |
Mean |
3.03 |
0.24 |
0.01 |
62.25 |
18.96 |
|
|
SD |
0.22 |
0.02 |
0.00 |
8.30 |
3.27 |
|||
|
Umbar |
2017 |
Mean |
2.78 |
0.20 |
0.01 |
49.80 |
13.88 |
|
|
SD |
0.10 |
0.00 |
0.00 |
0.00 |
0.48 |
|||
Table 2: Showing measured pH of the plant species in 2017
|
Plant |
Summer |
Winter |
|
Almond |
2.45 |
2.70 |
|
Ashoka |
2.68 |
2.93 |
|
Banyan |
2.63 |
2.88 |
|
Peepal |
2.50 |
2.85 |
|
Rain Tree |
2.63 |
3.03 |
|
Umbar |
2.50 |
2.78 |
Table 1 & 3 gives the Relative water content (RWC) (Figure 4) & it was found to be highest in Ficus benghalensis (Banyan tree) (31% in summer & 33% in winter season) & lowest in Ficus racemosa (Umbar tree) (17 % in summer & 19 % in winter season) as shown in Table 1& 3. The reduced relative water content indicates disturbed physiological status in the plants due to high air pollution levels 24.
Table 3: Showing Relative Water Content of the plants in 2017
|
Plant |
Summer |
Winter |
|
Almond |
28% |
33% |
|
Ashoka |
18% |
20% |
|
Banyan |
31% |
33% |
|
Peepal |
20% |
23% |
|
Rain Tree |
20% |
23% |
|
Umbar |
17% |
19% |
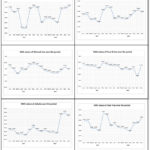 |
Figure 4: Illustrates the Relative Water Content of studied plants in 2017 & 2018 Click here to View figure |
Table 1 & 4 shows that Total chlorophyll content (Figure 5) was found to be highest in Ficus benghalensis (Banyan tree) (0.0089 mg/g in summer, 0.0088 mg/g in winter) and lowest in Ficus racemosa (Umbar tree) (0.0081 mg/g in summer, 0.0082 mg/g in winter). Loss in chlorophyll content in plants is due to suspended particulate matter and other pollutants in the air, as reported by Tripathi and Gautam 25. It can be observed that lower chlorophyll content in both plants indicates a higher sensitive nature of the plant species towards air pollution 26.
Table 4: Showing Total Chlorophyll Content (T.C.) of plants in 2017
|
Plant |
Summer |
Winter |
|
Almond |
28% |
33% |
|
Ashoka |
18% |
20% |
|
Ficus B |
31% |
33% |
|
Peepal |
20% |
23% |
|
Rain Tree |
20% |
23% |
|
Umbar |
17% |
19% |
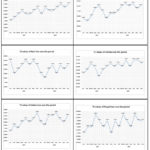 |
Figure 5: Illustrates the Total Chlorophyll content of studied plants in 2017 & 2018 Click here to View figure |
Tables 1 & 5 shows that Ascorbic acid content (Figure 6) was found to be highest in Polyalthia longifolia (Ashoka tree) (70.55 mgg-1 in summer, 83 mgg-1 in winter) & lowest in Ficus benghalensis (Banyan tree) (33.20 mgg-1 in summer & 45.65 mgg-1 in winter). A higher concentration of ascorbic acid in plants indicates exposure to SO2 and higher plant tolerance 27. Low ascorbic levels indicate sensitivity towards air pollution, and high levels of ascorbic acid reveal tolerance towards air pollution 28. Table 1 shows that pH was increased in the winter season, low in summer. Total chlorophyll was found to be high in summer and down in winter. Ascorbic acid content was high in winter and low in the summer season. Relative water content was low in winter and least in the summer season. Tanushree Bhattacharya & colleagues revealed similar results 29.
Table 5: Showing Ascorbic acid content of the plants in 2017
|
Plant |
Summer |
Winter |
|
Almond |
0.28418 |
0.33225 |
|
Ashoka |
0.18115 |
0.20243 |
|
Ficus B |
0.31360 |
0.33390 |
|
Peepal |
0.20015 |
0.23420 |
|
Rain Tree |
0.20305 |
0.23570 |
|
Umbar |
0.17570 |
0.19870 |
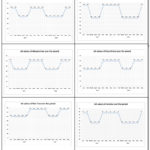 |
Figure 6: Illustrates the Ascorbic acid (AA) values of studied plants in 2017 & 2018 Click here to View figure |
Tables 1 & 6 shows APTI (Figure 7) in both seasons was found to be highest in Polyalthia longifolia (Ashoka tree) (19.04 in summer & 24.37 in winter) & lowest in Ficus benghalensis (Banyan tree) (8.78 in summer & 13.23 in winter).
Table 6: Showing APTI values of the plants in 2017
|
Plant |
Summer |
Winter |
|
Almond |
0.28418 |
0.33225 |
|
Ashoka |
0.18115 |
0.20243 |
|
Ficus B |
0.31360 |
0.33390 |
|
Peepal |
0.20015 |
0.23420 |
|
Rain Tree |
0.20305 |
0.23570 |
|
Umbar |
0.17570 |
0.19870 |
The order of APTI of selected plants on the roadside is as follows-
Polyalthia longifolia (Ashoka tree)> Ficus religiosa (Peepal tree)> Samanea saman (Raintree)> Ficus racemosa (Umbar Tree)> Ficus benghalensis (Banyan tree)
Variation in APTI was observed due to variation in biochemical parameters of selected plant species and their tolerance levels towards air pollution.
Table 7 shows that the concentration of Particulate matter 10 (PM 10) was above the permissible limits set by WHO in 2017 & 2018. It was higher in the winter and summer seasons in 2017 & 2018 as per NAAQS (National Ambient Air Quality Standards).
Table 7: Comparison of the observed PM 10 values with the permissible limits suggested by WHO
|
PM 10 (24 hour measurement ) |
||||
|
Year |
Month |
Hadapsar |
WHO |
NAAQS |
|
2017 |
January |
209 μg/m3 |
50 μg/m3 |
80 μg/m3 |
|
2017 |
February |
149 μg/m3 |
50 μg/m3 |
80 μg/m3 |
|
2017 |
March |
124 μg/m3 |
50 μg/m3 |
80 μg/m3 |
|
2017 |
April |
113 μg/m3 |
50 μg/m3 |
80 μg/m3 |
|
2017 |
May |
69 μg/m3 |
50 μg/m3 |
80 μg/m3 |
|
2017 |
June |
49 μg/m3 |
50 μg/m3 |
80 μg/m3 |
|
2017 |
July |
48 μg/m3 |
50 μg/m3 |
80 μg/m3 |
|
2017 |
August |
50 μg/m3 |
50 μg/m3 |
80 μg/m3 |
|
2017 |
September |
59 μg/m3 |
50 μg/m3 |
80 μg/m3 |
|
2017 |
October |
124 μg/m3 |
50 μg/m3 |
80 μg/m3 |
|
2017 |
November |
146 μg/m3 |
50 μg/m3 |
80 μg/m3 |
|
2017 |
December |
150 μg/m3 |
50 μg/m3 |
80 μg/m3 |
|
2018 |
January |
146 μg/m3 |
50 μg/m3 |
80 μg/m3 |
|
2018 |
February |
135 μg/m3 |
50 μg/m3 |
80 μg/m3 |
|
2018 |
March |
124 μg/m3 |
50 μg/m3 |
80 μg/m3 |
|
2018 |
April |
114 μg/m3 |
50 μg/m3 |
80 μg/m3 |
PM 10 was above permissible limits set by WHO in 2017 & 2018. Higher in winter & summer month in 2017, 2018 as per NAAQS
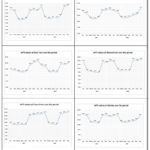 |
Figure 7: Showing APTI values of the plants in 2017 & 2018 Click here to View figure |
Table 8 shows that Particulate matter 2.5 (PM 2.5) was above the permissible limits in 2017 & 2018 as per WHO standards & below as per NAAQS standards in 2017 & 2018. The decline in concentration was observed in the Monsoon season, and there was an increase in the winter and summer seasons, respectively.
Table 8: Comparison of the observed PM 2.5 values with the permissible limits suggested by WHO
|
PM 2.5 values (24-hour Measurement) |
||||
|
Year |
Month |
Hadapsar |
WHO |
NAAQS |
|
2017 |
January |
96 μg/m3 |
25 μg/m3 |
80 μg/m3 |
|
2017 |
February |
95 μg/m3 |
25 μg/m3 |
80 μg/m3 |
|
2017 |
March |
79 μg/m3 |
25 μg/m3 |
80 μg/m3 |
|
2017 |
April |
33 μg/m3 |
25 μg/m3 |
80 μg/m3 |
|
2017 |
May |
30 μg/m3 |
25 μg/m3 |
80 μg/m3 |
|
2017 |
June |
22 μg/m3 |
25 μg/m3 |
80 μg/m3 |
|
2017 |
July |
17 μg/m3 |
25 μg/m3 |
80 μg/m3 |
|
2017 |
August |
14 μg/m3 |
25 μg/m3 |
80 μg/m3 |
|
2017 |
September |
24 μg/m3 |
25 μg/m3 |
80 μg/m3 |
|
2017 |
October |
28 μg/m3 |
25 μg/m3 |
80 μg/m3 |
|
2017 |
November |
27 μg/m3 |
25 μg/m3 |
80 μg/m3 |
|
2017 |
December |
07 μg/m3 |
25 μg/m3 |
80 μg/m3 |
|
2017 |
January |
85 μg/m3 |
25 μg/m3 |
80 μg/m3 |
|
2018 |
February |
79 μg/m3 |
25 μg/m3 |
80 μg/m3 |
|
2018 |
March |
73 μg/m3 |
25 μg/m3 |
80 μg/m3 |
|
2018 |
April |
67 μg/m3 |
25 μg/m3 |
80 μg/m3 |
PM 2.5 values were below the permissible limits set by WHO in 2017 & 2018 and below as per NAAQS.
Table 9 explains that NO2 concentration was below the permissible limits set by WHO in 2017 & 2018. And below the standards as per NAAQS. The lowest concentration was observed in the monsoon season, and the increase was observed in the winter and summer seasons.
Table 9: Comparison of the observed NO2 level values (measured for 24 hours) with the permissible limits suggested by WHO
|
NO2 Level |
||||
|
Year |
Month |
Hadapsar |
WHO |
NAAQS |
|
2017 |
May |
30 μg/m3 |
40 μg/m3 |
100 μg/m3 |
|
2017 |
June |
22 μg/m3 |
40 μg/m3 |
100 μg/m3 |
|
2017 |
July |
17 μg/m3 |
40 μg/m3 |
100 μg/m3 |
|
2017 |
August |
14 μg/m3 |
40 μg/m3 |
100 μg/m3 |
|
2017 |
September |
24 μg/m3 |
40 μg/m3 |
100 μg/m3 |
|
2017 |
October |
28 μg/m3 |
40 μg/m3 |
100 μg/m3 |
|
2017 |
November |
27 μg/m3 |
40 μg/m3 |
100 μg/m3 |
|
2017 |
December |
27 μg/m3 |
40 μg/m3 |
100 μg/m3 |
|
2018 |
January |
56 μg/m3 |
40 μg/m3 |
100 μg/m3 |
|
2018 |
February |
55 μg/m3 |
40 μg/m3 |
100 μg/m3 |
|
2018 |
March |
61 μg/m3 |
40 μg/m3 |
100 μg/m3 |
|
2018 |
April |
32 μg/m3 |
40 μg/m3 |
100 μg/m3 |
NO2 (24-hour measurement) was found to be below permissible limits set by WHO in 2017 & 2018 and below as per NAAQS
Table 10 shows that the concentration of SO2 was above the permissible limits set by WHO in 2017 & 2018. Moreover, below the standards set as per NAAQS. Increase in winter and summer season, lowest concentration was observed in monsoon season.
Table 10: Comparison of the observed SO2 level values (measured for 24 hours) with the permissible limits suggested by WHO
|
SO2 Level |
||||
|
Year |
Month |
Hadapsar |
WHO |
NAAQS |
|
2017 |
January |
27 μg/m3 |
20 μg/m3 |
60 μg/m3 |
|
2017 |
February |
24 μg/m3 |
20 μg/m3 |
60 μg/m3 |
|
2017 |
March |
21 μg/m3 |
20 μg/m3 |
60 μg/m3 |
|
2017 |
April |
19 μg/m3 |
20 μg/m3 |
60 μg/m3 |
|
2017 |
May |
11 μg/m3 |
20 μg/m3 |
60 μg/m3 |
|
2017 |
June |
10 μg/m3 |
20 μg/m3 |
60 μg/m3 |
|
2017 |
July |
9 μg/m3 |
20 μg/m3 |
60 μg/m3 |
|
2017 |
August |
9 μg/m3 |
20 μg/m3 |
60 μg/m3 |
|
2017 |
September |
8 μg/m3 |
20 μg/m3 |
60 μg/m3 |
|
2017 |
October |
53 μg/m3 |
20 μg/m3 |
60 μg/m3 |
|
2017 |
November |
48 μg/m3 |
20 μg/m3 |
60 μg/m3 |
|
2017 |
December |
47 μg/m3 |
20 μg/m3 |
60 μg/m3 |
|
2018 |
January |
43 μg/m3 |
20 μg/m3 |
60 μg/m3 |
|
2018 |
February |
42 μg/m3 |
20 μg/m3 |
60 μg/m3 |
|
2018 |
March |
40 μg/m3 |
20 μg/m3 |
60 μg/m3 |
|
2018 |
April |
38 μg/m3 |
20 μg/m3 |
60 μg/m3 |
SO2 values were found to be above permissible limits set by WHO in 2017 & 2018 and below as per NAAQS
Conclusion
Studied plants were found to show considerable reduction in total chlorophyll, ascorbic acid content, Leaf pH, relative water content, APTI of plant species in the summer and winter seasons of 2017. APTI indicated that all of the plants studied were sensitive to air pollution, and these plants can be recognized as Bio-indicators of air pollution in Hadapsar suburban. Also, it is essential to amend measures to reduce the industrial and vehicular emissions in the Hadapsar suburban.
Acknowledgement
The authors are grateful to Director, IITM, Pune, and Principal, Abeda Inamdar College.
Conflict of Interest
There is no conflict of interest.
Funding Sources
There is no funding sources.
References
- Lal, R., Sustainability, 2015, 7, 5875-5895
CrossRef - Kuhlman, T.; Farrington, J., Sustainability, 2010, 2(11), 3436-3448
CrossRef - Friedman, H., Journal of World-Systems Research, 2000, 6(2), 480-515
CrossRef - Hopwood, B.; Mellor, M.; Brien, G. O’, Sust. Dev., 2005,13, 38-52
CrossRef - Sadatshojaie, A.; Rahimpour, M. R.; Elsevier, 2020, 1-30
CrossRef - Seideman, S. C.; Smith, G. C.; Carpenter, Z. L.; Dutson, T. R.; Dill, C. W., Journal of Food Science, 1979, 44, 1036-1040
CrossRef - Raina, A. K.; Sharma, A., Indian Journal of Environmental Protection, 2003, 23, 897-902
- Hiremagalur, G., Environmental health perspectives, 2003, 111, A446-7
- McMichael, A. J., WHO Library Cataloguing-in-Publication Data, 2003, ISBN 92 4 156248 X, https://www.who.int/globalchange/ publications/ climchange.pdf
- Dockery, D. W.; Spengler, J., Journal of air pollution control association, 1981, 31, 153–159
CrossRef - Chauhan, A.; Joshi, P., N. Y. Sci. J., 2010, 3(2), 52-60.
CrossRef - Kim, D.; Chen, Z.; Zhou, L. F.; Huang, S. X., Chronic Dis Transl Med., 2018, 4(2), 75-94
CrossRef - Preston, E. M.; Tingey, D. T., Springer, Dordrecht., 1988, https://doi.org/10.1007/978-94-009-1367-7_4
CrossRef - Tiwari, S.; Agrawal, M.; Marshall, F., Environmental monitoring and assessment, 2006, 119, 15-30
CrossRef - Woo, S. Y.; Je, S. M.; J Plant Biol, 2006, 49, 315–9
CrossRef - Jiang, X. Q.; Mei, X. D.; Feng, D., J Thorac Dis., 2016, 8(1), E31-E40
- Devara, P.; Saha, S.; Raj, P.; Sonbawne, S.; Dani, K.; Tiwari, Y.; Maheskumar, R., Aerosol Air Qual. Res., 2005, 5, 103-114
CrossRef - Agbaire, P. O.; Esiefarienrhe, E., J Appl Sci Environ Manag, 2009, 13, 11–14
CrossRef - González, L.; González-Vilar, M., Reigosa Roger M.J. (eds) Handbook of Plant Ecophysiology Techniques. Springer, Dordrecht., 2001, https://doi.org/10.1007/0-306-48057-3_14
CrossRef - Arnon, D. I., Plant Physiol., 1949, 24(1), 1-15
CrossRef - Ahmad, B., Biochem J., 1935, 29(2), 275-281
CrossRef - Singh, S.; Verma, A., Phytoremediation of Air Pollutants: A Review. In: Singh S.N., Tripathi R.D. (eds) Environmental Bioremediation Technologies. Springer, Berlin, Heidelberg. 2007
- Muniyappa, K.; Nandini, N., International Journal Of Environmental Sciences, 2013, 4, 87-95
- Ramakrishnaiah, H.; Somashekar, R. K., Ecology, Environment and Conservation, 2003, 9, 337-343
- Tripathi, A. K.; Mukesh, G., Journal of environmental biology / Academy of Environmental Biology, India, 2007, 28, 127-32
- Shrestha, S.; Baral, B.; Dhital, N. B.; Yang, H. H., Sustain Environ Res, 2021, 31, 3
CrossRef - Gour, D. P.; Haritash, A. K., Intl J Environ Sci, 2016, 6, 979–986
- Rai, P.; Panda, L. S.; Mzu, B.; Singh, M., Afr. J. Environ. Sci. Technol., 2013, 7, 944-948
- Jain, S.; Bhattacharya, T.; Chakraborty, S., Advances in Waste Management, 2018,123-142
CrossRef
Second Review by: Dr. G. M. M. Anwarul Hasan
Final Approval by: Dr. Tanay Pramanik


![]()


