Distribution of Selected Dissolved and Particulate Heavy Metals in Lake Kenyir, Malaysia
Royston Uning , Fatin Adlina Md Nasir and Suhaimi Suratman*
Institute of Oceanography and Environment, Universiti Malaysia Terengganu, 21030 Kuala Nerus, Terengganu, Malaysia.
Corresponding Author E-mail: miman@umt.edu.my
DOI : http://dx.doi.org/10.13005/ojc/370606
Download this article as:
![]()
This study was conducted to determine the concentration and possible sources of dissolved and particulate heavy metals in Lake Kenyir, Terengganu, Malaysia. The heavy metals studied included Cd, Fe, Pb, Zn and Cu. The findings indicated that the mean concentrations found in the dissolved form for surface waters were in decreasing order of Fe>Zn>Pb~Cu>Cd. A similar trend was also recorded for the particulate form i.e., Fe>Zn>Pb~Cu>Cd. In terms of vertical distribution, most of the heavy metals showed a trend of increasing concentrations from the surface to the bottom waters. The main sources of heavy metals were from anthropogenic activities such as discharge of untreated sewage, surface runoff and boat activity. However, the levels of dissolved heavy metals were still lower compared to other study areas in Malaysia. The dissolved heavy metal concentrations were equivalent with Class II based on the National Water Quality Standard for Malaysia.
KEYWORDS:Distributiosn; Heavy Metals; Lake Kenyir; National Water Quality Standard
Introduction
A lake is a large area of water surrounded by land, which is not part of the ocean or any river but is usually drained by rivers and streams. Lake Bera, Lake Chini and Lake Mentiga are the largest natural lakes in Malaysia, and serve as sources of water for domestic use and industry and provide habitats for various types of biological species. There are also artificial lakes, which have been created in order to increase the domestic water supply, to supply industry and agriculture, hydroelectric power generation, flood mitigation, navigation or recreation1. Lake Kenyir is the largest artificial lake in Southeast Asia, and was constructed by the damming of two rivers, the Terengganu River and the Terengan River. Lake Kenyir is a popular tourist destination for nature and adventure lovers, and botanists and zoologists as it has a variety of flora, fauna and freshwater fish2. As Lake Kenyir has been successfully developed as a tourist destination, there are many water sport activities available such as kayaking, canoeing, boating and rafting and several houseboats are built around the lake, which provide sleep-on-board accommodation for tourists3.
However, the rapid urbanisation and increases in agriculture and industrialisation could contribute to the increment of heavy metal contamination in the lake systems as there will be large amounts of runoff wastes into the lake, including domestic sewage output, untreated effluents from industries, runoff from agricultural land and tourism wastes4. Although some heavy metals are required as micronutrients, they are very toxic and tend to accumulate5. Some heavy metals such as Hg, Pb, As, Cd, Fe, Co, Mn, and Cr can damage aquatic ecosystems and human health when present at concentrations exceeding the minimum requirements6. According to Ahmad et al.7, these metals may be retained in the water bodies or consumed by aquatic organisms, before being transferred to humans. Previous studies carried out in Lake Chini, Pahang reported that there was heavy metal content in Cabomba furcate, one of the aquatic plants found in this lake, even though the concentrations measured were lower than the critical toxic value7. This proved that aquatic plants absorb and accumulate metals into the plant cells.
In Malaysia, many studies on the concentration of heavy metals and the impacts of human activities on water quality have been carried out in locations such as Lake Bera1, Lake Chini7 and Lake Kenyir8. However, most of the studies were carried out over a short duration of time. Thus, the concentrations of heavy metals recorded were not actually represent for that particular area. Thus, a study has been carried out for one year to determine the current levels and distribution of heavy metals in Lake Kenyir and to compare with the National Water Quality Standard (NWQS) classification for Malaysia (Table 1). Data obtained in this study will be the reference data for future comparisons.
Table 1: National Water Quality Standards (NWQS) for Malaysia
|
Parameters |
Classes (μg/L) |
|||||
|
I |
IIA |
IIB |
III |
IV |
V |
|
|
Cd |
Natural levels or absent |
0.01 |
0.01 |
0.01*(0.001) |
0.01 |
Level above IV
|
|
Cu |
– |
– |
2.5 |
– |
||
|
Fe |
1 |
1 |
– |
– |
||
|
Pb |
0.05 |
0.05 |
0.02*(0.01) |
5 |
||
|
Zn |
5 |
5 |
0.4* |
2 |
||
|
Classes |
Uses |
|
I |
Conservation of natural environment Water supply I – Practically no treatment necessary Fishery I – Very sensitive aquatic species |
|
IIA |
Water supply II – Conventional treatment required Fishery II – Sensitive aquatic species |
|
IIB |
Recreational use with body contact |
|
III |
Water supply III – Extensive treatment required Fishery III – Common of economic value and tolerant species; livestock drinking |
|
IV |
Irrigation |
|
V |
None of the above |
Experimental
Lake Kenyir is located at the upstream end of Kenyir River, Terengganu (5° 12.902′ N, 102° 38.306′ E) in northeast Malaysia. The lake covers over 2,600 km2 and contains 340 small islands. The water levels differ depending on the season, being higher during the wet season (November to March) and lower during the dry season (May to September). Besides being a tourism attraction and destination, Lake Kenyir was created as part of hydroelectric plant in the dam to generate electricity and to bring a halt to annual flooding.
In this study, 14 stations were chosen within Lake Kenyir to collect the water samples for heavy metals analysis, including Fe, Zn, Pb, Cu, and Cd (Figure 1, Table 2). The stations were chosen based on the activities nearby the area. Most of the stations were surrounded with the natural habitats i.e. forest area. Human activities were found at station K4 which situated near to Pangkalan Gawi. Pangkalan Gawi is an area whereby there are boat jetties and chalets for tourists. For stations K1, K2, K3, K4, K5, K6, K7, K8, K9, and K10, only surface waters were sampled in order to determine the surface distribution of the parameters measured. In contrast, the water samples were collected from the surface, middle and bottom layers for stations T1, T2, T3, and T4 in order to determine the vertical profiles of the metals. Sampling surveys were carried out five times on 13/4/2014, 15/6/2014, 12/8/2014, 12/10/2014 and 16/2/2015. However, sampling could not be carried out in December 2014 due to bad weather and heavy rainfall.
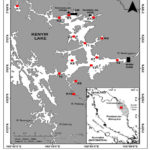 |
Figure 1: Location of sampling stations in Lake Kenyir |
Table 2: Coordinates of the sampling stations
|
Stations |
Longitude (E) |
Latitude (N) |
Stations |
Longitude (E) |
Latitude (N) |
|
K1 |
102° 40′ 28″ |
5° 10′ 28″ |
K8 |
102° 47′ 32″ |
5° 1′ 20″ |
|
K2 |
102° 45′ 52″ |
5° 8′ 30″ |
K9 |
102° 47′ 60″ |
4° 57′ 53″ |
|
K3 |
102° 47′ 7″ |
5° 8′ 55″ |
K10 |
102° 47′ 45″ |
4° 55′ 42″ |
|
K4 |
102° 50′ 17″ |
5° 8′ 33″ |
T1 |
102° 49′ 12″ |
5° 4′ 14″ |
|
K5 |
102° 47′ 45″ |
5° 5′ 21″ |
T2 |
102° 53′ 22″ |
5° 1′ 24″ |
|
K6 |
102° 51′ 23″ |
5° 5′ 2″ |
T3 |
102° 50′ 0″ |
5° 0′ 31″ |
|
K7 |
102° 50′ 43″ |
5° 1′ 51″ |
T4 |
102° 45′ 53″ |
4° 59′ 9″ |
Triplicate of 1 L water samples were collected from the surface water at about 0.1 m depth, middle water (13–15 m) and bottom water (30 m) using a Van Dorn Sampler and stored in acid-washed high-density polyethylene (HDPE) bottles. The bottles were kept in an ice chest during the sampling trips. Water samples for dissolved metal determination were filtered through pre-combusted (450 °C) Whatman GF/F glass fibre filters using a vacuum pump. The filtration was carried out in a Class 100 laminar flow cabinet and under low vacuum (<30 mm Hg). The filtrates were acidified with ultrapure nitric acid (HNO3)(65%) up to pH <2 for dissolved heavy metal determination. The particulate samples on top of the filters were placed in petri dishes for further analysis of the particulate heavy metal concentrations.
The dissolved metals were determined using preconcentration-complexation treatment before applying the Magnusson and Westerlund method9. A liquid-liquid extraction was used to extract heavy metals from the filtered samples. In brief, 5 mL of 1% ammonium 1-pyrolidinedithio carbamate (APDC) was added to the 200 mL of filtered samples in a separating funnel and the mixture was shaken to make it well-mixed. 6 mL of methyl isobutyl ketone (MIBK) was added into the previous mixture and then was shaken again until two layers were formed (organic and aqueous layers). The aqueous layer was separated and left the organic layer. The second extraction was conducted in other separating funnel with the same method but was replacing with 4 mL of MIBK. The aqueous layer was then discarded. The organic layer from the first extraction was mixed with the organic layer from second extraction. Then, 10 mL 2M of HNO3 was added in the organic layer and shake again. The acid layer was separated and then were analysed using inductively coupled plasma-optical emission spectrometry (ICP-OES). Meanwhile, the determination of particulate metals was based on Chen and Ma10. An acid mixture of 1.5 mL of hydrochloric acid (HCl), HNO3 and hydrogen fluoride (HF) in a ratio of 3:3:1 (v:v:v) respectively was used for particulate sample digestion. The samples were also analysed using the ICP-OES. All samples were analysed in triplicate and the repeatability of the same samples were within the range of 90–110%.
Results and Discussion
Horizontal distribution of heavy metals
Dissolved heavy metals
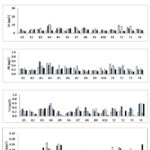 |
Figure 2: Concentrations of dissolved heavy metals for horizontal distribution in Lake Kenyir |
Fig. 2 shows the horizontal distribution of dissolved heavy metals in Lake Kenyir. Fe recorded the highest concentrations, ranging from 1.42–26.75 (mean 7.29±4.32) µg/L, followed by Zn, Pb, Cu, and Cd with values of 0.28–10.90 (mean 4.48±2.17) µg/L, 0.10–0.57 (mean 0.26±0.10) µg/L, 0.02–0.60 (mean 0.25±0.14) µg/L and 0.01–0.07 (mean 0.03±0.01) µg/L, respectively. Based on two-way ANOVA test, it was shown that there were significant differences between the concentrations of heavy metals with sampling station (p<0.05) and the sampling date (p<0.05).
In general, the highest concentration of Fe was observed at station K4 with the range between 9.31–26.75 μg/L while the lowest was at station K1 with the range between 3.07–6.27 μg/L. For Zn, a higher concentration was recorded at station K4 with the range between 3.77–10.90 μg/L and a lower concentration at K1 in the range of 1.36–4.87 μg/L. Meanwhile, for Pb, the highest concentration was measured at K4 (0.33–0.51 μg/L) and the lowest at K9 (0.14–0.19 μg/L). On the other hand, the highest concentration of Cd was observed at station K4 with the range between 0.03–0.67 μg/L and the lowest was at station K1 with the range between 0.12–0.25 μg/L. Meanwhile for Cu, the highest concentration was also recorded at K4 (0.31–0.60 μg/L) but the lowest was at K5 (0.03–0.24 μg/L).
For all sampling dates, the concentrations of heavy metals fluctuated. For example, Fe was found to be highest in June and lowest in April, while Zn was highest in August and lowest in April. For Pb, the highest concentration was recorded in June and the lowest was recorded in August. Meanwhile for Cd and Cu, the highest concentrations were measured in April and August respectively and the lowest in October and August respectively.
The data obtained showed that all the heavy metals were found at the highest concentrations at station K4 compared to the other stations. This was probably because station K4 was located near to Pangkalan Gawi, the main gateway to Lake Kenyir. There are boat jetties and several chalets and lodges located around this area, which may have contributed to the increment of heavy metals concentrations in the water. The anthropogenic activities such as direct disposal and water runoff from the chalets and resorts, boats and tourism activities around this area may have led to high concentrations of heavy metals in surface water. According to Hussain and Abdullah11, the wastes from the boathouses have been flushed out into the water bodies, as there are no septic tanks provided with the operating boathouses. Previous studies at other study areas also reported that higher concentrations of metals were found in aquatic environments caused by anthropogenic activities that were linked with boating and fisheries activities and various tourism activities that grew rapidly in that area12,13.
Based on the NWQS classification14, the mean concentrations of all dissolved heavy metals for all stations were in Class II, which indicates that Lake Kenyir has slightly higher levels compared to natural levels. This is because most of the sampling stations were located near to active development. However, this classification states that the water is suitable for water supply with conventional treatment, recreational activities where body contact is allowed and is suitable for fishing activities.
Particulate heavy metals
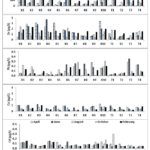 |
Figure 3: Concentrations of particulate heavy metals for horizontal distribution in Lake Kenyir |
Fig. 3 shows the distribution of particulate heavy metals in Lake Kenyir. Fe recorded the highest concentration ranging from 8–365 (mean 94±71) µg/L, followed by Zn, Cu, Pb, and Cd with the values of 0.27–3.71 (mean 1.39±0.81) µg/L, 0.01–1.25 (mean 0.52±0.31) µg/L, 0.01–0.36 (mean 0.10±0.03) µg/L and 0.01–0.19 (mean 0.09±0.04) µg/L, respectively.
For the particulate heavy metals, the highest concentration of Fe was obtained at K1 with the range 102–365 μg/L while the lowest was at station K7 with the range 8–86 μg/L. For Zn, the concentrations were recorded higher at station K4 with the range 0.59–3.71 μg/L and lower at T3 in the range 0.27–1.33 μg/L. Meanwhile, for Pb, the highest concentrations were measured at K10 (0.17–0.32 μg/L) and lowest at T1 (0.02–0.05 μg/L). On the other hand, the highest concentrations of Cd were observed at station K1 with the range 0.12–0.16 μg/L and the lowest was at station T4 with the range 0.02–0.05 μg/L. For Cu, the highest concentrations were also recorded at K10 (0.29–1.25 μg/L) but the lowest at K7 (0.14–0.63 μg/L).
The distributions of particulate heavy metals in Lake Kenyir fluctuated for every sampling survey. In general, the highest concentrations of Fe were measured in June and the lowest concentrations were measured in April. For Zn, the highest concentrations were obtained in June and the lowest in April. Meanwhile for Pb, the highest values for both heavy metals were found in June. However, the lowest value for Pb was found in October. The maximum values for Cd were recorded in October and the minimum values were recorded in April. For Cu, the maximum concentrations were measured in June and the minimum concentrations were recorded in April.
Based on a two-way ANOVA, it was shown that there were significant differences between the concentrations of metals with sampling station (p<0.05) for Fe, Pb, and Zn but no significant differences (p>0.05) for Cd and Cu. The concentrations of heavy metals with sampling date showed significant differences (p<0.05) for Zn and Cu but no significant differences (p>0.05) for Cd, Fe, and Pb. From the obtained data, it was shown that the concentrations of all heavy metals were higher at stations K1 and K10 with a range between 0.03 µg/L and 365.0 µg/L. This was probably because Station K1 is near River Petuang and Station K10 is near River Petang. Soil erosion may be one of the main causes that influenced the elevated heavy metals concentrations in the river as the soil is transferred into the lake during rainfall. Runoff from domestic and agricultural activities into the river can contribute to the contents of heavy metals in the lake. According to Ahmad et al.15, heavy metal concentrations were higher due to the runoff from natural land composition. The authors reported that anthropogenic activities such as agriculture, plantation and industrialisation along the river were the factors that caused soil erosion in their study area15.
Vertical distribution of heavy metals
Dissolved heavy metals
The vertical distributions of heavy metals for dissolved samples in Lake Kenyir are illustrated in Fig 4. The depth profiles (surface, middle and bottom) were taken at T1, T2, T3 and T4. Based on a two-way ANOVA, it was shown that there were significant differences between the concentrations of every metal with the sampling station (p<0.05) and the sampling date (p<0.05).
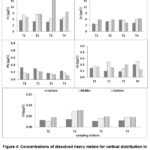 |
Figure 4: Concentrations of dissolved heavy metals for vertical distribution in Lake Kenyir |
The data clearly indicated that most of the concentrations of Zn, Fe, Al, and Cd were higher in the bottom water compared to the surface water, while Pb and Cd had higher concentrations in the surface water compared to the bottom water. The increased heavy metals concentrations in the bottom water could be due to geological sources as lake sediments are major repository of heavy metals, from which the metals could be released to the overlying water column as environmental conditions change16,17. The concentrations of Pb and Cd were higher in the surface water compared to the bottom water, showing that there were some inputs of pollution to the surface water of Lake Kenyir, such as the contamination caused by the navigation of motorboats on the lake. As reported by Nhapi et al.18, the concentrations of Pb and Cd were found to be highest in Lake Muhazi due to boating activities on the lake. The mixing between the surface water and the bottom water due to the movement of water bodies can contribute to the increase of heavy metals in the middle water. This can be observed in the present study when the concentrations of Cu were measured highest in the middle water of the lake during the T1, T2 and T4 sampling.
Particulate heavy metals
The vertical distributions of heavy metals for particulate samples in Lake Kenyir are illustrated in Figure 5. Based on two-way ANOVA analysis, it was shown that there were significant differences between the concentrations of heavy metals with sampling stations (p<0.05) for Al, Fe, Pb, and Zn but no significant differences (>0.05) for Cd and Cu. The concentrations of heavy metals with sampling date showed significant differences (<0.05) for Al, Zn, and Cu but no significant differences (>0.05) for Cd, Fe, and Pb.
 |
Figure 5: Concentrations of particulate heavy metals for vertical distribution in Lake Kenyir |
In general, the metal contents of the water samples were significantly higher in the bottom layer compared to the middle layer, followed by surface layer, except for Cu, which was higher in the surface water than the middle and bottom layers. This probably indicated that re-suspension of the bottom sediment released the heavy metals into the water column, increasing the heavy metal concentrations in the bottom water16. As suggested by Abdullah et al.13, the existence of metals (Fe, Zn, Co, Pb, and Cu) in water can be correlated with the weathering process of rocks, bedrock erosion processes and ore deposition in water bodies. The decay of algae and dead trees in the lake may also contribute to the heavy metal levels in the bottom water of Lake Kenyir. A previous study by Suratman et al.19 also observed the death of algae and trees that had sunk to the bottom of the lake and remained there, as there was thermal stratification downward in the lake and a hypolimnion layer was found at a depth of 30 m in the lake. Thus, this condition can explain why the concentration of particulate heavy metals was higher in the bottom water of the present study. However, for Cu, the concentration was found to be higher in the surface water compared to the middle and bottom water, showing that there was some input of pollutants at the surface water. These were probably due to the activities around the sampling area and sewage waste that had been discharged into the lake. The variations in Cd, Cu and Zn concentrations in lake water can also be influenced by bioaccumulation and primary production20.
Data obtained for dissolved heavy metals in surface water in this study were compared with data from other lakes in Malaysia (Table 3). No comparison could be made for particulate heavy metals as the data are quite scarce. Comparison was also made with Lake Hauroko, New Zealand as this lake can be considered a pristine freshwater lake as it is situated in a remote area and minimally affected by anthropogenic contaminants21. All heavy metals recorded in Lake Kenyir were at slightly higher concentrations compared to those in Lake Hauroko, which suggests human activities such as the discharge of untreated sewage, surface runoff and boats and tourism activities within Lake Kenyir contributed to the heavy metals found there. With the exception of Cu, other heavy metal concentrations in Lake Kenyir were within a range similar to Lake Titiwangsa22. Lake Titiwangsa is a recreational park on a small scale, the main source of water being rainwater, thus low concentrations of heavy metals were found in this lake. On the other hand, higher concentrations of heavy metals were recorded at lakes around Miri23 and Lake Cempaka24. This is not surprising as the lakes situated in Miri are in the major settlement, agricultural and industrial areas and recreational centres. Thus, the heavy metals concentrations were likely to arise from this variety of sources. The sources of heavy metals in Lake Cempaka were from areas surrounding the lake such as commercial areas, hospitals, clinics, and residential areas as are typical for an urban stream.
Table 3: Comparison of dissolved heavy metals concentrations (µg/L) within the selected lake
|
Lake |
Fe |
Zn |
Pb |
Cd |
Cu |
|
Lake Hauroko, New Zealand [21] |
4.87–5.95 |
0.05–0.06 |
0.01–0.02 |
0.0001–0.0010 |
0.22–0.23 |
|
Lake Titiwangsa, Kuala Lumpur [22] |
– |
9.92–10.14 |
0.71–0.73 |
0.08 |
4.93–5.93 |
|
Lake around Miri City, Sarawak [23] |
60.65–1,508.37 |
7.38–298.10 |
– |
0.53–2.74 |
5.42–55.39 |
|
Lake Cempaka, Selangor [24] |
1030–4410 |
10–30 |
1–2 |
0.1–0.2 |
0.7–21 |
|
Lake Kenyir (This study) |
1.42 –26.75 |
0.28 –10.90 |
0.10–0.57 |
0.01–0.07 |
0.02–0.60 |
Conclusion
The present study revealed that the concentrations of dissolved heavy metals were in the decreasing order Fe>Zn>Pb~Cu>Cd and an almost similar trend was observed for the particulate form. In addition, there were increasing concentrations of most metals going from the surface to the bottom waters. Anthropogenic activities play an important role in increasing the heavy metals contained especially at Pangkalan Gawi, but the levels were still low compared to other lakes in Malaysia. In addition, some stations also record high concentrations of particulate metals due to soil erosion during rainfall runoff events because they were near the rivers. The results of all dissolved metal concentrations were equivalent with Class II based on the NWQS classification. It is suggested that future sampling should be carried out for proper management of the lake.
Acknowledgement
This study was supported by Ministry of Education, Malaysia (Fundamental Research Grant Vote No. 59313). The assistance of Miss Nor Izwani Mohd Isa in the sampling and analysis is kindly acknowledged. Thanks to Dr. Rose Norman for assistance with proof reading of the manuscript.
Conflict of Interest
The authors declare that they have no conflict of interest.
Funding Sources
There are no funding source.
References
- Gharibreza, M.; Raj, J. K.; Yusoff, I.; Othman, Z.; Tahir, W. Z. W. M.; Ashraf, M. A.; Land Use Changes and Soil Redistribution Estimation using 137Cs in the Tropical Bera Lake Catchment, Malaysia. Soil and Tillage Research, 2013, 131, 1–10.
CrossRef - Kamarudin, M. K. A.; Wahab, N. A.; Jalil, N. A. A.; S.; Saad, M. H. M.; Water Quality Issues in Water Resources Management at Kenyir Lake, Malaysia. Jurnal Teknologi, 2020, 82, 1-11.
CrossRef - Suratman, S.; Hee, Y. Y.; Tan, H. S.; A Preliminary Study of The Distribution of Phosphorus and Silicon Compounds in Tasik Kenyir, Hulu Terengganu, Malaysia. Journal of Sustainability Science and Management,2015, 10, 35–41.
- Saleem, M.; Iqbal, J.; Shah, M. H.; Seasonal Variations, Risk Assessment and Multivariate Analysis of Trace Metals in the Freshwater Reservoirs of Pakistan. Chemosphere, 2019, 216, 715-724.
CrossRef - Karimi, A.; Naghizadeh, A.; Biglari, H.; Peirovi, R.; Ghasemi, A.; Zarel, A.; Assessment of Human Health Risks and Pollution Index for Heavy Metals in Farmlands Irrigated by Effluents of Stabilization Ponds. Environmental Science and Pollution Research, 2020, 27, 10317-10327.
CrossRef - Benoit, K. K.; Seraphin, K. K.; Felix, K. K.; Charles, B. K.; lazare, K. K.; Heavy Metals Contamination of an Aquatic Environment and Health Risks Assessment in Two Fish Species: Case of the Guessabo Lake, Western Cote d’Ivoire. Oriental Journal of Chemistry, 2019, 35, 1742-1755.
CrossRef - Ahmad, A. K.; Shuhaimi-Othman, M.; Hoon, L. P.; Heavy Metal Concentrations in Fanworth (Cabomba furcata) from Lake Chini, Malaysia. International Journal of Environmental and Ecological Engineering, 2010, 4, 140–143.
- Hee, Y. Y.; S. Suratman, S.; Assessment of Trace Metals Distribution in Lake Kenyir, Malaysia. Asian Journal of Chemistry, 2018, 30.
CrossRef - Magnusson, B.; Westerlund, S.; Solvent Extraction Procedures Combined with Back-Extraction for Trace Metal Determinations by Atomic Absorption Spectrometry. Analytica Chimica Acta, 1981, 131, 63–72.
CrossRef - Chen, M.; Ma, L. Q.; Comparison of Three Aqua Regia Digestion Methods for Twenty Florida Soils. Soil Science Society of America Journal, 2001, 65, 491–499.
CrossRef - Hussain, N. I.; Abdullah, M. H.; The Assessment of Water Quality and Metals Concentration in Surface Water of Kenyir Lake. Malaysian Journal of Applied Sciences, 2018, 3, 71–89.
- Painting, S. Z.; Nelson, P.; Sminth, A. J.; Graves, C. A.; Powell, A.; Bersuder, P.; Bullen, S.; Archer-Rand, S.; Marine Water Quality at Diego Garcia: A Preliminary Study of Pollution Levels in Coastal and Lagoon Waters. Frontiers in Marine Science, 2021, 8, Article 671319.
CrossRef - Abdullah, M. Z.; Manap, A. R. A.; Saat, A.; Hamzah, Z.; M.T. Abas, M. T.; Evaluation of Heavy Metal Contamination Levels of Balok River Sediments in Pahang, Malaysia Based on Geoaccumulation Index and Supported with Enrichment Factor. Malaysian Journal of Analytical Sciences, 2015, 19, 707–714.
- Department of Environment (DOE); Malaysia Environmental Quality Report 2010. Ministry of Environment and Water Malaysia, 2019, PP. 194.
- Ahmad, A. K.; Mushrifah, I.; Shuhaimi-Othman, M.; Water Quality and Heavy Metal Concentrations in Sediment of Sungai Kelantan, Kelantan, Malaysia: A Baseline Study. Sains Malaysiana,2009, 38, 435–442.
- Kong, M.; Zhu, Y.; Han, T.; Zhang, S.; Li, J.; Xu, X.; Chao, J.; Zhang, Y.; Gao, Y.; Interactions of Heavy Metal Elements Across Sediment-Water Interface in Lake Jiaogang. Environmental Pollution, 2021, 286, Article 117578.
CrossRef - Taneez, M.; Jamil, S.; Ramzan, M.; Water Quality Assessment and Identification of Pollution Risk in High-Altitude Saiful Muluk Lake, North East, Pakistan. Water, Air and Soil Pollution, 2021, 232, Article 230.
CrossRef - Nhapi, I.; Wali, U. G.; Usanzineza, D.; Kashaigili, J. J.; Banadda, N.; Kimwaga, R.; Distribution of Heavy Metals in Lake Muhazi, Rwanda. The Open Environmental Engineering Journal, 2012, 5, 96–102.
CrossRef - Suratman, S; Bedurus, E.; Seng, T. H.; A Preliminary Study of the Distribution of Nitrogen Compounds in Tasik Kenyir, Malaysia. Oriental Journal of Chemistry, 2017, 33, 1325–1330.
CrossRef - Ting, Y. P.; Lawson, F.; Prince, I. G.; Uptake of Cadmium and Zinc by the Alga Chlorella vulgaris: Part 1. Individual Ion Species. Biotechnology and Bioengineering, 1989, 34, 990–999.
CrossRef - Sander, S. G.; Anderson, B; Reid, M. R.; Kim, J. P.; Hunter, K. A.; Trace Metal Chemistry in the Pristine Freshwater Lake Hauroko, Fiordland, New Zealand. Microchemical Journal, 2013, 111, 74–81.
CrossRef - Said, K. S.; Shuhaimi-Othman, M.; Ahmad, A. K.; The Evaluation of Water Quality and Metal Concentrations of Titiwangsa Lake, Selangor, Peninsular Malaysia. Pakistan Journal of Biological Science, 2012, 15, 459–468.
CrossRef - Prasanna, M. V.; Nagarajan, R., Chidambaram, S.; Elayaraja, A.; Assessment of Metals Distribution and Microbial Contamination at Selected Lake Waters in and Around Miri City, East Malaysia. Bulletin of Environmental Contamination and Toxicology, 2012, 89, 507–511.
CrossRef - Gasim, M. B.; Toriman, M. E.; Barggig, A.; Mutfah, S.; Hairoma, N.; Endut, A.; The Evaluation of Heavy Metals Concentrations in Cempaka Lake, Bangi, Selangor, Malaysia. International Journal on Advance Science Engineering Information Technology, 2017, 7, 453–459.
CrossRef
Second Review by: Dr. Muwafaq Rabeea
Final Approval by: Dr. Attilio Naccarato


![]()


