Oily Sludge Recovery using Microwave Pyrolysis Technique
Khamael M. Abualnaja1 , Hala M. Abo-Dief1*, Ola A. Abu Ali1, Abdullah Al-Anazi1 and Ashraf T. Mohamed2
1Department of Chemistry, Al-Taif Faculty of Science, Al-Taif University, Al-Taif, KSA.
2Department of Design and Production, Faculty of Engineering, Minia University, Minia, Egypt.
Corresponding Author E-mail: Mohamed.hala91@yahoo.com
DOI : http://dx.doi.org/10.13005/ojc/370104
Download this article as:
![]()
The oily sludge treatments catch widespread attention. But, management of sludge is difficult and costly undertaking. The oil recovery pyrolysis temperature, heating rate and carbon wt.% is discussed. The recovered aliphatic, aromatic, elemental components and gases were obtained with respect to the nitrogen flow rate. The present work showed that as the heating rate increases, both the %pyrolysis oil and gases increases up to 600 OC, while the %pyrolysis char decreases. Beyond 600 OC, the pyrolysis gases% increases, the pyrolysis oil% decreases while the %pyrolysis char continuous decreases. Gas chromatography, and calorific value used to examine the hydrocarbon compositions of the virgin, sludge, and pyrolysis oils.
KEYWORDS:Calorific Value; Heating Rate Carbon wt.%; Oil Recovery Gas Chromatography; Microwave; Oil Recovery Temperature; Virgin Sludge Pyrolysis Oils
Introduction
The fossil fuels largest consumption with the energy challenge, environmental sustainability, and cleaner energy requirements attracted interest in recent years, [1-2]. Bilo’o, and Benoît [3] stated that alternate sources such as renewable energy are required. The goal of many countries to increase their economies income is crude oil, despite the outcome that has towards the environment. Oil wastes making dangerous risk for human health and natural, [4-5]. Oily sludge generated during the production, transportation, storage and in the oil refinery plants, [6-7]. Abo-Dief et al. [8] produced biodiesel from five fresh vegetable oils. Roozbehani [9] discussed the potentials and the related issues of combusting crude oil sludge to obtain the best concentration with three main factors, including pH, bio-surfactant concentration and salinity. Through adding manure, Liu et al. [10] and Kumar and Mohan [ 11] conducted bioremediation of oily sludge. Gozan [12] showed that the sludge oil range from benzene, phenols to polycyclic aromatic hydrocarbons, but Hu et al. [13] stated that little attention paid to handle crude oil. Islam [14] found that the sludge containing recoverable oil less than 40%. Chen et al. [15] examined the sewage sludge pyrolysis process for pyrolytic oil.
Abualnaja and Abo-Dief [1] recovered 90% of oily sludge using ultrasonic method. Almasi et al. [16] discussed the main effects of ultrasonic sludge. Mwamlima [17] concluded that the slow-pyrolysis reactor was relatively simple to operate for trained staff. Rogers and Brammer [18] designed a model takes account sales of Pyrolysis bio-char. Barry et al. [19] defined that Pyrolysis is viable as a thermally self sufficient process to transform sewage sludge into biochar. Orabi et al. [20] discussed the N2 flow rate effects on the pyrolysis products of the used oil. Abo-Dief et al. [21] used the microwave energy to pyrolysis the automotive engine oil using the microwave energy. The present work aiming at recovering sludge oil using the pyrolysis technique at various pyrolysis temperature, heating rate and carbon wt.%. The recovered aliphatic, aromatic, elemental components and gases obtained at various values of nitrogen flow rates. Also, the variation of the microwave pyrolysis energy and the pyrolysis gases calorific values with microwave pyrolysis temperature detected.
Experimental
During the periodical cleaning at an oil refinery in the Egyptian east cost of the red sea, the sludge collected from the tanks bottom. The sludge heated to 100°C for 12 hr to remove moisture and cooled to room temperature (16°C). Microwave oil pyrolysis device shown in Fig. 1. The sludge elemental contents; C, H, N, S, and O detected. The total ion content percentage (TIC%) measured. The calorific value of the pyrolysis gases calculated.
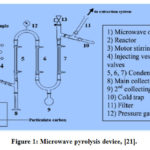 |
Figure 1: Microwave pyrolysis device, [21]. |
25 g feedstock with nitrogen gas flow rate ranging from 50 to 1000 mL/min used. Samples heated to temperatures of; 400, 500, 600, 700 and 800 OC at a heating rate ranging from 10OC/min to 25OC/min for carbon/sludge wt.% ranging from 25% to 100%. The pyrolysis oil collected and weighed. The specific gravity, the higher heating value , and water content used to specify the pyrolysis oil properties. The hydrocarbon composition and calorific value of the pyrolysis oil determined and compared with that of both virgin and sludge oils.
Results and Discussions
Effect of Temperature
Fig. 2 illustrated the temperature effect on the % pyrolysis oil, gas and char with various values of heating rates at 0% CC and 25%CC. As the test temperature increases, the pyrolysis oil % increases up to 600OC followed by rapid decrement, the % pyrolysis gases increases gradually up to 600 OC followed by rapid increment and the pyrolysis char continually due to the sludge oil vaporization in agreement with [21]. The higher amounts of gaseous products related to the hydrocarbons cracking into smaller molecules in agreement with Lam et al. [22].
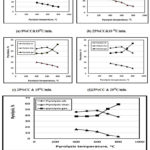 |
Figure 2: Effect of heating rate on pyrolysis products wt.% at 25 wt.% carbon at various temperatures. |
Effect of Carbon Content wt.% (CC)
Fig. 3 illustrated the variation of % pyrolysis oil, gas and char with various values of wt.% of carbon content (%CC) at different test temperature values and 25 OC/min heating rate. It is found that, the values of %pyrolysis oil are; 43.53, 48.17, 49.17, 50.17 and 53.8%, the values of %pyrolysis gases are; 43.19%, 39.76%, 36.72, 40.76, and 38.13. The values of pyrolysis char are; 13.28%, 12.07, 10.07, 09.07and 8.07 at 0%, 25%, 50%, 75% and 100% carbon wt.% respectively and 600 OC. So, as the carbon wt.% increases, the % pyrolysis oil increases up to 600OC. Over 600OC, the % pyrolysis oil decreases continuously due to the cracking of the sludge oil hydrocarbons. The char values continually decreases with carbon wt.% increment, [22]. The oily sludge total petroleum hydrocarbon (TPH) contents values are within the previous investigators in agreement with Mohan and Chandrasekhar, [23].
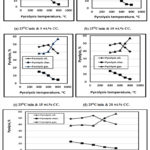 |
Figure 3: Effect of carbon wt.% on pyrolysis products wt.% at 25OC/min HR and various temperatures. |
Effect of N2
Fig. 4 illustrated the N2 effect on the aliphatic. Up to 50 ml/min N2, the aliphatic components increase. Between 50 and 800 ml/min N2, the alkanes increases rapidly, the alkenes increases slightly and the naphthenic decreases. Over 800 ml/min N2, the alkanes increases slightly, the alkenes without any change in pause and the naphthenic continually decreases, in agreement with [22].
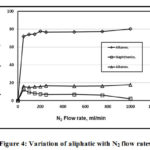 |
Figure 4: Variation of aliphatic with N2 flow rates. |
Fig. 5 illustrated the variation of light aromatics %wt.; benzene, toluene, xylene and alkyl-benzenes that found in the pyrolysis oils at various values of N2 flow rates. Up to 50 ml/min N2 flow rate, all the light aromatics wt% increases, toluene has higher increment value followed by benzene, alkyl-benzenes and xylene respectively. With N2 flow rate increment up to 1000 ml/min, the alkyl-benzenes increases while toluene decreases followed by both benzene and xylene respectively.
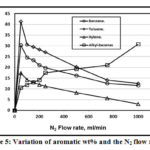 |
Figure 5: Variation of aromatic wt% and the N2 flow rates. |
Figures 6 to 10 showed a comparison between pyrolysis , fresh and sludge oils constituents wt.% with N2 flow rates. Figure 6 showed that the pyrolysis oil has the higher carbon wt.% compared to both fresh and sludge oils due to the carbon added to the reactor. With N2 flow rated increment, the pyrolysis oil carbon wt.% decreases since the pyrolysis process heating medium provides chemical reduction of both carbon and oxygen while both fresh and sludge oils have constant values of carbon. Fresh oil carbon wt.% is higher than that of sludge oil since the ignition process that used carbon is not carried yet. Fig. 7 showed that with N2 flow rates increment, sludge oil has higher constant hydrogen wt.% due to the dehydrogenation and aromatization processes occurred in agreement with Guri et al. [4]
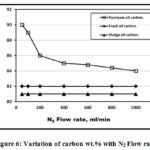 |
Figure 6: Variation of carbon wt.% with N2 Flow rate. |
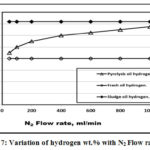 |
Figure 7: Variation of hydrogen wt.% with N2 Flow rate. Click here to View figure |
Figure 8 illustrated that the pyrolysis oils has a lower oxygen wt.% compared to both fresh and sludge oils due to the use of oxygen in carbon bed heating that required in the pyrolysis operation and decarboxylation occurring during thermal treatment processes in agreement with [7]. Figure 9 showed that the pyrolysis oil has a higher N2 wt.% due to the extra N2 purge gas. The lower sludge oil N2 wt.% related to that consumed in the production of gases and char, [19]. Figure 10 illustrated that pyrolysis oil has a lower sulphur wt.% compared to the both sludge and fresh oils due to the sulphur oxides that generated during the pyrolysis process in agreement with Lima et al. [6].
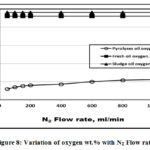 |
Figure 8: Variation of oxygen wt.% with N2 Flow rate. |
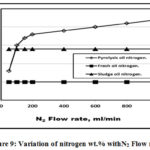 |
Figure 9: Variation of nitrogen wt.% withN2 Flow rate. |
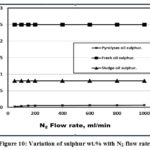 |
Figure 10: Variation of sulphur wt.% with N2 flow rate. |
Figure 11 showed the relation between the microwave pyrolysis energy and temperature for pyrolysis liquids, gases and solids. It is clear that up to 200 OC all the constituents energies increases, while from 200OC to 600OC, both liquids and gases energies increases with an optimum liquids value but the solid energy decreases. After 600OC, the gases energy increases rapidly due to the temperature effect that generated pyrolysis volatiles while both liquids and solids energies decreases in agreement with Lam et al. [22].
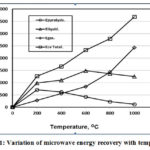 |
Figure 11: Variation of microwave energy recovery with temperature. |
Calorific Value
Fig. 12 showed that with temperature increment, there is a sharp increases of propene followed by ethene and methane repectivele and a stepless increment of propane and ethane. Both butanes and butenes calorific values decreases with temperature increment in agreement with [4].
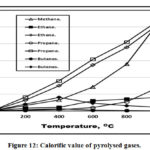 |
Figure 12: Calorific value of pyrolysed gases. Click here to View figure |
Conclusions
Sludge recovered successfully and generated valuable products. As the heating rate increases, both the %pyrolysis oil and gases increases up to 600 OC, while the %pyrolysis char decreases. Beyond 600 OC, the pyrolysis gases% increases, the pyrolysis oil% decreases and the % pyrolysis char continuous decreases. With the increment of N2 flow rate, the pyrolysis oil nitrogen, hydrogen and oxygen increases, while both fresh and sludge oils have no change values. As N2 flow rates increases, the pyrolysis oil carbon wt.% decreases with non-change values of sulphur wt.%, while there is no change of both carbon wt.% and sulphur wt.% value occurred for both fresh and sludge oils with N2 flow rates. The pyrolysis oil contained higher carbon and nitrogen contents with lower oxygen, hydrogen and sulphur contents compared to both fresh and sludge oils. 600OC is the ideal temperature for recovering pyrolysis sludge oil.
References
- Abualnaja, K.; Abo-Dief, H. Asian Journal of Chemistry, 2018, 30, 2641-2646.
CrossRef - Hanif, M.; Capareda, S.; Iqbal, H.; Arazo, R.; Baig, M. Plosone, 2016, 1-11.
CrossRef - Bilo’o, Z.; Benoît, N. International Journal of Environmental Sciences, 2013, 3, No 5, 1373- 1382.
- Guri, A.; Guri, S.; Lubonja, O. Academic Journal of Interdisciplinary Studies MCSER, 2013, 2, 626-634.
- Jadoon, S.; Malik, A.; Amind, A. Chemistry and Materials Research, 2017, 9, 5-12.
- Lima, C.; Lima, R.; Fabiula, E.; Silva, B.; Kelly, K.; Filho, O.; Soares, S.; Araújoc, A. Rev. Virtual Quim., 2014, 6, 1160-1171.
- Islam, B.; Int. J. Chem. Sci., 2015, 13, 1584-1602.
- Abo-Dief, H.; Emam, A.; Abualnaja, K.; Mohamed, A. Oriental Journal of Chemistry (OJC), 2018, 34, 1011-1015.
CrossRef - Roozbehani, B.; Saadat, A.; Jaafarzadeh, N. American Journal of Oil and Chemical Technologies, 2013, 1, 10-16.
CrossRef - Liu, W.; Luo, Y.; Teng, Y.; Li, Z.; Ma, L. Environ Geochem Health, 2010, 32, 23–29.
CrossRef - Kumar, B.; Mohan, R. International Journal of Engineering Research & Technology (IJERT), 2013, 2, 359-370.
- Gozan, M. Energy and Environment Research, 2014, 4, 22-28.
CrossRef - Hu, G.; Li, J.; Zeng, G. Journal of Hazardous Materials, 2013, 261, 470-490.
CrossRef - Islam, B. Int. J. Chem. Sci, 2015, 13, 1584-1602.
- Chen, G.; Li, J.; Lin, H.; Wu F.; Chao, Y. Energies, 2018, 11, 1-17.
CrossRef - Almasi, A.; Mosavi, A.; Mohammadi, M.; Azemnia, S.; Godini, K.; Zarei, A.; Mohammadi, S.; Saleh, E. Global NEST Journal, 2016, 18, 771-777.
CrossRef - Mwamlima, P. Report, University of Dar es Salaam, College of Engineering and Technology (CoET), 2017.
- Rogers, J.; Brammer, J. Biomass and Bioenergy, 2012, 36, 208-217.
CrossRef - Barry, D.; Briens, C.; Berruti, F. Engineering Conferences International, The University of Western Ontario, 2017.
- Orabi, R.; Abo-Dief, H.; Mohamed, A. International Journal of Emerging Trends in Engineering and Development, 2015, 3, 91-101.
- Abo-Dief, H.; Abo-Dief, Altalhi, A.; and Mohamed, A. J. of Industrial and Intelligent Information, 2014, 4, 314-319.
- Lam, S.; Russell, A.; Chase, A. Ind. Eng. Chem. Res., 2010, 49, 10845-10851.
CrossRef - Mohan, S.; Chandrasekhar K. Bioresouce Technology, 2011, 102, 9532-9541, 2011.
CrossRef


![]()


