Isotherm, Kinetics and Thermodynamic Studies of Hexavalent Chromium Adsorption by Using Dead Biomass of Eichhornia Crassipes
Sunil Kumar* and Rajesh Dhankhar
1Department of Environmental sciences, Maharshi Dayanand University, Rohtak-124001, Haryana, India.
Corresponding Author E-mail: sunilevs@yahoo.com
DOI : http://dx.doi.org/10.13005/ojc/360517
Download this article as:
![]()
This study examined the utilization of Raw Eichhornia crassipes (REC) biomass to exclude the hexavalent chromium heavy metal from synthetic liquid for determination of sorption isotherm, kinetics and thermodynamic parameters of adsorption during the batch experiment process. The effect of adsorbent doses, agitation time and temperature on sorption capacity was studied. The plot qt versus t1/2 determined the intra-particle diffusion effect, which was not passing from the origin of plot indicated that apart from intra-particle diffusion some other mechanism also involved in this study. Freundlich isotherm better fitted as compared to Langmuir isotherm in the present study. The kinetics study show that pseudo-second-order better followed by REC adsorbent. At 293 K temperature, Δ G◦ negative value suggested that process favoured the sorption and spontaneous in nature, but at higher temperatures, positive values Δ G◦ confirmed the non- spontaneous nature of adsorption. It is concluded that Eichhornia crassipes dead biomass has the potential to treat wastewaters as an adsorbent.
KEYWORDS:Eichhornia Crassipes; Hexavalent Chromium; Isotherms; Kenetics
Introduction
During the last few decades, there has been a many-folds increase in the pollution load of our country. Activity like industrialization and increased in urbanization has amplified heavy metals pollution in the ecosystem1,2. Heavy metals pollution occurs in wastewaters of several industries, such as mining operations, metal plating, battery manufacturing, paints and pigments, and the glass production industries. Long-time exposure to heavy metals can cause various problems such as bodyweight reduction, liver and heart damage, skin irritation, kidney damage, headache, anemia, stomach pain, intestinal irritation, abdominal pain, damage to the circulatory system and affect nervous system3,4. Some of the heavy metals are carcinogenic or mutagenic even at low concentrations. Due to their toxic problems, heavy metals are major worry of the global community5.
Water pollution due to hexavalent chromium has creates great impact on human health. The prescribed standard of hexavalent chromium in water is 0.05mg/l6. But various water bodies received a higher amount of chromium as compared to the prescribed limit. Thus, due to bad effects on human beings and other aquatic organisms, appropriate treatment of chromium containing wastewaters are essential in present scenario7,8.The biosorption is a one such attractive technology for treatment, which involves sorption of dissolved substances by a biomaterial. This potential technology not only removes the hexavalent chromium, but also recovers the metal from the wastewaters9,10. This process is better as compare to usual separation techniques like reverse osmosis, ion exchange, chemical precipitation, and filtration by membrane, used to treat toxic metals from waste streams. The main attractions of this technology are the biomaterial reusability, low cost of operation, selectivity towards metals of interest, fast treatment, and a negligible amount of toxic secondary compounds production 11,12. Most common adsorbents are activated carbon and polymers, but the disadvantage of these adsorbents are the requirement of large amount energy during manufacturing, which makes them costlier.
The abundant amount of aquatic weed is present in the Haryana region, which has potential to utilize as a biosorption for hexavalent chromium removal from wastewaters. According to one estimation water hyacinth infested over the 20-25% of usable fresh water resources in India. It occupies all the space in the water body very rapidly due to their quick growth with high densities (over 60 kg m−2). Its production on dry basic is 50 tons/hectare/year. This property of water hyacinth creates various problems like, reduction in economic development, degradation of aquatic environment, human health deterioration and interfere with navigation, recreation, irrigation and power generation13. From the last few decades dried biomass of water hyacinth has actively researched for elimination of heavy metals from wastewaters as a cheap bioadsorption. The capability of water hyacinth (Eichhornia crassipes) for nickel (II)14, cadmium15, copper and lead16 removal were assessed by various research in the recent past. Water hyacinth aquatic weed are available in abundance. Therefore, attempts have been made to use it for Cr (VI) removal. The motive of present study was to describe the Cr (VI) heavy metal adsorption isotherm, kinetics and thermodynamics from synthetic water solutions onto Eichhornia crassipes bioadsorbent.
Materials and Methods
Preparation of Adsorbents
Bulk quantities of Water hyacinth (Eichhornia crassipes.) were collected from Bhindawas wetland. In the laboratory initially fresh water was used to wash the plants, thereafter clean with distilled water. Roots and shoots of plants were cut with the help of a knife. The fresh biomass of Eichhornia crassipes was dried under sunlight for a few days. Further moisture was removed by heating at 110 ̊ C in hot air oven for 24 hr. Well dried biomass of plants was grinded to obtained particles upto 0.3mm in the form of powder. The colour of powdery material was removed by washing with a 1% formaldehyde solution, after this martial was dried at 110-120 ̊C temperature in an oven for 12 hrs. The standard sieve was used to sieve well dried material. As adsorbent was prepared by raw dry biomass, so it mentions as Raw Eichhornia crassipes (REC).
Cr (VI) Solution Preparation and Determination
To conduct batch experiments (K2Cr2O7) Potassium Dichromate analytical grade was used to prepare Cr (VI) solution. The Potassium Dichromate (K2Cr2O7) amount 2.835 g was dissolved into one liter double distilled water for preparation of 1000 ppm stock solution. Where, 20 ppm of chromium solution was prepared by 50 time dilution of stock solution. 0.25% 1, 5-Diphenylcarbazide solution was used for development of violet colour in treated samples and colour intensity was determined at 540 nm. Chromium (VI) concentration was measured by standard curve, prepared in the ranged of 0.2 to 1.4ppm.
Cr (VI) Removal Studies
250ml conical flasks were used to carry out the batch experiments. 100 ml synthetic solution of Cr (VI) was used to conduct all optimization experiments. The batch experiments were performed by using a mechanical shaker. In batch process initial Cr (VI) concentration, pH and shaking rate were kept 20ppm, 1pH and 150rpm, optimized previously with a synthetic sample of chromium. In case of optimization of dose, adsorbent doses were varied from 0.1 to 0.7g, while agitation time and the temperature kept 1 hour and 25̊ C. To examine the effect of contact time, the study was carried out at 0.3g/100ml dose and 25̊C temperature, while contact time varied from 15 to 135 minutes at the interval of 15 minutes. The removal effect of temperature on Cr (VI) was carried out by temperatures variation from 20˚C (293K) to 50˚C (323 K) at the interval of 10˚C, adsorption dose and time kept 0,3g/100ml and 1 hour, respectively. After desired agitation time on the mechanical shaker, conical flasks were detached and permitted to settle down the adsorbents for two minutes. The filter paper Whatman No. 42 was applied to clean the treated solutions, and then diphenylcarbazide method as prescribed in APHA17 applied on the filtrate to analyzed the Cr (VI) concentration.
Isotherm, Kinetics and Thermodynamic Studies
The linear and non-linear regression equations methods were applied on Cr (VI) removal in the form of Freundlich and Langmuir isotherm by using REC adsorbent. Linearized equation was evaluated by Langmuir isotherm. The REC adsorbent Cr (VI) removal was computed as follows:
The per unit weight removal of Cr (VI) (qe) on REC adsorbent at equilibrium (mg/g)
Where, Cr (VI) solution volume represents by V (liter); Adsorbent weight represents by M (gm)
The sorption mechanism types were given by kinetics study. The Lagegren’s pseudo-first order and second order calculations were determined the kinetics of adsorption. The intraparticle diffusion is a secondary process and evaluated adsorption capacity with square root of time, which determined adsorption of adsorbate on any porous material.
The parameters of thermodynamic namely, free energy (ΔG°) , enthalpy (ΔH°) and entropy (ΔS°) for sorption of chromium (VI) by REC were determined from temperature-dependent data.
Results and Discussion
Influence of Dosage
In batch process initial Cr (VI) concentration, pH, shaking rate, agitation time and temperature were kept 20ppm, 1pH, 150rpm, 1 hour and 25̊ C to assess the influence of dose. The different amounts of REC adsorbent varying from 0.1 to 0.7 g/100 ml were used to assess the optimum dose. Figure 1 shows the adsorption capacity (mg/g) of REC adsorbent at various doses. The adsorption capacity per unit solid mass of adsorbent was declined from 14.4 to 2.8 mg/g at 0.1 to 0.7 gm of REC adsorbent doses. It could be due to when the amount of adsorbent increased the amount of adsorbate available in the solution for adsorption will be less.
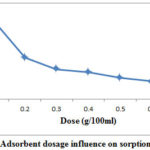 |
Figure 1: Adsorbent dosage influence on sorption capacity. |
Influence of Agitation Time
During the batch experiment for Cr (VI) adsorption capacity, the initial Cr (VI) concentration, pH, shaking rate, adsorption dose and temperature were kept 20ppm, 1pH, 150rpm, 1 hour, 0.3 g/100ml and 25̊ C to assess the influence of agitation time. Figure 2 shows the adsorption capacity (mg/g) of REC adsorbent at various time intervals. The adsorption capacity of REC adsorbent was inclined from 4.3 to 6.2 mg/g through rising time from 15 to 120 min at the intervals of 15 min. It was also observed that REC adsorbent capacity to remove Cr (VI) increased with the rising contact time.
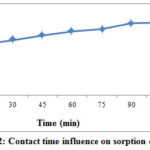 |
Figure 2: Contact time influence on sorption capacity. |
Influence of Temperature
The temperature influence on adsorption capacity for Cr (VI) was evaluated by varying temperatures from 293 K to 323 K at 20 ppm initial Cr (VI) concentration, 1 pH, 150rpm shaking rate, 1 hour agitation time and 0.3g/100ml adsorption dose, respectively. Figure 3 shows the adsorption capacity (mg/g) of REC adsorbent at various temperatures. The adsorption capacity of REC adsorbent was decreased from 5.9 to 4.4 mg/g with increasing temperatures from 293 to 323 K at the intervals of 10˚C.
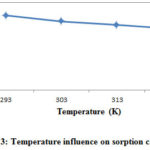 |
Figure 3: Temperature influence on sorption capacity. |
Adsorption Isotherm
Adsorption capacity in mg/g at various REC adsorbent doses have been treated by two widely used models; Langmuir18 and Freundlich19 isotherms.
The deriving expression for Freundlich isotherm is computed in equation 1.
![]()
The expression of equation 1 in the form of logarithm is determined as:
![]()
x/m = Adsorbent capacity (mg/g); x = Adsorbed Cr (VI) from solution (mg/l); Ce = Cr (VI) residual amount (mg/l); m = Dose of adsorbent (g/l); K = Freundlich constant; n = Empirical constant
The plot log x/m vs log Ce (Hexavalent Cr residual amount) was used to calculate the K and 1/n value. Intercept of plot gave the value of log K and slope gave the value of 1/n. Value of K was determine by taking antilog of log K value. The good adsorption was indicated by higher values of K and n.
Lagmuir isotherm: The Langmuir equation linear form is express as:
![]()
The Ce denotes the remaining adsorbate amount in solution at saturation (mg/l); qe denotes the REC adsorbent per unit mass Cr (VI) removal at saturation (mg/g); Vm represents complete monolayer coverage Cr (VI) amount (mg/g); b (L/ mg) is a adsorbent heat related constant.
Freundlich plot shown in Figure 4 for Cr (VI) biosorption by REC. The values of correlation coefficients (R2) and constants are shown in Table 1. Value indicates a positive relationship in data. Correlation coefficient (R2) was 0.7523 for REC adsorbent. The finding suggested that large difference occurred between the experimental data and estimated values as correlation coefficient (R2) value less than 0.9. The K is the measurement of the adsorption capacity, per unit weight Cr (VI) removal by the adsorbent. Whereas, n denotes the distribution and nature of active sites. The n value greater than 1 indicates that when decrease in surface density, the bond energies also decrease. The n value less than 1 indicates that the bond energies increase with the increasing surface density. In the present study n value is less than one suggested that the efficiency increased along with increasing dose of REC, as it provides more surfaces for adsorption.
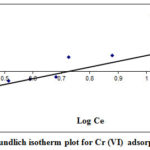 |
Figure 4: Freundlich isotherm plot for Cr (VI) adsorption by REC |
Table 1: Rate constant of different isotherm equations and adsorption kinetic models
|
Freundlich |
K (mg/g) |
1/n |
n |
R2 |
|
|
0.395 |
1.7724 |
0.564 |
0.7523 |
||
|
Langmuir |
1/Vm |
1/b (L /mg) |
b |
RL |
R2 |
|
0.0985 |
0.08 |
12.5 |
0.003 |
0.7125 |
|
|
Langergren |
Kad (l/ min) |
R2 |
|||
|
-0.0179 |
0.8803 |
||||
|
Ho Second order |
1/qe (g/(mg min) |
1/K2qe2 (g/(mg min) |
R2 |
||
|
0.1461 |
1.9816 |
0.9944 |
|||
|
Weber and Morris model for intra-particle diffusion |
Kpi (mg/ g min1/2) |
Ci |
R2 |
||
|
0.2923 |
3.1123 |
0.9875 |
|||
Figure 5 shown the Langmuir isotherms for Cr (VI) adsorption by REC adsorbent. The graph of Langmuir isotherms Ce/qe versus Ce showed that large gap was found between the experimental outcome and calculated outcome from plot as correlation coefficient R2 value 0.7125. The Langmuir isotherm model is suggested that the saturated monolayer of adsorbate molecules responsible for maximum adsorption. The Langmuir isotherm represents Cr (VI) ions distribution among the liquid and solid phases at the equilibrium. Langmuir adsorption was operative, when a plot between Ce/qe and Ce is linear.
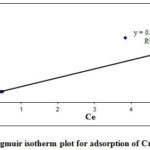 |
Figure 5: Langmuir isotherm plot for adsorption of Cr (VI) by REC |
The separation factor which is dimensionless constant denotes by RL is the main characteristics of a Langmuir isotherm.
RL = 1/(1+bCo) (4)
Where, initial Cr (VI) amount denotes as Co (mg/l); while Langmuir constant is given as b (L/mg).
The dimensionless constant demonstrates the shape of isotherm and express as:
RL = 0 Irreversible; RL=1 Linear; 0< RL<1 Favourable; RL>1 Unfavourable
The value of RL for REC was below 1 (Table 1) in present study indicated the favorable adsorption by the adsorbent and adsorbate studied.
The results of isotherm equations indicated that Freundlich isotherm model correlation coefficient (R2) value was higher as compare Langmuir isotherm for REC adsorbent. Based on these outcomes, it can be highlighted that the Freundlich isotherm is better fitted as compare to Langmuir isotherm of adsorption.
Adsorption Kinetics
The adsorption kinetics for hexavalent chromium by REC adsorbent was studied to assess its application in the industrial wastewaters treatment. Adsorption capacities in mg/g at various contact times were used to study the kinetics of REC adsorbent.
Sorption kinetics has been widely predicted by first order and pseudo-second order kinetic models. The Lengergren’s equation20 is use to assess the pseudo-first order rate constants for the Cr (VI) sorption.
![]()
Where, qe = The equilibrium Cr (VI) adsorbed concentration (mg/g); q = Absorbed Cr (VI) after time t (mg/g); t = Time (min); K = Rate constant of sorption (per minute)
The linear graph between log (qe – q) versus t showed the usability of equation, the slope of plot determined pseudo-first order equation rate constant Kad.
Langergren plot of Cr (VI) sorption has been given in figures 6. The constant values of the Langergren equation shown in Tables 1.
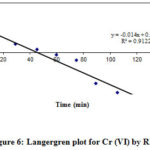 |
Figure 6: Langergren plot for Cr (VI) by REC |
The pseudo second- order equation21 of adsorption is given as:
![]()
Where, sorption rate constant denotes as K2(g/mg/min). The t/qt versus t linear plot determined the 1/qe value as the slope and 1/k2.q2e as the intercept. A pseudo-second order suggests that chemo-sorption process in addition to physio-sorption22 involves in adsorption process.
The sorption pseudo-second order model for Cr (VI) by REC adsorbent at 20 ppm initial concentrations shown in Figure 7. The correlation coefficients (R2) value was 0.99 at contact times of 120 min from the plots. This highlighted that pseudo-second order model was better fitted to Cr (VI) removal process as compare to the first order model (R2=0.91) for REC adsorbent. The second-order kinetic correlation coefficient (R2) values illustrated the great resembles among the studied and estimated data.
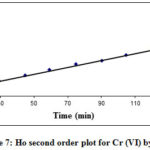 |
Figure 7: Ho second order plot for Cr (VI) by REC |
Intra-particle diffusion (Weber and Morris model)
Intraparticle diffusion is a secondary process, which determined porous material sorbate adsorption. The removal outcomes of Cr (VI) with respect to time use to determine the diffusion mechanism. Weber and Morris23 model originated from Fick’s second law demonstrated that if the intra-particle diffusion operated during the removal process by adsorption, then the linear plot occurred between adsorbate removal qt and the square root of time (t1/2) instead among the agitation time t24. The intra-particle diffusion (Weber and Morris model) is express as:
![]()
Rate parameter stage i denotes by kpi (mg/g/min1/2) and given by plot slope between qt and t1/2.The intercept use to determine thickness of boundary layer25 as a Ci. When the plot qt against t1/2 was crossed through the starting point, then the rate-limiting process was only intraparticle diffusion. But when the plot was not passed through the origin, then involvement of other mechanism also conformed beside intra-particle diffusion25.Besides adsorption on the adsorbent boundary, there is also an opportunity of adsorption through adsorbent pores due to agitation in batch reactors. The graphical relationship between the Cr (VI) removed mg/g versus square root of time (t1/2) has been presented in Figure 8.
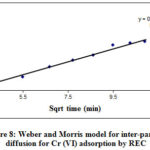 |
Figure 8: Weber and Morris model for inter-particle diffusion for Cr (VI) adsorption by REC |
The linear plot slope used to evaluate the rate constants of intraparticle diffusion. The value of a slope calculated from the curve is tabulated in Table 1, which was found 0.292. The finding of this study suggested that plot was linear to a certain extent but not linear over the whole time. Two regions have been observed, initial linear part indicated the intra-particle diffusion occurs and the uptake rate is high. While later non linear part indicated that intraparticle diffusion starts to slow down and other mechanism also involved in adsorption.
Adsorption Thermodynamic
Thermodynamic study was conducted by varying the temperature at interval of 10 ˚C, started from 20 ˚C (292K) and ended at 50˚C (323K). The parameters of thermodynamic namely, enthalpy (ΔH°), entropy (ΔS°) and free energy (ΔG°) were control the spontaneity of a sorption system. The equations applied to compute the thermodynamic parameters are given below.
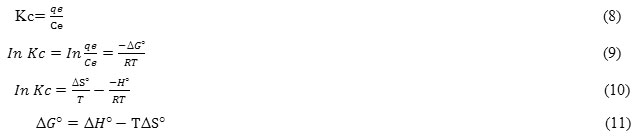
Kc denotes constant of equilibrium; qe denotes the capacity of adsorption at saturation (mg/g); Ce denotes the residual Cr (VI) amount at saturation (mg/l); Tdenotes the solution temperature (K); while, gas constant represents by R(8.314 J/mol K).
The values of ΔH◦ and ΔS◦ were determined by the linear plot of ln Kc versus 1/T from the slope and intercept (Figure 9). The ΔH◦ (enthalpy), ΔS◦( entropy) and ΔG◦ (Gibb’s free energy) values shown in Table 2. As per van’t Hoff isotherm, the reaction enthalpy and entropy can be evaluated by applying the following equations.
ΔH◦= -R*Slope
ΔS◦= R*Intercept
The values of ΔG◦ (Gibb’s free energy) were calculated by putting the value of ΔH◦ and ΔS◦ in ΔG◦ = ΔH◦-T ΔS◦, where the temperature value in Kalvin. This work revealed that adsorption of Cr (VI) was decreased with increasing temperatures. The values of ΔH◦ for REC was -19.37 KJ mol-1 (Table 2). The sorption process exothermic nature was indicated by negative value of ΔH◦. At 293 K temperature, ΔG◦ negative value indicated that process favoured the adsorption and spontaneous in nature, but at higher temperatures, positive values ΔG◦ established the non- spontaneous of adsorption. The values ΔG◦ were found in ranged of -0.68 to1.21 KJ mol-1 confirmed the physiorption26. Thepositive value of ΔS◦ indicated an increase in randomnessduring the adsorption of Cr (VI)27.
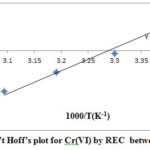 |
Figure 9: Van’t Hoff’s plot for Cr(VI) by REC between 293–323 K. |
Table 2: Thermodynamics parameters for Cr (VI) on REC
|
Adsorbent |
Δ H◦ (KJ mol−1) |
ΔS◦ (KJ mol−1 K−1) |
ΔG◦ (KJ mol−1) |
|||
|
293K |
303K |
313K |
323K |
|||
|
REC |
-19.37 |
-0.0637 |
-0.68 |
-0.06 |
0.57 |
1.21 |
Conclusions
This study used the Raw Eichhornia crassipes (REC) as an adsorbent for aqueous solution. Most of the water bodies degraded by excess growth of Eichhornia crassipes (water hyacinth), so the utilization of this plant as an adsorbent gives double benefits. Freundlich isotherm was better fitted as compare to Langmuir isotherm. The kinetics of adsorption was described by the pseudo second-order model. The negative value Δ H◦ for REC adsorbent indicated the exothermic nature of sorption process. The values ΔG◦ were found negative to slightly positive indicated that adsorption on REC was physiorption in nature. This study demonstrated that Raw Eichhornia crassipes (REC) can be effectively used for adsorption either along or by mixing with other conventional adsorbents.
Acknowledgement
The authors are thankful to Bhindawas lake authority for providing assistance and guidance during collection of Eichhornia crassipes (water hyacinth) from the lake.
Conflict of interest
The authors declare that they have no conflict of interest.
References
- Taghried, S. A.; Ali, M. I. J. Chem. Environ. 2019, 23(1), 155-169.
CrossRef - Singh, A.; Kumar, S.; Panghal, V.; Arya, S.S.; Kumar, S. Rasayan J. Chem. 2019, 12(4), 1956-1963.
CrossRef - Järup, L. British Medical Bulletin. 2003, 68, 167–182.
CrossRef - Ong, S. A.; Seng, C.E.; Lim, P. E. J. Environ. Agricul. Food Chem. 2007, 6 (2), 1764-1774.
- Al‑Salehin, P.Z.; Moeinpour F.; Mohseni‑Shahri, S.F. Applied Water Sci. 2019, 9,172, DOI:10.1007/s13201-019-1059-9.
CrossRef - Baran, A.; Bicak, E.; Baysal, S.H.; Önal, S. Technol. 2006, 98, 661–665.
CrossRef - Rodrigues, L.A.; Maschio, L.J.; Evangelista da Silva ; Pinto da Silva, M.L.C. J. Hazard. Mater. 2010, 173, 630–636.
CrossRef - Mishra, V.K.; Tripathi B.D.; Kima, K.H. Hazard. Mater. 2009, 172, 749–754.
CrossRef - Veglio, F.; Beolchini, F. 2008, 44, 301–316.
CrossRef - Abeer, A.A. M.; Muthanna, J. A. J. Chem. Environ. 2019, 23(1), 142-154.
- Balarak, D.; Bazzi, M.; Shehu, Z.; Chandrika, K. J. Chem. 2020, 36(2), 293-299.
CrossRef - Srinath, T.; Verma, T.; Ramteke, P.W.; Garg, S.K. Chemosphere 2002, 48, 427–435.
CrossRef - Malik, A. Internat. 2007, 33, 122–138.
CrossRef - Balasubramanian, U.M.; Vaiyazhipalayam Murugaiyan, S.; Marimuthu, T. Sci. Pollut. Res. 2019, DOI:10.1007/s11356-019-06357-7.
CrossRef - Chen, L.; Li, F.; Wei, Y.; Li, G.; Shen, K.; He, H. Chem. Lett. 2019, 17, 589–594.
CrossRef - De Freitas, F.; Battirola, L.D.; Arruda, R.; De Andrade, R.L. Monit. Assess. 2019, 191, 751 DOI:10.1007/s10661-019-7933-y.
CrossRef - APHA, Standard methods for the examination of waters and wastewaters. APHA- AWWA-WEF, Washington, DC, 1998.
- Langmuir, I. J Am.Chem.Soc. 1918, 40, 1361-1403.
CrossRef - Freundlich, H. , physik Chem. 1907, 57, 385-470.
- Lagergren, S. 1898, 24 (4), 1-39.
- Ho, Y. S.; McKay, G. Canadian J. Chem. Eng., 1998, 76, 822–826.
CrossRef - Ho Y. S.; McKay, G. Process Biochem. 1999, 34, 451–465.
CrossRef - Weber, W. J.; Morris, J. C. Sanitary Eng. Divis. 1963, 89, 31–60.
- McKay, G. 1998, 4, 361–372.
CrossRef - Tan, I. A. W.; Ahmad, A. L.; Hameed, B. H. Hazard. Mater. 2009, 164, 473–482.
CrossRef - Liu, Y. Chemic. Engg. Data 2009, 54(7), 1981–1985. Belhamdi, B.; Merzougui, Z.; Trari, M.; Addoun, A. J. App. Resear. Technol. 2016, 14, 354–366.
CrossRef
Accepted on: 04-10-2020


![]()


