Development and Validation of UV-Spectrophotometric Method for Estimation of Doxofylline in Bulk and Tablets
Subrata Paul1, MD. Abdul Karim Mia2, Sabarni Sarker3, Sheta Biswas4, Puja Bal5, Trisha Rani Dey3 and Tarun Kumar Pal6*
1Department of Pharmacy, University of Rajshahi, Rajshahi-6205, Bangladesh.
2Faculty of Medicine, University of Dhaka, Dhaka- 1000, Bangladesh.
3Department of Pharmacy, Faculty of Life and Earth Science, Jagannath University, Dhaka-1100, Bangladesh.
4Department of Biochemistry and Molecular Biology, Noakhali Science and Technology University, Noakhali- 3814, Bangladesh.
5Department of Pharmacy, Faculty of Allied Health Science, Daffodil International University, Dhaka-1207, Bangladesh.
6Department of Chemistry, Rajshahi University of Engineering and Technology, Rajshahi-6204, Bangladesh.
Corresponding Author E-mail: tkpchem@gmail.com
DOI : http://dx.doi.org/10.13005/ojc/360516
Download this article as:
![]()
Doxofylline is a xanthine derivative and it has its application as a bronchodilator in different pulmonary conditions like asthma and COPD (chronic obstructive pulmonary disease). The research was conducted with the objective to develop and validate a simple, easy, rapid and cost-effective UV-Spectrophotometric method to estimate the amount of doxofylline in bulk and tablets. The validating parameters and methodology were selected and performed according to ICH and USP guidelines. In the accuracy study, the mean % recovery was within the limit (100.20%) with % RSD 0.77. The mean of % assay and % RSD of intra-assay precision study was found 99.81 and 0.79 respectively with only 0.57% variation between two analysts in intermediate precision study. The linearity study demonstrated the value of the correlation coefficient is 0.9999 whereas the robustness studies showed a slight but negligible variation of absorbance while changing different operating parameters. In system suitability study, the %RSD was found less than 2.00%. According to the specificity study, there were no placebo and diluent effect on the absorbance measurements.
KEYWORDS:Accuracy; Doxofylline; Linearity; Method Validation; UV-Spectrophotometer
Introduction
The number of patients with respiratory diseases such as COPD and asthma is increasing day by day. These two diseases are considered as major risk factors for other respiratory diseases like severe acute respiratory syndrome and novel coronavirus diseases1,2. In COPD, consistent respiratory problems result in shortness of breath and other problems limiting the airflow in the lungs are observed3,4. Persistent symptoms do not require hospitalizations but an exacerbation of the disease signatures often occurs affecting patients severely leading to poor health and high expenses5,2. At the same time, asthma is very much prevalent worldwide and symptoms may vary from people to people, ranging from wheezing, shortness of breath to severe life-threatening asthma attacks6,7.
Both COPD and asthma can be treated by specific strategies with multiple modes of drugs, including a bronchodilator or an anti-inflammatory drug along the way2,8. Theophylline, an anti-inflammatory and immunomodulatory drug with small bronchodilatory action, had been used since the 1930s against pulmonary diseases9,10. In the recent guidelines of treating asthma and COPD, theophylline still has a place although having a narrow therapeutic window, lack of selective actions and incompatibility with multiple drugs11,12,4. Due to those pharmacodynamic disadvantages, new derivatives of theophylline with more selectivity and fewer side-effects had been discovered such as bamifylline, acebrofylline, doxofylline13,14. Doxofylline or 7-(1,3-dioxolan-2-ylmethyl)-3,7-dihydro-l,3 dimethyl-lH-purine-2,6-dione (Fig. 1) is a xanthine derivative in which 1 and 3 position of the purine base is replaced by two methyl groups similar to theophylline. However, it shows less side-effect profile than theophylline due to its less affinity towards adenosine A1 and A2 receptors. It does not interact with calcium channel blockers as it does not obstruct Ca2++ entry into cells15-17. The capability of the drug of being both bronchodilator and anti-inflammatory agent bearing the larger therapeutic window with having lesser side-effects infers the drugs more randomized clinical trials in the future17. Doxofylline is used and produced in different countries in the world, such as India and China both single as well as in combination with another drug18.
The repeatability of analytical techniques can be guaranteed by the analytical method validation technique. For orphan and investigational drugs, more and more method validation studies optimize the information regarding accuracy, precision, linearity, robustness etc19. Literature survey indicated that several studies had been done regarding the RP-HPLC analytical method validation of doxofylline20,21,18. On the other hand, few studies were done to perform the UV-spectrophotometric analysis of the drug. Among them, studies were successfully done previously to quantitatively analyze and test the photo-stability of doxofylline from bulk, pharmaceutical formulations and tablets22, 23, 24. From the literature, it was clear that spectrophotometric methods can offer a suitable and cost-effective method for routine analysis of doxofylline. In the current study, UV-spectrophotometric method for the determination of doxofylline from bulk and marketed tablets was validated according to the ICH and USP guidelines 25, 26.
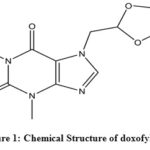 |
Figure 1: Chemical Structure of doxofylline Click here to View figure |
Materials And Methods
Instrumentation and Reagents
A calibrated UV-Visible spectrophotometer (UV-3600i Plus, Shimadzu, Japan) run with Lab Solutions software was used for the development and validation of the method. Doxofylline 200 mg tablet and doxofylline standard (Potency 99.40%) were gifted by Drug International Limited, Bangladesh. Sodium hydroxide, potassium dihydrogen phosphate, orthophosphoric acid were purchased from Sigma Aldrich (Germany). Double distilled and deionized water was prepared in the laboratory.
Preparation of Diluent
Approximately 2.446 g of sodium hydroxide and 1.575 g of potassium dihydrogen phosphate were taken in a 1000 ml volumetric flask and then water was added to fill the volume. The pH was adjusted to 7.6 with dilute orthophosphoric acid or sodium hydroxide as per requirement.
Preparation of Standard 1 and Standard 2
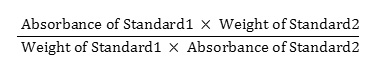
20 mg of doxofylline standard was weighed and poured into a 100 ml volumetric flask and diluent was added to make the volume about 70 ml. It was sonicated for 15 minutes and cooled down the solution afterwards. Further, the entire volume was filled up with the same solvent. 5 ml of this solution was poured into another volumetric flask to make the final volume 50 ml by adding the same solvent. So, the concentration of the solution became 0.02 mg/ml. For the preparation of standard 2, the process was repeated and the similarity factor was calculated using the following equation:
Sample Preparation
20 tablets were weighed and milled into fine powders. After that, accurately weighed 350 mg powder (equivalent to 200 mg doxofylline) was taken into a 100 ml volumetric flask. Then 70 ml diluent was mixed and sonicated for 15 minutes. Subsequently, the solution was cooled down and diluent was added up to the mark. After that, the resulting solution was centrifuged at 3000 RPM for 20 minutes. From this, 1 ml was poured into a 100 ml volumetric flask and the required volume was filled by adding the same solvent to attain a final concentration of 0.02 mg/ml. Then the absorbance of standard and sample solution was taken with UV Spectrophotometer at 272 nm. Then the amount of doxofylline/unit dose was determined with the following equation:

Validation Parameters
Accuracy
Accuracy was determined by calculating the % recovery according to ICH guidelines25. It was done by adding a known amount of standard above and below the label claim i.e. 80%, 100% & 120%. Accurately weighed 160 mg of doxofylline and 190 mg of placebo for 80%, 200 mg of the drug and 150 mg of placebo for 100% and 240 mg of the drug and 110 mg of placebo for 120% in a100 ml volumetric flask. After that, 70 ml of diluent was mixed and placed in an ultrasonic bath for 15 minutes, the solution was cooled down, the required volume was filled with diluent and it was centrifuged at 3000 RPM for 20 minutes. Furthermore, 1 ml of the solution was poured into another 100 ml volumetric flask and the volume was filled with the required amount of diluent. The percent of recovery was calculated using the following equation. For each level, the experiment was carried out three times.

Precision
Precision studies were carried out through intra-assay and intermediate precision according to ICH guidelines25,27. Intra-assay precision, also termed as repeatability, demonstrates how precise a process is after a small interval involving similar operating conditions in a specific laboratory. In this precision study, same operator, same analytical machines in a same day was involved. On the other hand, in the intermediate precision study, same sample within different days, different personnel and equipment’s were involved and the contrasting results were checked. For intra-assay and intermediate precision, six experiments were done and % RSD was calculated to assess the precision of the method.
Linearity
Linearity studies were performed and linearity graph was plotted according to USP guidelines26. At first, incremental concentrations of samples were prepared in the working range. Linearity samples were prepared at concentrations 50%, 80%, 100%, 120% and 150% of the theoretical claim of a single unit. To prepare the mother stock solution, accurately weighed 20 mg of doxofylline was taken in a 100 ml volumetric flask and required amount of diluent was added. The concentration of this solution was 0.2 mg/ml. For 50%, 80%, 100%, 120% and 150% sample, 2.5 ml, 4 ml, 5 ml, 6 ml, 7.5 ml of the stock solution were taken respectively into a 50 ml volumetric flask and required diluent was added. The concentrations of the sample solutions became 0.010 mg/ml, 0.016 mg/ml, 0.020 mg/ml, 0.024 mg/ml, 0.030 mg/ml respectively. The absorbance of samples was taken as per assay method and a graph of doxofylline concentration versus the corresponding absorbance was plotted.
Robustness
Robustness indicates the analytical method’s capacity to produce similar results if some intentional and experimental changes are made in the parameters29. The study was carried out by checking result variations in the wavelength range of 272 nm ±2 nm, carrying out filtration step with filter and without filter paper, running samples with and without centrifuge and a pH variation of 7.6 ± 0.1.
System Suitability Study
System suitability is an integral and initial stage of method validation and used to verify reproducibility of the method. It is generally performed to ensure the performance of the instrument and to make sure that the system is ready for starting the analysis30. In this study five replicates of the standard at 100% level were prepared to check the system suitability.
Specificity
The capacity of the method to determine the exact concentration of active ingredients in the presence of excipients and impurities is termed as the specificity of an analytical method 28. For the preparation of the placebo solution, 150 mg of placebo was used. The procedures mentioned in sample preparation were followed before it was transferred into a 100ml volumetric flask. The specificity of the method was determined by checking and comparing the absorbance pattern of standard solution, sample solution and placebo solution.
Stability
Analytical solutions stability was evaluated by taking and comparing the absorbance of standard and sample solution at 0 h (freshly prepared) and at 24 h. The sample and standard solution were prepared according to the method described in sample and standard preparation section. After taking the spectrum, solutions were kept at room temperature for another 24 hours and the spectrum was taken again.
Results And Discussion
Accuracy
The spiked-placebo (product matrix) recovery of the analytical method was applied to determine the recovery of a known amount of standard. In this study, the accuracy determination of doxofylline was checked at three concentration levels each in triplicate. The obtained percentage of recovery was within the range of 99.10–101.11% and % RDS of 0.77, which supports the suitability of the method for routine drug analysis [Table 1].
Table 1: % Recovery study for doxofylline
|
Level |
Weight of Placebo (mg) |
Amount of Std. added (mg) X |
Amount Recovered (mg) Y |
% Recovery (Y/X*100) |
Mean |
% RSD |
|
80% |
190.3 |
160.1 |
160.71 |
100.38 |
||
|
190.5 |
161.6 |
163.19 |
100.98 |
100.60 |
0.36 |
|
|
190.6 |
160.2 |
160.92 |
100.45 |
|||
|
100% |
150.1 |
200.0 |
198.30 |
99.15 |
||
|
150.2 |
200.1 |
198.30 |
99.10 |
99.16 |
0.029 |
|
|
150.1 |
200.1 |
198.52 |
99.21 |
|||
|
120% |
110.2 |
240.3 |
242.97 |
101.11 |
||
|
110.4 |
240.4 |
241.94 |
100.64 |
100.84 |
0.347 |
|
|
110.3 |
240.4 |
242.26 |
100.77 |
|||
|
Mean (% recovery) |
100.20 |
|||||
|
%RSD |
0.77 |
|||||
Precision
In this experiment, both intra-assay precision (repeatability) and intermediate precision were performed. Repeatability was performed by same analyst with same instrument on same day. Intermediate precision was performed by two analysts on a different day with different instrument, and it was found that the two results have a disparity of 0.57% (acceptance Limit: ± 2.00%). On the other hand, % RSD for Intra and intermediate precision were 0.79% and 0.27%, respectively which is well below the permissible range, £ 2.00% [Table 2 and Table 3].
Table 2: Repeatability study for doxofylline
|
Determination No. |
Weight of Sample (mg) |
Weight of Std. (mg) |
Result (mg/Unit Dose) |
Assay (%) |
|
1. |
352.2 |
20.01 |
199.43 |
99.71 |
|
2. |
352.9 |
200.64 |
100.32 |
|
|
3. |
352.5 |
199.93 |
99.96 |
|
|
4. |
352.1 |
196.65 |
98.33 |
|
|
5. |
352.1 |
199.87 |
99.93 |
|
|
6. |
352.6 |
201.16 |
100.58 |
|
|
Mean of % Assay |
99.81 |
|||
|
%RSD |
0.79 |
|||
Table 3: Intermediate precision study for doxofylline
|
Analyst 1 (Day 1) |
Analyst 2 (Day 2) |
|||||
|
Determination No. |
Weight of sample (mg) |
Assay (%) |
Determination No. |
Weight of sample (mg) |
Assay (%) |
|
|
1. |
352.2 |
99.71 |
1. |
349.6 |
99.09 |
|
|
2. |
352.9 |
100.32 |
2. |
349.9 |
99.45 |
|
|
3. |
352.5 |
99.96 |
3. |
349.5 |
99.51 |
|
|
4. |
352.1 |
98.33 |
4. |
350.1 |
99.21 |
|
|
5. |
352.1 |
99.93 |
5. |
349.5 |
99.38 |
|
|
6. |
352.6 |
100.58 |
6. |
352.1 |
98.79 |
|
|
Mean % RSD |
99.81 99.24 0.79 0.27 |
|||||
Linearity
The linearity was evaluated in the drug concentration range of 0.010 mg/ml to 0.030 mg/ml. The line must be linear over the experimental range and the correlation coefficient of 0.9999 is generally considered as acceptable31. From the regression analysis, a linear equation was obtained: y= 34.502x + 0.0023, and r2 was found to be 0.9999, which assures linearity between absorbance and the concentration of the analytes [Fig. 2 and Table 4].
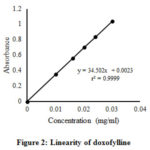 |
Figure 2: Linearity of doxofylline |
Table 4: Linearity study for doxofylline.
|
Determination No. |
Concentration (mg/ml) (X Axis) |
Absorbance (Y Axis) |
|
1. |
0.010065 |
0.35046 |
|
2. |
0.016104 |
0.55805 |
|
3. |
0.020130 |
0.70016 |
|
4. |
0.024156 |
0.83775 |
|
5. |
0.030195 |
1.03971 |
Robustness
Different parameters of robustness studies and their effects on % recovery are tabulated in Table 5. Changing of pH by ± 0.1 showed no significant effect on the absorbance of the drug. The results showed that a minor change of other parameters such as change of wavelength, filtration effect and centrifugation effect did not affect much on the final results. As the changes are not significant and % RSD is £ 2.00% so we can say that the method is robust.
Table 5: Robustness study
|
Parameters |
% Recovery |
%Target |
% RSD |
|
With filtration |
99.26 |
100 |
1.64 |
|
Without filtration |
101.59 |
100 |
|
|
With Centrifuge |
99.41 |
100 |
0.64 |
|
Without Centrifuge |
100.32 |
100 |
|
|
Wavelength 270 nm |
97.78 |
100 |
0.95 |
|
Wavelength 272 nm |
99.26 |
100 |
|
|
Wavelength 274 nm |
99.52 |
100 |
|
|
pH 7.5 |
99.44 |
100 |
0.59 |
|
pH 7.6 |
100.56 |
100 |
|
|
pH 7.7 |
99.64 |
100 |
System Suitability
The results of the system suitability of the method are shown in Table 6. The % RSD found for five replicates from both day 1 and day 2 were 0.10 and 0.24 respectively, which were within the acceptance limit. Besides, for day 1 and day 2, the similarity factors of the standard solution 1 and 2 were also within the permissible range. These results suggest the suitability of the proposed validated method.
Table 6: System suitability study for doxofylline
|
Day- 1 |
Day- 2 |
||||
|
Determination No. |
Absorbance |
Similarity Factor |
Determination No. |
Absorbance |
Similarity Factor |
|
1. |
0.70011 |
1. |
0.70329 |
||
|
2. |
0.70025 |
2. |
0.70027 |
||
|
3. |
0.69937 |
1.00 |
3. |
0.69967 |
0.99 |
|
4. |
0.69966 |
4. |
0.69895 |
||
|
5. |
0.70134 |
5. |
0.70145 |
||
|
% RSD 0.10 |
% RSD 0. 24 |
||||
Specificity
The UV spectrum of the drug was not changed due to the presence of excipients used in the formulation. The spectrum of standard, sample and placebo solution were taken and showed in Fig.3. The spectrum showed that there was no effect of diluent and placebo solution during analysis. So the proposed method is selective and specific.
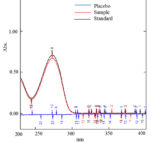 |
Figure 3: UV-absorption spectra of doxofylline standard, sample and placebo |
Stability Study
Doxofylline standard and sample solution in diluent showed no spectrophotometric changes during 24 h. After 24 h, the spectrum of sample and standard was almost same and overlapped with the freshly prepared solutions which indicate good stability of analytical solutions in diluent (Fig. 4).
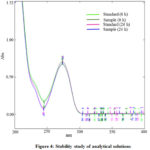 |
Figure 4: Stability study of analytical solutions Click here to View figure |
Assay of Market Formulation
Five brands of doxofylline tablets were collected and analyzed for the determination of drug content by the developed validated method. Each experiment was performed 3 times and the results are summarized in Table 7.
Table 7: Estimation of doxofylline in commercial formulations
|
Brand |
Labeled amount (mg) |
Obtained amount (mg) |
% Drug content |
|
B-1 |
200 |
199.6 |
99.8 |
|
B-2 |
200 |
200.8 |
100.4 |
|
B-3 |
200 |
197.5 |
98.75 |
|
B-4 |
200 |
198.5 |
99.25 |
|
B-5 |
200 |
200.2 |
100.1 |
Conclusion
In this current study, an accurate, precise, linear, robust, specific and cost-effective UV-visible spectrophotometric method for analysis of doxofylline has been developed. The main traits of the developed method were an accuracy with acceptable range and both repeatability and intermediate precision has % RSD below 2.00%. Besides, the linearity of the method was obtained and the process was found to be robust. The system was similar on different days and it has no placebo or diluent effect. Moreover, the analytical solution was found to be stable over a period of 24 hours at room temperature. This validated method of doxofylline is simple and this method validation procedure is replicable in any laboratory conditions and can be used for quantitative analysis of doxofylline in bulk and tablets.
Acknowledgements
The first author, Subrata Paul is grateful to Drug International Limited, Bangladesh for supplying the doxofylline (sample) and doxofylline (standard).
Conflict of Interest
No conflict of interest to declare.
References
- Lippi, G; Henry, B.M. Int. Urol. Nephrol., 2020.
- Singh, D.; Agusti, A.; Anzueto, A.; Barnes, P.J.; Bourbeau, J.; Celli, B. R.; Criner, G. J.; Frith, P.; Halpin, D.M.G.; Han, M.; López Varela, M. V.; Martinez, F.; Montes de Oca, M.; Papi, A.; Pavord, I.D.; Roche, N.; Sin, D.D.; Stockley, R.; Vestbo, J.; Wedzicha, J.A.; Vogelmeier, C. Eur. Respir. J., 2019, 53(5).
CrossRef - Criner, G.J.; Celli, B.R.; Brightling, C.E.; Agusti, A.; Papi, A.; Singh, D.; Sin, D.D.; Vogelmeier, C.F.; Sciurba, F.C.; Bafadhel, M.; Backer, V.; Kato, M.; Ramírez-Venegas, A.; Wei, Y.F.; Bjermer, L.; Shih, V.H.; Jison, M.; O’Quinn, S.; Makulova, N.; Newbold, P.; Goldman, M.; Martin, U. J. N. Engl. J. Med., 2019, 381, 1023–1034.
CrossRef - Vogelmeier, C.F.; Criner, G.J.; Martinez, F.J.; Anzueto, A.; Barnes, P.J.; Bourbeau, J.; Celli, B.R.; Chen, R.; Decramer, M.; Fabbri, L.M.; Frith, P.; Halpin, D.M.G.; Varela, M.V.L.; Nishimura, M.; Roche, N.; Rodriguez-Roisin, R.; Sin, D.D.; Singh, D.; Stockley, R.; Vestbo, J.; Wedzicha, J.; Agustí, A. Am. J. Respir. Crit. Care. Med., 2017, 195(5), 557-582.
CrossRef - MacIntyre N.; Yuh, C.H. Proc. Am. Thorac. Soc., 2008, 5(4), 530-535.
CrossRef - Asher, M.I.; Montefort, S.; Bjorksten, B.; Lai, C.K.; Strachan, D.P.; Weiland, S.K.; Williams, H. Lancet., 2006, 368(9537), 733-743.
CrossRef - Eder, W.; Ege, M.J.; Von Mutius, E. N. Engl. J. Med., 2007, 355(21), 2226-35.
CrossRef - Kalayci, O.; Abdelateef, H.; Pozo Beltrán, C.F.; El-Sayed, Z.A.; Gómez, R.M.; Hossny, E.; Morais-Almeida, M.; Nieto, A.; Phipatanakul, W.; Pitrez, P.; Wong, G.W.; Xepapadaki, P.; Papadopoulos, N.G. World Allergy Organ. J., 2019, 12(9), 100054.
CrossRef - Nyhan, W.L.; Shirkey, H.C.; Weinberger, M.M.; Bronsky, E.A. J. Pediatr., 1974, 84(3) 421-427.
CrossRef - Weinberger, M.; Hendeles, L. N. Engl. J. Med., 1996, 334(21), 1380-1388.
CrossRef - Horak, F.; Doberer, D.; Eber, E.; Horak, E.; Pohl, W.; Riedler, J.; Szépfalusi, Z.; Wantke, F.; Zacharasiewicz, A.; Studnicka, M. Wien. Klin. Wochenschr., 2016, 128(15-16), 541-54.
CrossRef - Spina D.; Page, C.P. Handb. Exp. Pharmacol., 2016, 237, 63-91.
CrossRef - Calzetta, L.; Page, C.P.; Spina, D.; Cazzola, M.; Rogliani, P.; Facciolo, F.; Matera, M.G. J. Pharmacol. Exp. Ther., 2013, 346(3), 414-423.
CrossRef - Abbracchio, M.P.; Cattabeni, F. Pharmacol. Res. Commun., 1987, 19(8), 537-545.
CrossRef - Franzone, J.S.; Cirillo, R.; Reboani M.C. Int. J. Tissue React., 1991, 13(3), 131-138.
- Matera, M.G.; Page, C.; Cazzola, M. Int. J. Chron. Obstruct. Pulmon. Dis., 2017, 12, 3487-3493.
CrossRef - Page, C.P. Pulm. Pharmacol. Ther., 2010, 23(4), 231-234.
CrossRef - Samanthula, G.; Yadiki, K.; Saladi, S.; Gutala, S.; Surendranath, K.V. Sci. Pharm., 2013, 81(4), 969-982.
CrossRef - Ozkan, S.A. Pharm. Sci., 2018, 24(1), 1-2.
CrossRef - Revathi, R.; Ethiraj, T.; Thenmozhi, P.; Saravanan, V.S.; Ganesan, V. Pharm. Methods., 2011, 2(4), 223-8.
CrossRef - Patil, P.S.; Hamrapurkar, P.D.; Phale, M.D.; Desai, M.I.; Pawar, S.B. J. AOAC Int., 2013, 96(4), 765-770.
CrossRef - Rekha, P.S.; Gunasekaran, S. Spectrochim. Acta. A. Mol. Biomol. Spectrosc., 2018, 190, 140-149.
- Kamila, M.M.; Mondal, N.; Ghosh, L.K. Indian J Chem Techn., 2007,14, 523–525.
- Patel, A. H.; Captain, A. D.; Joshi H. R. J Young Pharm., 2010, 2(3), 289-296.
CrossRef - ICH Guideline, Validation of Analytical Procedures: Text and Methodology. Topic Q 2 (R1), 2005, Geneva, Switzerland.
- United States Pharmacopoeia (2003) United States Pharmacopeial Convention, 26thEdition, Rockville, MD.
- Haque, M.A.; Naznin, A.; Kabir, A.H.; Hossain, M.K.; Islam, S.A. Dhaka Univ. J. Pharm., 2010, 9(2), 131-138.
CrossRef - Batrawi, N.; Naseef, H.; Al-Rimawi, F. J. Anal. Methods. Chem., 2017, 1529280.
CrossRef - Naseef, H.; Moqadi, R.; Qurt, M. J Anal Methods Chem., 2018, 1902510.
CrossRef - Sharma, S.; Goyal, S.; Chauhan, K. Int. J. App. Pharm., 2018, 10(6), 8-15.
CrossRef - Miller, J.N. Analyst., 1991, 116(1), 3-14.
Accepted on: 10-09-2020


ISSN Online: 2231-5039

![]()


