TiO2NPs Embedded in Chitosan Membrane for Efficient Photodegradation of Various Dyes
1Chemistry Department, Faculty of Science, Taif University, Taif, Kingdom of Saudi Arabia
2Forensic Chemistry Laboratories, Medico Legal Department, Ministry of Justice, Cairo, Egypt
Corresponding Author E-mail: em-s-z@hotmail.com
DOI : http://dx.doi.org/10.13005/ojc/360120
Download this article as:
![]()
A synthesis of a new chitosan/TiO2NPs nanocomposite was conducted, whereby the use of TiO2NPs was for it to act in the form of photocatalyst while the use of chitosan was for it to act as the nanoparticles immobilisation agent when TiO2NPs and chitosan are in combination. They were used under UV source for photodegradation of anionic and cationic, as well as for removing neutral dyes dissolved in water. Several techniques like scanning electron microscope (SEM) and energy-dispersive X-ray (EDAX) spectroscopy, together with Fourier-transform infrared spectroscopy (FT-IR) analysis and swelling ratio were all used in characterising the fabricated membranes. The incorporation of TiO2NPs in the chitosan network was revealed by FT-IR analysis. The confirmation of their spherical shape and nanoparticles was made by SEM. The dyes were completely eliminated under UV light in this order of CS, CS/Low TiO2NPs, CS/Mid TiO2NPs, and CS/High TiO2NPs.
KEYWORDS:Chitosan Membranes, Dyes, Photodegradation, TiO2NPs, Wastewater Treatment.
Introduction
One of the greatest problems facing the world today is environmental pollution. With every passing year, this problem is multiplying and resulting in serious and permanent damage to the earth’s environment. There are three basic types of pollution – air, water, and soil – when it comes to environmental pollution [1]. Industrial discharge and the use of excess pesticides, as well as fertilizers used in the agriculture sector and pharmaceutical residue, together with domestic waste landfilling are all among the causes of water pollution [2]. Different organic compounds like solvents and dioxins, as well as dibenzofurans and pesticides are all present in contaminated water. Other organic compounds present in contaminated water include polychlorinated biphenyls (PCBs) and chlorophenols, together with dyes [3-6].
A dye can be described as a coloured substance that has similarity with the substrate that is being applied to the application of dye is generally being performed in an aqueous solution, and with the possibility of requiring a mordant (an inorganic oxide) for enhancing the dye’s fastness on the fibre [7, 8]. There is broad use of synthetic dye in a lot of fields of advanced technology. Synthetic dyes, for example, are being used in different kinds of the textile [9] and paper [10], together with leather tanning [11] and food processing. Other areas where synthetic dyes are widely applied include plastics and cosmetics, as well as rubber, printing and dye manufacturing industries [12, 13]. Toxic amines’ presence in the effluent is what makes Azo dyes toxic [12]. Furthermore, there is the likelihood of chemically stable reactive dyes with little biodegradability passing through conventional treatment plants without being treated, thereby making their elimination very essential. As a result of their toxic effects, many concerns on the use of dyes have been raised [14].
Unfortunately, the environmental balance is being threatened by organic dyes’ presence in aqueous environments as a result of their toxicity and low biodegradability. A lot of dyes are derived from known carcinogens like benzidine and other aromatic compounds. The most difficult dyes to undergo degradation are antroquinone-based dyes, as a result of their fused aromatic ring structure. In addition, its intense colour has the ability of attenuating the transmission of sunlight into water. Therefore, it has the ability of affecting aquatic plants, which eventually disrupts the aquatic ecosystem [15].
There are several methods so far discovered to be suitable for the removal of different kinds of dye. Two such methods are physical and chemical methods. The physical methods of dye removal come in the form of nanofiltration and reverse osmosis, as well as electrodialysis. The chemical methods of dye removal come in the form of coagulation or flocculation integrated with flotation, filtration, and precipitation flocculation, as well as electro-flotation and electro-kinetic coagulation. However, the dye is not degraded by these methods, although the dye concentration in water bodies only decreases due to the fact that it is converted from one form to another, resulting in the creation of a secondary pollution. In literature for dye removal from wastewater, reports regarding the use of biological methods like aerobic and anaerobic microbial degradation, as well as the use of pure enzymes were made. The time consuming nature of biological methods is what makes them to be disadvantageous, and certain dyes are even resistant to aerobic treatment. The possibility of carcinogenic compounds production like aromatic amines taking place during the anaerobic treatment of dyes has been reported [14]. Advanced oxidation processes have attracted attention in the recent past for pollutant removal from wastewater. These are eco-friendly, economic procedures that have the ability of degrading several dyes or organic pollutants found in wastewater. The carrying out of these advanced oxidation procedures were performed in the presence of solar and ultraviolet irradiation [16, 17].
Membrane technology is utilised in industries for treatment or improvement of water quality for it to be used or reused or discharged into the environment. The modular nature of membrane technology and the possibility of applying it in different fields are its advantages. A steady growth in membranes will be witnessed in the foreseeable future in the water industry as a result of rising water shortage and improvements in membrane performance, as well as costs and energy demand. In addition, traditional water treatments have proven to be ineffective in the removal of certain contaminants instead of the production of harmful by-products. Introduction of membrane processes that have different separation range has been made with numerous applicable fields [18].
One of the most significant semiconductors that shows great promise in photocatalysis and solar cells, as well as photochromism, and sensoring, together with other applications in the field of nanotechnology is titanium dioxide nanoparticles (TiO2NPs) [19, 20]. Titanium dioxide nanoparticles have been commercialised as the most powerful photocatalyst as a result of the high photoactivity for majority of the photocatalytic reactions, as well as being nontoxic to human life [21-23]. The high stability nature and low costs, as well as high efficiency of semiconductors like ZnO or TiO2NPs are what make them suitable to be frequently used as catalytic agents. We made use of TiO2NPs in our study, due to the fact of its exhibition of higher catalytic activity under the UV light irradiation [24]. It is possible for TiO2NPs crystalline structure and particle size to affect its photocatalytic activity, considering the fact that report has it that TiO2NPs degradation rate increases as the TiO2NPs particle size decreased [25, 26]. Besides, TiO2NPs possesses a strong oxidising power and a band gap of 3.2 eV. Irradiation of a TiO2NPs n-type semiconductor wavelength light less than 390 nm results in the production of the electron-hole pair. The generated electron-hole pairs have the ability of initiating reduction and oxidation reaction on the TiO2NPs particles’ surface. Surface OH groups in aqueous solution scavenge the hole for generation of the strongly oxidising hydroxyl radicals. Afterwards, a quick reaction of the reactive hydroxyl radicals with organic dyes will result in the organic dye’s mineralisation [27].
Nanomaterials incline to forming into a mass or group to reduce their surface area and surface energy with the possibility of directly influencing their performance. Overcoming this, calls for the possibility of employing a matrix to act in the form of a support that moderates the reduction of surface area and constrains the nanomaterials’ aggregation [28].
One of the most valuable polymers used in biomedical and pharmaceutical applications as a result of its biodegradability and biocompatibility, as well as its antimicrobial, non-toxicity, and anti-tumour properties is chitosan. Chitosan modification is easier compared to other polysaccharides as a result of its reactive functional groups, among which are amino and hydroxyl groups [29]. Physical and chemical modifications have the ability of enhancing chitosan’s mechanical properties and adsorption capacity [30]. The basic chitosan structure is not altered by modification, although modification brings about new by-products that have improved properties for special applications in different areas [31]. Such modification leads to improvement in the adsorption properties and ups chitosan’s mechanical strength and chemical stability in acidic media [32]. It also leads to reductions in chitosan’s biochemical and microbiological degradation [33].
The current investigation aims to make use of different amounts of TiO2NPs (low, medium, and high) in the development of a novel nanocomposite CS/TiO2NPs membrane. Chitosan membrane was utilised in the form of a matrix phase, while TiO2NPs were utilised in the form of a photocatalyst. Investigation of the influence of nanoparticles addition on the produced membrane morpho-structural was conducted. Investigation of nanoparticles addition impact on produced membrane morpho-structural was conducted. Investigation was also conducted on photocatalytic degradation effectiveness under UV irradiation (365 nm) with regards to different types of dyes such as cationic (methyl blue) and neutral (neutral red), as well as anionic dyes (fast green). Table 1 displays the characteristics of investigated dyes which were evaluated with the use of different membranes such as chitosan and chitosan/ TiO2NPs (L), as well as chitosan/ TiO2NPs (M) and chitosan/ TiO2NPs (H). Furthermore, the computation of the dyes’ degradation kinetics was made.
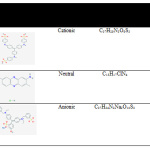 |
Table 1: Characteristic of investigated dyes in this study
|
Experimental
Chemicals and materials
Chitosan powder [C56H103N9O39] (degree of deacetylation 95%), titanium dioxide (TiO2NPs, 25 nm particle size), acetic acid, fast green (FG) (98.5% purity), neutral red (NR) (95 % purity), methyl blue (MB) (> 98% purity), titanium dioxide powder (TiO2NPs) (99 % purity), sodium hydroxide (NaOH) and hydrochloric acid (HCl), were purchased from Sigma-Aldrich (Poole, UK), all solvents and chemical reagents were analytical grade or the best grade commercially available and used without further purification. The Whatman filter paper (pore size 25 μm and diam. 15 cm) was purchased from Whatman Asia Pacific (Mumbai, India). Distilled water (Ultrapure water) was employed for preparing all the solutions and reagents. Disposable plastic syringe (1 mL) was purchased from Scientific Laboratory Supplies (Nottingham, UK).
Instrumentation
A hot plate-stirrer from VWR International LLC (West Chester, PA, USA). The UV-Vis spectrophotometer was from Thermo Scientific GENESYS 10S (Toronto, Canada). UV lamp (365 nm) from Spectronic Analytical Instruments (Leeds, UK). A scanning electron microscope (SEM) Cambridge S360 from Cambridge Instruments (Cambridge, UK). Energy dispersive X-ray (EDX) analysis was performed using an INCA 350 EDX system from Oxford Instruments (Abingdon, UK). The FT-IR spectra used in the present study were PerkinElmer RX FTIR ×2 with diamond ATR, and also DRIFT attachment from PerkinElmer (Buckinghamshire, UK).
Fabrication of Membranes
The sol-gel method made use of an earlier work’s described method in synthesising the chitosan membrane [34]. Approximately chitosan in an amount of 1.0 g was dissolved in an aqueous acetic acid solution (2%, v/v). At a temperature of 30°C, the mixture was then stirred for 24 hours at 700 rpm in order to achieve a homogeneous solution prior to being filtered through a nylon cloth for the removal of any non-dissolved materials. The mixture, in the amount of 7 mL was then bored in a petri dish, with thin chitosan membrane forming after 5 days. The preparation of chitosan film with titanium dioxide powder content, calls for different TiO2NPs powder weights of 0.03g, 0.05g, and 0.07g, to be added to 20 mL of the mixture and continuously stirred for a period of 2 h. The mixture, in the amount of 7 mL was then bored in a petri dish with the formation of thin chitosan membrane containing nanomaterial taking place after 5 days.
Characterization of the Prepared Membranes
Surface Morphology
SEM analysis characterised the surface morphology of the fabricated membrane after using a thin layer of gold to coat the samples for prevention of charge problems and for improvement of the resolution. Energy dispersive X-ray analysis (EDX) was utilised in performing a compositional analysis.
FT-IR Analysis
PerkinElmer RX FT-IR ×2 having diamond ATR and DRIFT attachment from PerkinElmer was used to collect the FT-IR spectra in the attenuated total reflectance (ATR) mode. Fourier transmission infrared spectroscopy was used in the qualitative identification of the prepared materials’ chemical functionality. Recording of spectra between 4000 and 650 cm-1 was made.
The Swelling Ratio
After hydrogel membrane had swollen to equilibrium, Seq, the gravimetric method was used to take the measurement of the swelling ratio. There was immersion of the reweighed, completely dried membrane sample in distilled water of 100 mL at a temperature of 25±1 °C for a period of 1 hour, which was monitored to be enough in attaining an equilibrium state. The membrane was quickly removed and wiped with filter paper and the weight taken. The following equation was used in computing for Seq which is expressed as water percentage in the membrane at equilibrium:
![]()
Where the weight of the swollen membrane is represented by Ws and the weight of the dry membrane is represented by Wd. In order to see to it that the experiments are made more precise, repetitions of the experiments were conducted three times and after that the average value was taken to be the final swelling percentage value.
Photocatalytic Degradation
Three different single dyes – methyl blue (160 mg L-1), neutral red (170 mg L-1), and fast green (30 mg L-1) – were utilised in this study. The 100 mL dyes decolourisation in aqueous solution investigated the fabricated membranes or TiO2NPs photocatalytic activity. The suspension, prior to the UV lamp exposure was, for one hour, magnetically stirred at 700 rpm. The performance of the reaction was undertaken with continuous magnetic stirring during the reaction. There was withdrawal of 2 mL aliquot from the mixture solution at every 2 min intervals. Also, the same process was undertaken in the dark to identify the photocatalyst activity of membranes, and one other blank experiment was made by following the same process with no adding of the photocatalyst to understand the degree of degradation of the dyes as a result of the UV light.
A UV-Vis spectrophotometer operating at wavelength between 350 nm and 800 nm was spectrometrically used in monitoring the dyes degradation while the blank was distilled water. There was repetition of every experiment three times and the average of the experiment taken to ensure the results’ reproducibility. The equation given below is used in the following manner for absorption in the dyes solution absorption spectra in connection with the intensity consistent with λmax of methyl blue (593 nm), neutral red (518 nm), and fast green (623 nm):
![]()
Where the dyes’ initial concentration is represented by Co and the dye’s concentration after irradiation in a selected time interval is represented by C. The limitations and are the dyes solution absorbance at the first time and at any time [35].
Results and Discussion
Fabrication of chitosan membrane containing several amounts of TiO2NPs for their use as a photocatalyst for different types of dyes degradation with the help of UV light is the aim of this work. Chitosan, soluble only in acidic aqueous solutions, as a result of amine groups’ presence that become protonated, was used in the preparation of the thin film membrane and therefore its poor soluble nature when it comes to other organic solvents [36].
The ability of TiO2NPs to exhibit high catalytic activity under the UV light irradiation and because of their very high surface to volume ratio and their ability to produce high rates surface reactions are the reasons for their being used in this study [37]. The use of TiO2NPs by photocatalysis is quite promising in the treatment of water [38]. Figure 1 displays the fabricated films appearance. It is possible to observe that the prepared CS membranes were thin and flexible, as well as smooth and transparent while the CS membrane containing nanoparticles was white in colour.
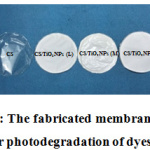 |
Figure 1: The fabricated membranes in this study for photodegradation of dyes.
|
Characterization of the Fabricated Membranes
Structural and Morphological Characterization
SEM analysis made assessment of the fabricated membranes’ morphology. Figure 2 displays the CS membrane and CS/TiO2NPs micrographs with three different amounts, together with their magnified surfaces. The CS membrane’s SEM images revealed smooth uniform surface in Figure 2(a). A topography and granulation on the surface were created by the adding nanoparticles in chitosan matrix. Figure 2(b) displays chitosan membrane’s SEM images that contained TiO2NPs (low amount of 0.03 g). The appearance of TiO2 nanoparticles was in the form of spherical particles. They were well distributed in the chitosan membrane, an indication of the immobilisation of TiO2NPs on the chitosan matrix. Figures 2(c) and (d) display chitosan membrane SEM images that contained TiO2NPs (medium amount at 0.05 g) and (high amount at 0.07 g) respectively. It was revealed through observation that increase in the amount of TiO2NPs in CS membrane will result in increase in the number of particles in the chitosan surface and with observation of a small aggregation.
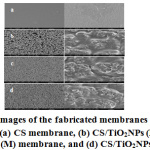 |
Figure 2: SEM images of the fabricated membranes using different magnifications: (a) CS membrane, (b) CS/TiO2NPs (L) membrane, (c) CS/TiO2NPs (M) membrane, and (d) CS/TiO2NPs (H) membrane.
|
EDX Analysis
Through the EDX analysis performance, investigations of the elemental makeups of the different prepared membranes (CS, CS/TiO2NPs (L), CS/TiO2NPs (M) and CS/TiO2NPs (H)) were carried out. Figure 3 displays the confirmation of the presence of significant amount of carbon and oxygen, the major chitosan membranes’ elements without any impurities. The presence of C, O and Ti elements is confirmed by CS/ TiO2NPs membranes’ EDX analysis. EDX spectra revealed the incorporation of TiO2NPs with percentages ranging from 20.0 to 30.0% inside CS matrix with the formation of chitosan/TiO2NPs membrane (the peak observed at 4.512 KeV is Ti). Table 2 makes a presentation of 20.85% oxygen and 79.15% carbon element composition alone in the CS membrane, while there was presence of 46.25% of oxygen, and 28.61% carbon, as well as 25.14% titanium in the CS/TiO2NPs (L) membrane. Furthermore, it was discovered that 46.89% oxygen, 27.08% carbon, and 26.03% titanium were contained in the CS/TiO2NPs (M) membrane, while there was presence of 49.30% oxygen, 19.31% carbon and 31.39% titanium in the CS/TiO2NPs (H) membrane.
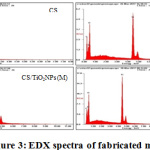 |
Figure 3: EDX spectra of fabricated membranes
|
Table 2: Element composition of the fabricated materials determined by EDX analysis
| Membrane | Element | KeV | Atomic percent (%) | Total |
|
CS |
O | 0.277 | 20.85 | 100.00 |
| C | 0.525 | 79.15 | ||
| Ti | 4.512 | 0 | ||
|
CS/TiO2NPs (L) |
O | 0.277 | 46.25 | 100.00 |
| C | 0.525 | 28.61 | ||
| Ti | 4.512 | 25.14 | ||
|
CS/TiO2NPs (M) |
O | 0.277 | 46.89 | 100.00 |
| C | 0.525 | 27.08 | ||
| Ti | 4.512 | 26.03 | ||
|
CS/TiO2NPs (H) |
O | 0.277 | 49.30 | 100.00 |
| C | 0.525 | 19.31 | ||
| Ti | 4.512 | 31.39 |
FT-IR Analysis
Figure 4 displays the CS and CS/TiO2NPs membranes’ FT-IR analysis. It is possible to assign the bands at 3364 cm-1 in the CS and CS/TiO2NPs sample spectrum to the OH groups superimposed axial stretching vibrations to the N-H stretching bands and chitosan’s intermolecular hydrogen bonds [24]. Observations of the methyl groups and of CH2 groups bending vibration in chitosan were made around 2927 cm-1 in the spectra of the two samples CS and CS/TiO2NPs [25, 26]. There is the assigning of the band at 1649 cm-1 in CS sample spectrum to C=O stretching band (amide I). The band appearing at 1261 cm-1 in the CS sample spectrum is being reported in the form of amide II C-N bonds in chitosan [28]. The emerging band at 1084 cm-1 in the CS sample spectrum, distinctive for polysaccharide and credited to the C=O stretching vibration, was moved to 1090 cm-1 in the CS/TiO2NPs sample spectrum [27]. Making comparison of the CS FT-IR spectra prior and after TiO2NPs immobilization, observation of few changes were made in the CS/TiO2NPs sample spectrum. There is the possibility of these changes indicating the communication between nanoparticles and OH groups on the TiO2NPs surface. Strong peak at 1649 cm-1 and 1084 cm-1 in CS/TiO2NPs sample spectrum was assigned to C=O stretching vibration and reduction in highest intensity 1561 cm-1 [26].
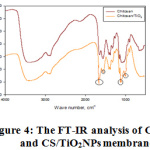 |
Figure 4: The FT-IR analysis of CS and CS/TiO2NPs membranes
|
Swelling Ratio
Determination was made for the fabricated membranes’ equilibrium swelling ratio, Seq, in 100 mL of distilled water. Obtaining the average Seq, resulted in the performance of the experiments at least three times for every membrane and the average value recorded. The standard deviations were below 6%. The experimental data displayed in Table 3 revealed the fact of CS, CS/TiO2NPs (L), CS/TiO2NPs (M), and CS/TiO2NPs (H) membranes being obtained at respectively 888.2%, 852.7%, 831.7%, 736.3%. The fabricated membranes’ swelling behaviour in the distilled water revealed the dependency of equilibrium water content on the amount of nanoparticles, and the decrease of the equilibrium water content, resulting from an increase in the amount of nanoparticles in the CS membrane. The CS membrane physical properties, like swelling, has the ability of being modified by adding of nanoparticles, thereby making some additions to the improvement of swelling ability brought about by the outer water molecules decrease getting into the membrane and resulting in the swelling percentage becoming lowered [39, 40].
Table 3: The Swelling ratio of the fabricated membranes
|
Membrane |
Sample | Wight dry membrane (g) | Wight wet membrane(g) | Seq (%) | |
| CS | 1 | 0.0331 |
0.327 |
888.2 |
|
|
2 |
0.0340 | 0.334 | |||
| 3 | 0.0352 |
0.346 |
|||
| CS/TiO2NPs (L) | 1 | 0.0379 | 0.350 |
852.7 |
|
|
2 |
0.0380 | 0.0365 | |||
| 3 | 0.0386 |
0.0375 |
|||
|
CS/TiO2NPs (M) |
1 |
0.0394 | 0.380 | 831.7 | |
| 2 | 0.0412 |
0.382 |
|||
|
3 |
0.0426 |
0.386 |
|||
|
CS/TiO2NPs (H) |
1 |
0.0539 | 0.452 | 736.3 | |
| 2 | 0.0540 |
0.454 |
|||
|
3 |
0.0554 |
0.461 |
|||
Photodegradation of Dye
Photodegradation of Cationic Dye (MB)
Investigation was conducted on the fabricated membrane’s photocatalytic activity by taking the measurement of the cationic dye decolourisation, which happened to be methyl blue (MB, 160 mg L-1) in aqueous solution. The fact that this compound’s degradation has the ability of being easily monitored using optical absorption spectroscopy (UV-Vis spectroscopy) is the reason for selecting MB as a test contaminant with regards to this study. The membrane was placed in volumetric flask that contained 100 mL of the dye solution, prior to irradiation by a UV lamp (365 nm), as a way of monitoring the fabricated membrane’s photocatalytic activity. There was magnetic stirring of the suspension in the dark at 700 rpm for a period of one hour so that an adsorption–desorption equilibrium between the photocatalyst and the dye could be attained. There was magnetic stirring of the suspension and exposure to UV light for several irradiation times. An aliquot (2 mL) was removed at every 2 min interval. Two blank photode gradation experiments under UV irradiation were carried out using TiO2NPs as photocatalyst due to absence of membrane.
Figure 5 displays MB dye colour fastness photograph during the photocatalytic reaction in the absence of photocatalyst. The fact that the colour of the dye failed to change with increasing exposure time to the UV light irradiation, an indication of MB stability, was taken notice of. Furthermore, the fact that the colour fades when 0.04 g of TiO2NPs powder was used to increase the exposure time to the UV light irradiation, which is an indication of MB decomposition, was taken notice of; though, the degradation is not complete. The colour of MB when fabricated membranes are being utilised with increase in the exposure time to the UV light irradiation, is an indication of MB dye slow decomposition.
 |
Figure 5: Photographic images representing the change in colour of the cationic dye (MB) during photodegradation under UV light irradiation.
|
Figure 6 reveals the change in the MB optical spectra absorption with the absence of photocatalyst for different time intervals. The fact that no change took place with regards to absorption peak corresponding to MB when there was increase in the irradiation time was observed. The absorption peak corresponding to MB was diminished by increasing the irradiation time through the use of TiO2NPs powder in the form of a photocatalyst in the absence of membrane for different time intervals. Nonetheless, it was discovered that there was no complete accomplishment of MB degradation. Besides, it was observed that the highest absorption corresponding to MB weakened by increasing the irradiation time when prepared membranes for different time intervals are used, prior to final disappearance, indicating that MB degradation was accomplished and no other UV-Vis spectroscopy detectable products were left in the reaction mixture. The reason for this is the start of depredation of the poly aromatic rings in the dye, which resulted in the formation of mono-substituted aromatics [41, 42]. These results are confirmation of the fact of photocatalytic process having the ability of converting toxic chemicals to non-toxic chemicals, and thus this method is considered promising in the elimination of MB from the environment.
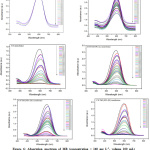 |
Figure 6: Absorption spectrum of MB (concentration = 160 mg L-1, volume 100 mL) without photocatalyst or with photocatalyst following exposure to UV light (365 nm) and temperature 25±1 °C, for absorbance measurement 350-800 nm. |
The degradation efficiency was calculated using equation 2, as shown in Table 4. It was discovered that MB failed to degrade when the photocatalyst was not utilised and only 2.64% successful MB degradation accomplishment was attained at 60 minutes. Furthermore, it was discovered that the use of TiO2NPs powder led only to 45.1% of MB degradation accomplishment. Besides, complete photodegraded MB was discovered within 50 min when CS membrane was used. It was discovered that complete MB degradation was attained within 54 min when CS/TiO2NPs (L) membrane was used. It was also discovered that 100% of MB was attained within 56 min when CS/TiO2NPs (M) membrane was utilised, while this was attained within 58 min when CS/TiO2NPs (H) membrane was utilised. It was discovered that the CS membrane performance was better, compared to CS membrane that contained TiO2NPs.
Photodegradation of Neutral Dye (NR)
The selection of NR (170 mg L-1) was due to the fact of it being a neutral dye that demonstrated a major absorption band at 518 nm, in the evaluation of the fabricated membranes’ photocatalytic performance. Similar process (section 2.5) was used for NR photodegration. Figure 7 displays the NR dye colour fastness photograph when the photocatalytic reaction was taking place in the absence of photocatalyst. It was observed that there was no change in the dye colour with increase of the time when it was exposed to the UV light irradiation, thereby indicating NR stability. It was observed that the use of TiO2NPs powder with increased exposure time to the UV light irradiation resulted in the fading of the dye colour which is an indication of NR decomposition, although such degradation was not complete. A decrease in NR colour was observed when the fabricated membranes with increase in the exposure time to the UV light irradiation was used, indicating NR dye slow decomposition.
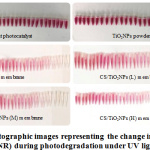 |
Figure 7: Photographic images representing the change in colour of the eutral dye (NR) during photodegradation under UV light irradiation
|
Figure 8 displays the change in the NR spectra optical absorption. It was discovered that the highest absorption corresponding to NR failed to change when UV light was used in the absence of photocatalyst, an indication that dye failed to degrade. It was observed that when TiO2NPs powder was used for different time intervals, there was a lessening of the highest absorption corresponding to NR when the irradiation time was increased. Nonetheless, there was no complete attainment of NR degradation. In contrast, it was found that when CS, CS/TiO2NPs (L), CS/TiO2NPs (M) and CS/TiO2NPs (H) membranes were utilised for different time intervals, the highest absorption corresponding to NR diminished when the irradiation time was increased, prior to their final disappearance, which is an indication that NR degradation was accomplished with no products left in the reaction mixture that were capable of being detected by UV-Vis spectroscopy.
 |
Figure 8: Absorption spectrum of NR (concentration = 170 mg L-1, volume 100 mL) following exposure to UV light 365 nm) and temperature 25±1 °C, for absorbance measurement 350-800 nm.
|
The NR photochemical degradation is presented in Table 5. It was discovered that within 60 min, 3.27% of NR degradation alone was accomplished in the absence of photocatalyst. Furthermore, it was discovered that within 60 min, the use of TiO2NPs powder succeeded in achieving 31.4% of NR degradation. It was discovered that the use of CS membrane succeeded in accomplishing 92.3% of NR within 60 min. Likewise, observation was made regarding a decrease in the absorption visible bands at 518 nm at the time of NR photodegradation under UV light irradiation. It was discovered that 99.4 % of NR was accomplished in 60 min when CS membrane containing TiO2NPs (L) membrane was used. It was discovered that 100 % of NR was accomplished in 60 min when CS/TiO2NPs (M) membrane was used. Besides, observation was made regarding a decrease in the absorption visible bands at 518 nm when NR photodegradation was going on under UV light irradiation. When CS/TiO2NPs (H) membranes were used, it was discovered that 100 % of NR was accomplished in 56 min.
Table 5: Photochemical degradation of NR under UV light using the fabricated membranes.
| NR | without photocatalyst | TiO2NPs powder | CS membrane | CS/TiO2NPs (L) membrane | CS/TiO2NPs (M) membrane | CS/TiO2NPs (H) membrane |
| T(min) | Ab(a.u) | D(%) | Ab(a.u) | D(%) | Ab(a.u) | D(%) | Ab(a.u) | D(%) | Ab(a.u) | D(%) | Ab(a.u) | D(%) |
| 0 | 2.689 | 0.00 | 2.975 | 0.00 | 2.863 | 0.00 | 2.783 | 0.00 | 2.430 | 0.00 | 2.208 | 0.00 |
| 2 | 2.685 | 0.14 | 2.929 | 1.54 | 2.638 | 7.85 | 2.567 | 7.70 | 2.204 | 9.30 | 1.898 | 14.0 |
| 4 | 2.677 | 0.44 | 2.898 | 2.58 | 2.616 | 8.62 | 2.429 | 12.7 | 2.079 | 13.7 | 1.752 | 20.6 |
| 6 | 2.674 | 0.55 | 2.814 | 5.41 | 2.567 | 10.3 | 2.291 | 17.6 | 1.982 | 18.4 | 1.701 | 22.9 |
| 8 | 2.673 | 0.59 | 2.804 | 5.74 | 2.458 | 14.1 | 2.026 | 27.2 | 1.843 | 25.3 | 1.665 | 24.5 |
| 10 | 2.670 | 0.70 | 2.755 | 7.39 | 2.337 | 18.3 | 1.817 | 34.7 | 1.814 | 25.4 | 1.464 | 33.8 |
| 12 | 2.668 | 0.78 | 2.718 | 8.63 | 2.319 | 19.0 | 1.606 | 42.2 | 1.650 | 32.0 | 1.351 | 38.8 |
| 14 | 2.667 | 0.81 | 2.702 | 9.17 | 2.231 | 22.0 | 1.593 | 42.7 | 1.522 | 37.3 | 1.217 | 44.8 |
| 16 | 2.666 | 0.85 | 2.673 | 10.1 | 2.177 | 23.9 | 1.459 | 47.5 | 1.170 | 51.8 | 1.186 | 46.2 |
| 18 | 2.665 | 0.89 | 2.645 | 11.0 | 2.096 | 26.7 | 1.203 | 56.7 | 1.114 | 54.1 | 1.157 | 47.5 |
| 20 | 2.661 | 1.04 | 2.619 | 11.9 | 2.067 | 27.8 | 1.177 | 57.7 | 1.061 | 56.3 | 1.060 | 51.9 |
| 22 | 2.657 | 1.19 | 2.566 | 13.7 | 2.015 | 29.6 | 1.145 | 58.8 | 0.979 | 59.7 | 1.048 | 52.5 |
| 24 | 2.656 | 1.22 | 2.529 | 14.9 | 1.982 | 30.7 | 1.064 | 61.7 | 0.888 | 63.4 | 0.928 | 57.9 |
| 26 | 2.650 | 1.45 | 2.500 | 15.9 | 1.893 | 33.8 | 1.035 | 62.8 | 0.824 | 66.0 | 0.906 | 58.9 |
| 28 | 2.648 | 1.52 | 2.478 | 16.7 | 1.760 | 38.5 | 0.977 | 64.8 | 0.756 | 68.8 | 0.730 | 66.9 |
| 30 | 2.646 | 1.59 | 2.446 | 17.7 | 1.612 | 43.6 | 0.824 | 70.3 | 0.718 | 70.4 | 0.593 | 73.1 |
| 32 | 2.645 | 1.63 | 2.417 | 18.7 | 1.593 | 44.3 | 0.746 | 73.1 | 0.640 | 73.6 | 0513 | 76.7 |
| 34 | 2.644 | 1.67 | 2.402 | 19.2 | 1.466 | 48.7 | 0.646 | 76.7 | 0.443 | 81.7 | 0.496 | 77.5 |
| 36 | 2.640 | 1.82 | 2.358 | 20.7 | 1.382 | 51.7 | 0.606 | 78.2 | 0.262 | 89.2 | 0.329 | 85.0 |
| 38 | 2.638 | 1.89 | 2.324 | 21.8 | 1.237 | 56.7 | 0.533 | 80.8 | 0.208 | 91.4 | 0.237 | 89.2 |
| 40 | 2.634 | 2.04 | 2.315 | 22.1 | 1.160 | 59.4 | 0.415 | 85.0 | 0.181 | 92.5 | 0.208 | 90.5 |
| 42 | 2.632 | 2.11 | 2.296 | 22.8 | 1.034 | 59.5 | 0.301 | 89.1 | 0.159 | 93.4 | 0.152 | 93.1 |
| 44 | 2.621 | 2.52 | 2.244 | 24.5 | 0.955 | 63.8 | 0.140 | 94.9 | 0.147 | 93.9 | 0.142 | 93.5 |
| 46 | 2.615 | 2.75 | 2.228 | 25.1 | 0.876 | 69.4 | 0.119 | 95.7 | 0.127 | 94.7 | 0.132 | 94.0 |
| 48 | 2.608 | 3.01 | 2.200 | 26.0 | 0.811 | 71.6 | 0.083 | 97.0 | 0.118 | 95.1 | 0.123 | 94.4 |
| 50 | 2.606 | 3.08 | 2.151 | 27.6 | 0.753 | 73.6 | 0.075 | 97.3 | 0.086 | 96.4 | 0.086 | 96.1 |
| 52 | 2.605 | 3.12 | 2.139 | 28.1 | 0.631 | 77.9 | 0.065 | 97.6 | 0.025 | 98.9 | 0.032 | 98.5 |
| 54 | 2.604 | 3.16 | 2.129 | 28.4 | 0.508 | 82.2 | 0.054 | 98.0 | 0.016 | 99.3 | 0.012 | 99.4 |
| 56 | 2.603 | 3.19 | 2.100 | 29.4 | 0.415 | 85.5 | 0.032 | 98.8 | 0.010 | 99.5 | 0 | 100.0 |
| 58 | 2.602 | 3.23 | 2.084 | 29.9 | 0.347 | 87.8 | 0.025 | 99.1 | 0.01 | 99.6 | ||
| 60 | 2.601 | 3.27 | 2.039 | 31.4 | 0.220 | 92.3 | 0.014 | 99.4 | 0 | 100.0 |
The selection of fast green (FG) was made as an anionic dye displaying a significant absorption band at 623 nm, for the evaluation of the fabricated membranes’ photocatalytic performance. Identical process (section 2.5) was used for FG photodegration (30 mg L-1). In Figure 9, the FG dye colour fastness at the time that the photocatalytic reaction was taking place in absence of photocatalyst, as can be observed, failed to change even with increase in the time exposure to the UV light irradiation, thereby indicating FG stability. In contrast, the dye’s colour faded when TiO2NPs powder was used in the form of a photocatalyst, indicating FG decomposition; nonetheless, the degradation is not complete. Furthermore, it was discovered that the FG dye slowly decomposes when the fabricated membranes was used with increase in the exposure time to the UV light irradiation.
Photodegradation of Anionic Dye (FG)
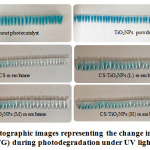 |
Figure 9: Photographic images representing the change in colour of the anionic dye (FG) during photodegradation under UV light irradiation. |
Figure 10 displays the change in the FG spectra’s optical absorption for different time intervals. Observation was made that the highest absorption corresponding to FG failed to change in the absence of the photocatalyst use when irradiation time was increased. Change took place in the FG spectra’s optical absorption when TiO2NPs powder was used for different time intervals, and it was observed that the highest absorption corresponding to FG was diminished by increasing the irradiation time; nonetheless, complete FG degradation was not achieved. It was further observed that there was reduction in the absorption peak corresponding to FG by increase in the irradiation time when membranes were used in the form of photocatalyst, prior to final disappearance that indicated the accomplishment of FG degradation without UV-Vis spectroscopy detecting any other product left in the reaction mixture. The start of degradation of the poly aromatic rings in the dye resulting in the formation of mono-substituted aromatics was the reason for this [41, 42]. This result is confirmation of the ability of the photo catalytic process in converting toxic chemicals to non-toxic chemicals, and therefore this procedure is seen as promising in the elimination of FG.
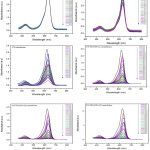 |
Figure 10: Absorption spectrum of FG (concentration = 30 mg L-1, volume 100 mL) without photocatalyst or with photocatalyst following exposure to UV light (365 nm) and temperature 25±1 °C, for absorbance measurement 350-800 nm.
|
Table 6 is a presentation of FG photochemical degradation in the absence of photocatalyst. It was discovered that 3.16% of FG degradation was accomplished within 60 min when UV light alone was used. It was discovered that 31.07% of FG degradation was accomplished when TiO2NPs powder was used. Furthermore, it was discovered that 87.10 % of FG was accomplished when CS membrane was used. It was discovered that 99.70 % of FG was accomplished when CS/TiO2NPs (L) membrane was utilised, while it was discovered that 100 % of FG was accomplished within 60 min when CS/TiO2NPs (M) membrane was utilised, and the same 100% was accomplished with 56 min when CS/TiO2NPs (H) membrane was used.
Table 6: Photochemical degradation of FG under UV light using the fabricated membranes.
| FG | without photocatalyst | TiO2NPs powder | CS membrane | CS/TiO2NPs (L) membrane | CS/TiO2NPs (M) membrane | CS/TiO2NPs (H) membrane | ||||||
| T(min) | Ab(a.u) | D(%) | Ab(a.u) | D(%) | Ab(a.u) | D(%) | Ab(a.u) | D(%) | Ab(a.u) | D(%) | Ab(a.u) | D(%) |
| 0 | 2.999 | 0.00 | 2.967 | 0.00 | 2.731 | 0.00 | 2.413 | 0.00 | 2.377 | 0.00 | 2.170 | 0.00 |
| 2 | 2.995 | 0.13 | 2.913 | 1.82 | 2.413 | 11.6 | 2.036 | 15.6 | 2.003 | 15.7 | 1.824 | 15.9 |
| 4 | 2.994 | 0.16 | 2.874 | 3.13 | 2.356 | 13.7 | 1.878 | 22.1 | 1.789 | 24.8 | 1.506 | 30.5 |
| 6 | 2.992 | 0.23 | 2.811 | 5.25 | 2.079 | 23.8 | 1.645 | 31.8 | 1.502 | 36.8 | 1.222 | 43.6 |
| 8 | 2.991 | 0.26 | 2.783 | 6.20 | 1.986 | 27.2 | 1.427 | 40.8 | 1.413 | 40.5 | 1.210 | 44.2 |
| 10 | 2.987 | 0.40 | 2.732 | 7.92 | 1.887 | 30.9 | 1.235 | 48.8 | 1.275 | 46.3 | 1.164 | 46.3 |
| 12 | 2.986 | 0.43 | 2.683 | 9.57 | 1.632 | 40.2 | 0.977 | 59.5 | 1.163 | 51.0 | 0.990 | 54.3 |
| 14 | 2.984 | 0.50 | 2.662 | 10.2 | 1.622 | 40.6 | 0.775 | 67.8 | 0.837 | 64.7 | 0.819 | 62.2 |
| 16 | 2.981 | 0.60 | 2.635 | 11.1 | 1.545 | 43.4 | 0.760 | 68.5 | 0.714 | 69.9 | 0.730 | 66.3 |
| 18 | 2.977 | 0.73 | 2.626 | 11.4 | 1.518 | 44.4 | 0.683 | 71.6 | 0.682 | 71.3 | 0.542 | 75.0 |
| 20 | 2.974 | 0.83 | 2.615 | 11.8 | 1.497 | 45.1 | 0.601 | 75.0 | 0.583 | 75.4 | 0.458 | 78.8 |
| 22 | 2.967 | 1.06 | 2.596 | 12.5 | 1.464 | 46.3 | 0.577 | 76.0 | 0.541 | 77.2 | 0.391 | 81.9 |
| 24 | 2.965 | 1.13 | 2.586 | 12.8 | 1.410 | 48.3 | 0.555 | 76.9 | 0.538 | 77.3 | 0.276 | 87.2 |
| 26 | 2.964 | 1.16 | 2.544 | 14.2 | 1.361 | 50.1 | 0.524 | 78.2 | 0.442 | 81.4 | 0.244 | 88.7 |
| 28 | 2.958 | 1.36 | 2.511 | 15.3 | 1.260 | 53.8 | 0.437 | 81.8 | 0.400 | 83.1 | 0.237 | 89.0 |
| 30 | 2.957 | 1.40 | 2.485 | 16.2 | 1.192 | 56.3 | 0.337 | 86.0 | 0.348 | 85.3 | 0.212 | 90.2 |
| 32 | 2.949 | 1.66 | 2.469 | 16.7 | 1.188 | 56.4 | 0.335 | 86.1 | 0.315 | 86.4 | 0.158 | 92.7 |
| 34 | 2.944 | 1.83 | 2.444 | 17.6 | 1.138 | 58.3 | 0.318 | 86.8 | 0.265 | 88.8 | 0.146 | 93.2 |
| 36 | 2.941 | 1.93 | 2.421 | 18.4 | 1.082 | 60.3 | 0.262 | 89.1 | 0.233 | 90.1 | 0.124 | 94.2 |
| 38 | 2.940 | 1.96 | 2.413 | 18.6 | 1.045 | 61.7 | 0.209 | 91.3 | 0.211 | 91.1 | 0.122 | 94.3 |
| 40 | 2.933 | 2.20 | 2.383 | 19.6 | 1.040 | 61.9 | 0.173 | 92.8 | 0.181 | 92.3 | 0.117 | 94.6 |
| 42 | 2.930 | 2.30 | 2.363 | 20.3 | 0.962 | 64.7 | 0.136 | 94.3 | 0.176 | 92.5 | 0.097 | 95.5 |
| 44 | 2.929 | 2.33 | 2.329 | 21.5 | 0.914 | 66.5 | 0.121 | 94.9 | 0.150 | 93.6 | 0.081 | 96.0 |
| 46 | 2.925 | 246 | 2.277 | 23.2 | 0.838 | 69.3 | 0.100 | 95.8 | 0.145 | 93.8 | 0.080 | 96.2 |
| 48 | 2.922 | 2.56 | 2.260 | 23.8 | 0.832 | 69.5 | 0.088 | 96.3 | 0.137 | 94.2 | 0.079 | 96.3 |
| 50 | 2.918 | 2.70 | 2.194 | 26.0 | 0.779 | 71.4 | 0.061 | 97.4 | 0.108 | 95.4 | 0.076 | 96.4 |
| 52 | 2.912 | 2.90 | 2.173 | 26.7 | 0.754 | 72.3 | 0039 | 98.3 | 0.100 | 95.7 | 0.048 | 97.7 |
| 54 | 2.910 | 2.96 | 2.137 | 27.9 | 0.675 | 75.2 | 0.026 | 98.9 | 0.094 | 96.0 | 0.041 | 98.1 |
| 56 | 2.908 | 3.03 | 2.084 | 29.7 | 0.609 | 77.7 | 0.013 | 99.4 | 0.046 | 98.0 | 0 | 100.0 |
| 58 | 2.905 | 3.13 | 2.061 | 30.5 | 0.564 | 79.3 | 0.008 | 99.6 | 0.003 | 99.9 | ||
| 60 | 2.904 | 3.16 | 2.045 | 31.07 | 0.351 | 87.1 | 0.005 | 99.7 | 0 | 100.0 | ||
Mechanism of Reaction
Pseudo-first order kinetics: have been used extensively to describe experimental data, the capability of equations to describe experimental kinetic data has been assessed by fitting these rate laws to experimental data. Where the theoretical equations are used to correlate experimental data for sorption kinetics of some solutes on various sorbents. In(/) = , was used in the computation of the reaction rate in the photodegradation experiment, where the absorptions measured at different illumination times are represented by and and the reaction rate is represented by , while the reaction time during the decomposition of dye is represented by [43-47]. The computation of the reaction rate () for the dye photodecomposition was conducted by plotting a graph between In (/) and . The relationship between In (/) and in the form of an irradiation time function is presented in Figure 11.
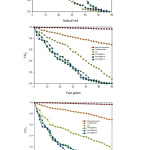 |
Figure 11: Degradation kinetics of dyes with respect to time (C0 and C are the equilibrium concentrations of the dye before and after photodegradation
|
AOP is hydroxyl radicals’ highly dependent chemical oxidation process for the removal of organic compounds present in water [48]. The triggering of photocatalytic reactions takes place when a photon with a higher energy compared to its band gap is absorbed by a photocatalyst like TiO2NPs (Figure 12). Next, the formation of an electron-hole pair occurs when an electron in the valence band excites to the conduction band. The electron-hole pair and excited conduction-band electrons have the ability of migrating to the TiO2NPs surface for the inducement of oxidation and reduction procedures. The oxygen molecules then scavenged the electrons from the TiO2NPs conduction for the formation of superoxide ions (O2–). The formation of hydroxyl radicals (×OH) takes place when there is a reaction of the superoxide ions with protons or when there is reaction of water molecules with an electron-hole pair [49]. Repeated hydroxyl radicals and superoxide ions attacks will eventually result in organic compounds degradation that includes dyes [50].
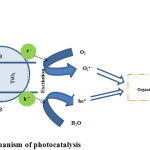 |
Figure 12: Mechanism of photocatalysis
|
There was fabrication of nanocomposite membranes on the basis of CS/TiO2NPs. Nanocomposite membranes’ characterisation was undertaken through the use of several surface and analytical techniques, as a way of evaluating the TiO2NPs incorporation effect in the chitosan matrix. There are variations in the developed nanocomposite films’ photocatalytic degradation based on nanoparticles and irradiation time concentration, FT-IR analysis made it possible for the molecular interactions’ characterisation taking place after TiO2NPs inclusion, and surface analysis (SEM and EDX) clearly showed nanoparticles’ presence with large surface area. There was exhibition of significant photocatalytic activity by membranes that contained photocatalyst nanoparticles under UV radiation against different types of dyes that were studied. The results recommended the suitability of the TiO2NPs incorporation to CS composite membrane for the development of photocatalytic degradation membrane.
Acknowledgements
We are profoundly indebted to Chemistry Department, Taif University, Kingdom of Saudi Arabia for providing the research facilities.
Reference
- McLaren, J.; Williams, I. The impact of communicating information about air pollution events on public health. Science of the Total Environment. 2015, 538, 478-491
CrossRef - Lianos, P. Production of electricity and hydrogen by photocatalytic degradation of organic wastes in a photoelectrochemical cell: the concept of the photofuelcell: a review of a re-emerging research field. Journal of Hazardous Materials. 2011, 185, 575-590
CrossRef - Reddy, P. V. L.; Kim, K. H. A review of photochemical approaches for the treatment of a wide range of pesticides. Journal of hazardous materials. 2015, 285, 325-335
CrossRef - Nguyen, A. T.; Juang, R. S. Photocatalytic degradation of p-chlorophenol by hybrid H2O2 and TiO2 in aqueous suspensions under UV irradiation. Journal of environmental management. 2015, 147, 271-277
CrossRef - Shinde, S.; Bhosale, C.; Rajpure, K. Photodegradation of organic pollutants using N-titanium oxide catalyst. Journal of Photochemistry and Photobiology B: Biology. 2014, 141, 186-191
CrossRef - Jo, W. K.; Tayade, R. J. New generation energy-efficient light source for photocatalysis: LEDs for environmental applications. Industrial & Engineering Chemistry Research. 2014, 53, 2073-2084
CrossRef - Jo, W. K.; Tayade, R. J. Recent developments in photocatalytic dye degradation upon irradiation with energy-efficient light emitting diodes. Chinese Journal of Catalysis. 2014, 35, 1781-1792
CrossRef - Yagub, M. T.; Sen, T. K.; Afroze, S.; Ang, H. M. Dye and its removal from aqueous solution by adsorption: a review. Advances in colloid and interface. 2014, 209, 172-184
CrossRef - Priyaragini, S.; Veena, S.; Swetha, D.; Karthik, L.; Kumar, G.; Rao, K. B. Evaluating the effectiveness of marine actinobacterial extract and its mediated titanium dioxide nanoparticles in the degradation of azo dyes. Journal of Environmental Sciences. 2014, 26, 775-782
CrossRef - Zaharia, C.; Suteu, D.; Muresan, A.; Muresan, R.; Popescu, A. Textile wastewater treatment by homogenous oxidation with hydrogen peroxide. Environmental Engineering and Management Journal. 2009, 8, 1359-1369
CrossRef - Baban, A.; Yediler, A.; Ciliz, N. K. Integrated water management and CP implementation for wool and textile blend processes. CLEAN–Soil, Air, Water. 2010, 38, 84-90
CrossRef - Sarayu, K.; Sandhya, S. Current technologies for biological treatment of textile wastewater–a review. Applied biochemistry and biotechnology.2012, 167, 645-661
CrossRef - Dawood, S.; Sen, T. K.; Phan, C. Synthesis and characterisation of novel-activated carbon from waste biomass pine cone and its application in the removal of congo red dye from aqueous solution by adsorption. Water, Air, & Soil Pollution. 2014, 225, 1818
CrossRef - Yamjala, K.; Nainar, M. S.; Ramisetti, N. R. Methods for the analysis of azo dyes employed in food industry–a review. Food chemistry. 2016, 192, 813-824
CrossRef - Ghaedi, M.; Sadeghian, B.; Pebdani, A. A.; Sahraei, R.; Daneshfar, A.; Duran, C. Kinetics, thermodynamics and equilibrium evaluation of direct yellow 12 removal by adsorption onto silver nanoparticles loaded activated carbon. Chemical Engineering Journal. 2012, 187, 133-141
CrossRef - Natarajan, S., H.C. Bajaj, and R.J. Tayade, Recent advances based on the synergetic effect of adsorption for removal of dyes from waste water using photocatalytic process. Journal of Environmental Sciences, 2018. 65: p. 201-222.
CrossRef - Fu, J.; Kyzas, G. Z. Wet air oxidation for the decolorization of dye wastewater: an overview of the last two decades. Chinese Journal of Catalysis. 2014, 35, 1-7
CrossRef - Alzahrani, S.; Mohammad, A. W. Challenges and trends in membrane technology implementation for produced water treatment: A review. Journal of Water Process Engineering. 2014, 4, 107-133
CrossRef - Sharma, G.; Kumar, A.; Sharma, S.; Naushad, M.; Dwivedi, R. P.; ALOthman, Z. A.; Mola, G. T. Novel development of nanoparticles to bimetallic nanoparticles and their composites: a review. Journal of King Saud University-Science. 2019, 31, 257-269
CrossRef - Dhir, A.; Prakash, N. T.; Sud, D. Comparative studies on TiO2/ZnO photocatalyzed degradation of 4-chlorocatechol and bleach mill effluents. Desalination and Water Treatment. 2012, 46, 196-204
CrossRef - Surwase, S. V.; Deshpande, K. K.; Phugare, S. S.; Jadhav, J. P. Biotransformation studies of textile dye Remazol Orange 3R. 3 Biotech. 2013, 3, 267-275
CrossRef - Zhang, L.; Yu, W.; Han, C.; Guo, J.; Zhang, Q.; Xie, H.; Shao, Q.; Sun, Z.; Guo, Z. Large scaled synthesis of heterostructured electrospun TiO2/SnO2 nanofibers with an enhanced photocatalytic activity. Journal of The Electrochemical Society. 2017, 164, H651-H656
CrossRef - Phoon, B. L. Photodegradation of dyes in binary system using titanium dioxide through statistical approach. UTAR. 2014
CrossRef - Šíma, J.; Hasal, P. Photocatalytic degradation of textile dyes in a TiO2/UV system. Chemical Engineering. 2013, 32, 79-84
CrossRef - Hu, J.; Li, H.; Muhammad, S.; Wu, Q.; Zhao, Y.; Jiao, Q. Surfactant-assisted hydrothermal synthesis of TiO2/reduced graphene oxide nanocomposites and their photocatalytic performances. Journal of Solid State Chemistry. 2017, 253, 113-120
CrossRef - Lian, M.; Wu, X.; Wang, Q.; Zhang, W.; Wang, Y. Hydrothermal synthesis of Polypyrrole/MoS2 intercalation composites for supercapacitor electrodes. Ceramics International. 2017, 43, 9877-9883
CrossRef - Farzana, M. H.; Meenakshi, S. Synergistic effect of chitosan and titanium dioxide on the removal of toxic dyes by the photodegradation technique. Industrial & Engineering Chemistry Research. 2013, 53, 55-63
CrossRef - Nel, A. E.; Mädler, L.; Velegol, D.; Xia, T.; Hoek, E. M.; Somasundaran, P.; Klaessig, F.; Castranova, V.; Thompson, M. Understanding biophysicochemical interactions at the nano–bio interface. Nature materials. 2009, 8, 543
CrossRef - Bashar, M. M.; Khan, M. A. An overview on surface modification of cotton fiber for apparel use. Journal of Polymers and the Environment. 2013, 21, 181-190
CrossRef - Acharyulu, S. R.; Gomathi, T.; Sudha, P. Physico-chemical characterization of cross linked chitosan-polyacrylonitrile polymer blends. Der Pharmacia Lettre. 2013, 5, 354-363
CrossRef - Ahmed, R. A.; Fadl-allah, S. A.; El-Bagoury, N.; El-Rab, S. M. G. Improvement of corrosion resistance and antibacterial effect of NiTi orthopedic materials by chitosan and gold nanoparticles. Applied Surface Science. 2014, 292, 390-399
CrossRef - Pauliukaite, R.; Ghica, M. E.; Fatibello-Filho, O.; Brett, C. M. Comparative study of different cross-linking agents for the immobilization of functionalized carbon nanotubes within a chitosan film supported on a graphite− epoxy composite electrode. Analytical chemistry. 2009, 81, 5364-5372
- Ahmed, R. A.; Fekry, A. Preparation and characterization of a nanoparticles modified chitosan sensor and its application for the determination of heavy metals from different aqueous media. International Journal of Electrochemical Science. 2013, 8, 6692-6708
- Carvalho, C. R.; López-Cebral, R.; Silva-Correia, J.; Silva, J. M.; Mano, J. F.; Silva, T. H.; Freier, T.; Reis, R. L.; Oliveira, J. M. Investigation of cell adhesion in chitosan membranes for peripheral nerve regeneration. Materials Science and Engineering: C. 2017, 71, 1122-1134
CrossRef - Alzahrani, E. Zinc oxide nanopowders prepared by the sol-gel process for the efficient photodegradation of methyl orange. Current Analytical Chemistr.y 2016, 12, 465-475
CrossRef - Malhotra, M.; Lane, C.; Tomaro-Duchesneau, C.; Saha, S.; Prakash, S. A novel method for synthesizing PEGylated chitosan nanoparticles: strategy, preparation, and in vitro analysis. International journal of nanomedicine. 2011, 6, 485
CrossRef - Choi, Y. I.; Jeon, K. H.; Kim, H. S.; Lee, J. H.; Park, S. J.; Roh, J. E.; Khan, M. M.; Sohn, Y. TiO2/BiOX (X= Cl, Br, I) hybrid microspheres for artificial waste water and real sample treatment under visible light irradiation. Separation and Purification Technology. 2016, 160, 28-42
CrossRef - Lazar, M. A.; Varghese, S.; Nair, S. S. Photocatalytic water treatment by titanium dioxide: recent updates. Catalysts. 2012, 2, 572-601
CrossRef - Gierszewska, M.; Ostrowska-Czubenko, J. Equilibrium swelling study of crosslinked chitosan membranes in water, buffer and salt solutions. Progress on Chemistry and Application of Chitin and its Derivatives. 2016, 21, 55-62
CrossRef - Jiang, C.; Wang, Z.; Zhang, X.; Zhu, X.; Nie, J.; Ma, G. Crosslinked polyelectrolyte complex fiber membrane based on chitosan–sodium alginate by freeze-drying. RSC Advances. 2014, 4, 41551-41560
CrossRef - Gurr, E. Synthetic dyes in biology, medicine and chemistry. Elsevier. 2012
- Alzahrani, E. Photodegradation of eosin Y using silver-doped magnetic nanoparticles. International Journal of Analytical Chemistry. 2015. 2015.
CrossRef - Asiri, A. M.; Al-Amoudi, M. S.; Al-Talhi, T. A.; Al-Talhi, A. D. Photodegradation of Rhodamine 6G and phenol red by nanosized TiO2 under solar irradiation. Journal of Saudi Chemical Society. 2011, 15, 121-128
CrossRef - Gupta, V. K.; Jain, R.; Agarwal, S.; Nayak, A.; Shrivastava, M. Photodegradation of hazardous dye quinoline yellow catalyzed by TiO2. Journal of colloid and interface science. 2012, 366, 135-140
CrossRef - Solomon, R.; Lydia, I. S.; Merlin, J.; Venuvanalingam, P. Enhanced photocatalytic degradation of azo dyes using nano Fe3O4. Journal of the Iranian Chemical Society. 2012, 9, 101-109
CrossRef - Thirumalairajan, S.; Girija, K.; Mastelaro, V. R.; Ponpandian, N. Photocatalytic degradation of organic dyes under visible light irradiation by floral-like LaFeO 3 nanostructures comprised of nanosheet petals. New Journal of Chemistry. 2014, 38, 5480-5490
CrossRef - Yao, Y.; Cai, Y.; Lu, F.; Wei, F.; Wang, X.; Wang, S. Magnetic recoverable MnFe2O4 and MnFe2O4-graphene hybrid as heterogeneous catalysts of peroxymonosulfate activation for efficient degradation of aqueous organic pollutants. Journal of hazardous materials. 2014, 270, 61-70
CrossRef - Shao, G. N.; Kim, Y.; Imran, S.; Jeon, S. J.; Sarawade, P. B.; Hilonga, A.; Kim, J.-K.; Kim, H. T. Enhancement of porosity of sodium silicate and titanium oxychloride based TiO2–SiO2 systems synthesized by sol–gel process and their photocatalytic activity. Microporous and Mesoporous Materials. 2013, 179, 111-121
CrossRef - Shon, H.; Phuntsho, S.; Vigneswaran, S.; Kandasamy, J.; Nghiem, L.; Kim, G.; Kim, J.; Kim, J.-H. Preparation of titanium dioxide nanoparticles from electrocoagulated sludge using sacrificial titanium electrodes. Environmental science & technology. 2010, 44, 5553-5557
CrossRef - Samsudin, E. M.; Goh, S. N.; Wu, T. Y.; Ling, T. T.; Hamid, S. A.; Juan, J. C. Evaluation on the photocatalytic degradation activity of reactive blue 4 using pure anatase nano-TiO2. Sains Malaysiana. 2015, 44, 1011-1019
CrossRef


![]()


