Simultaneous Estimation of Gallic Acid and Embelin by Validated HPTLC Method in Three Marketed Formulations and in-House Formulated Manibhadra Yoga: A Polyherbal Ayurvedic Formulation
1Central Facility of Instrumentation, Faculty of Pharmacy, IFTM University, Moradabad, 244102, India
2Kailash Institute of Pharmacy & Management, GIDA, Gorakhpur, 273209, India.
Corresponding Author E-mail: gulzaralamiftm@yahoo.com
DOI : http://dx.doi.org/10.13005/ojc/360116
Download this article as:
![]()
Manibhadra Yoga Polyherbal Formulation (MYPF) is an official classical polyherbal formulation, mentioned in Ayurvedic Formulary of India (AFI) and commonly indicated in skin’s diseases, abdomen’s problems, splenic disease, worm’s infestation and respiratory diseases. The two biomarker gallic acid and embelin are simultaneously estimated in in-house formulated MYPF by validated high performance thin layer chromatography (HPTLC) method. The developed HPTLC method was validated on the basis of precision, linearity, specificity, LOD, LOQ, accuracy and robustness. Aluminum backed TLC of silica gel 60F254 plate is use stationary phase while for mobile phase toluene: ethyl acetate: methanol: formic acid (5: 4: 0.5: 0.5 v/v) is used. LOD for gallic acid was found to be 75.24 ng/spot and for embelin was 81.60 ng/spot while LOQ for gallic acid was found 227.99 ng/spot and for embelin 247.28 ng/spot. Percentage recovery was found to be in range of 99.59-100.71 for gallic acid and 99.29-98.96 for embelin confirmed that the method was accurate. The content of gallic acid and embelin in in-house formulated MYPF were found to be 46.57 ± 0.814 & 16.15 ± 0.180 g/mg of formulation respectively which showed highest among all tested marketed formulations (MYPF-M1, MYPF-M2 & MYPF-M3). The proposed validated HPTLC method provides a new way for standardization and quantitative estimation of gallic acid and embelin in MYPF.
KEYWORDS:Embelin; Gallic Acid; HPTLC; MYPF; Standardization; Validation
Introduction
Ayurveda is a time-tested, trusted worldwide plant based oldest system of medicine which is gradually developed with the time through daily life experiences with the mutual relationship between mankind and nature 1 and its main objective are preventing and curing the disease. Major formulations used in Ayurveda are based on herbs. Some time herbs are also combined with mineral preparations.2
MYPF is an official classical polyherbal formulation, mentioned in AFI 3. It is commonly indicated in skin’s diseases, abdomen’s problems, splenic disease, worms’ infestation and respiratory diseases. MYPF consists of official traditional four medicinal herbs like Vidanga-fruit, (Embelia ribes Burm. f. 48g), Amalaki- fruit preicarp,(Emblica officinalis Geartn, 48g), Haritaki- fruit preicarp,(Terminalia chebula Retz. 48g), Nishotha or Trivrt- Root,(Operculina turpethum Linn. 144g) and Guda (Jeggary, 576g). MYPF is an example of Avaleha kalpana in Ayurvedic formulation because of their easy acceptance.
Chemical constituents present in plants are very complex in nature and quantitatively differ when they are cultivated at different places so it is difficult to establish quality control parameter for plant based Ayurvedic formulations.4 Thus quality control of such Ayurvedic formulations is a challenge for herbal drug industry and other drug development organization and is an important task to developed reliable method for the same.5 Standardization is stepwise method to confirm a consistent biological activity and a consistent chemical profile of Ayurvedic formulation. Standardization is the process of developing and agreeing upon technical standards. Hence standardization is a tool in the quality control process.6 HPTLC is time tested method for marker based analysis, both qualitative and quantitative, for herbal raw materials and finished Ayurvedic products.7 HPTLC is most appropriate method provides fingerprint profile and marker-based standardization of Ayurvedic drugs/formulations.8-9
Gallic acid and embelin are common phytoconstituents present in MYPF and quantitative estimation of both phytochemical may be used quality control of MYPF on regular basis. Therefore the present study was directed towards validation of developed method of HPTLC and quantitative determination of biomarkers, gallic acid and embelin in MYPF by the HPTLC chromatographic method to ensure the quality standard of polyherbal Ayurvedic formulation.
Experimental
Plant Materials
All four dried crude drugs, used in formulation, were purchased from local ayurvedic crude drug seller, Banaras Hindu University (BHU), Varanasi (U.P.), India. The crude drugs were authenticated by Emeritus Scientist of CSIR-NISCAIR, New Delhi, India. Specimens of all four crude drugs (NISCAIR/RHMD/Consult/2017/3070-19-1, 2, 3 &4) have been submitted in CSIR-NISCAIR Museum, for future reference.
Reagents
The biomarkers Gallic acid (Hi media, Mumbai, India) and Embelin (Natural Remedies, Bangalore, India) were used as working standards. Methanol, toluene, formic acid and ethyl acetate were purchased from SDF Chem. Ltd. (Mumbai, India).
Preparation of MYPF
MYPF was prepared in Advanced Natural Product Laboratory, KIPM, GIDA, Gorakhpur, (U.P.), India, as per the method described in AFI. The prepared avaleha was stored in amber colored container for a few days in cool place for maturation.
Preparation of Gallic Acid (std) and Embelin (std) Solution
Weighed quantity of gallic acid (10mg) and embelin (10mg) were taken in 10 ml volumetric flask separately and dissolved in HPLC grade water and make up volume upto mark. Thus stock solution (1mg/ml) of gallic acid and embelin were prepared and from this, working standard (std) solutions (200 μg/ml to 1200 μg/ml) were prepared.
Preparation of MYPF Solution
Dried 100mg of in-house formulated MYPF and its market formulations (MYPF-M1, MYPF-M2 & MYPF-M3) were extracted by maceration process with 100 ml HPLC grade methanol for three days. After three days, the extracts were collected and the marc was further extracted by maceration process with 100 ml HPLC grade methanol for three days for each formulations. This process was repeated one more time with the marc. Extraction efficiency test was carried out to check the complete extraction of marker compounds from the sample. All extracts were combined and concentrated under reduced temperature. After complete drying of extract, a solution of 1mg/ml (stock solution) was prepared in HPLC grade methanol. Diluted extract was filtered through filter paper and again through 0.2 μm syringe filters for further chromatographic studies. Further required dilutions for the study were made in mobile phase.
Procedure and Analytical Conditions
Aluminum backed TLC of silica gel 60F254 plates (10×10 cm, 0.2mm thickness) previously dried at 1100C for 30 m in oven and placed in a desiccator, are used for analysis. Application of standard and sample solutions was done as 8mm wide band width by Hamilton micorsyringe with the help of Linomat V applicator. Spotted TLC plate was developed ascending pattern in a saturated CAMAG twin trough glass chamber, using toluene: ethyl acetate: methanol: formic acid (5: 4: 0.5: 0.5 v/v) as a mobile phase, at 25 ± 20C, migration distance 80 mm for both gallic acid and embelin. The developed plates were dried at 600C. Developed plate was kept in CAMAG TLC Scanner 3 densitometer for scanning at λmax = 254 nm for gallic acid and embelin using UV light. The HPTLC system equipped with winCATS Software,
Calibration Curve of Marker Compounds (Gallic Acid and Embelin)
Exactly 10 μl both gallic acid and embelin standard solutions were spotted on TLC plates. Plates were developed in a mobile phase at 25±2°C. The developed plates were dried at 600C in an oven for 5 m. Dried plates were scanned at 254nm for gallic acid and embelin. Data of peak areas were recorded. Standard curves for gallic acid and embelin were formed by plotting peak areas versus concentration.
Method Validation
The ICH (International Conference on Harmonization) documents were used for the validation of developed HPTLC procedure 10-11.
Linearity
For linearity, standard curves of gallic acid and embelin were prepared. The relationships between peak areas versus concentration were established form linear regression line and expressed in terms of correlation coefficient.
Precision
The intraday precision was calculated by analyzing both gallic acid and embelin standard solutions at three different concentration (200, 400 and 600 ng/spot, n=6) on the same day. The interday precision was calculated by analyzing both gallic acid and embelin standard solutions at three different concentration (200, 400 and 600 ng/spot), for three different days.
Limit of Detection (LOD) and Limit of Quantitation (LOQ)
LOD was calculated at a signal-to-noise ratio of 3:1 and LOQ at signal-to-noise ratio of 10:1. Both were calculated from the equations LOD= 3 x δ/s and LOQ= 10 x δ/s (δ = SD of the peak area and s = slope of plot).
Accuracy
Accuracy was estimated through the % recoveries of known quantities of the combination of gallic acid and embelin added to solution with formulation. The specificity of the method was established by comparing of overlain spectra and Rf values gallic acid, embelin and samples. The peak purity of gallic acid and embelin were determined by comparing the spectra.
Robustness Study
The robustness was determined by varying the chamber saturation time by ± 10 m, changing detecting wavelength by ± 2 nm and varying the composition of major solvent (toluene and ethyl acetate) by ± 0.5 ml.
Simultaneous Determination of Gallic Acid and Embelin
10 μl (10μg) of MYPF and its market formulations (MYPF-M1, MYPF-M2 & MYPF-M3) were spotted in previously dried silica gel 60F254 plate. Developed plate was scanned as per the method described earlier. The data fro peak areas were noted. The quantity of gallic acid and embelin in formulations (MYPF-M1, MYPF-M2 & MYPF-M3) were calculated from equation of linear regression line obtained from curves of standard gallic acid and standard embelin. The results of triplicate analysis were expressed as average amount of gallic acid and embelin in µg/mg of formulation.
Result and Discussion
Selection of Mobile Phase
Selection of mobile phase is an art for development of successful HPTLC method. It involves a number of trails with different solvent system in different ratio. For this HPTLC method development, solvent system of toluene: methanol: formic acid: chloroform, toluene: formic acid: ethyl acetate and toluene: methanol: ethyl acetate: formic acid in different proportion was studied. The solvent system toluene: ethyl acetate: methanol: formic acid in ratio of 5: 4: 0.5: 0.5 showed clear and sharp peaks with significant area of gallic acid and embelin in formulation and selected.
Validation of Developed HPTLC Method
The linearity for gallic acid and embelin were determined by plotting a graph between peak area and concentration. Correlation coefficient was used to established linearity. Linearity for both themarker were linear over range 200-1200 ng/spot showing the calibration curve equation and correlation coefficient (r2) were y = 0.833x + 369.30, r² = 0.9992 and y = 18.35x + 2611.00, r² = 0.9991 for gallic acid and embelin respectively (Fig. 1 and Fig. 2). The correlation coefficient (r2) value confirms linear relationship between the concentration and peak area (Table 1).
Table 1: Linearity (calibration curve) data for standard gallic acid and embelin (Concentration Vs Peak area) (mean ± SD, n=3)
|
S. No |
Conc. of gallic acid (ng/spot) |
AUC |
% RSD |
Conc. of embelin (ng/spot) |
AUC |
% RSD |
|
1 |
200 |
535.67 ± 8.51 |
1.59 |
200 |
6215.33 ± 4.51 |
0.07 |
|
2 |
400 |
692.67 ± 5.03 |
0.73 |
400 |
9984.67 ± 2.52 |
0.03 |
|
3 |
600 |
874.33 ± 5.51 |
0.63 |
600 |
13789.33 ± 5.13 |
0.04 |
|
4 |
800 |
1045.33 ± 3.51 |
0.34 |
800 |
17058.67 ± 4.51 |
0.03 |
|
5 |
1000 |
1210.33 ± 5.51 |
0.46 |
1000 |
21154.67 ± 4.04 |
0.02 |
|
6 |
1200 |
1357.33 ± 3.51 |
0.26 |
1200 |
24556.67 ± 6.03 |
0.03 |
AUC = Area Under Curve, SD= Standard Deviation, RSD= Relative Standard Deviation
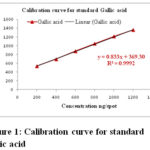 |
Figure 1: Calibration curve for standard gallic acid |
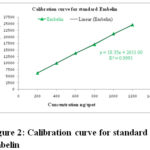 |
Figure 2: Calibration curve for standard embelin |
Percent relative standard deviation (%RSD) is a measure of precision of the method. The % RSD values for both intraday and interday precision were found to be < 2 in each ease. Method was found to be well precise as the result showed no significant variation in the intraday and interday precision study (Table 2).
Table 2: Intraday and Interday precision of Gallic acid & Embelin (mean ± SD, n=3)
|
Intraday precision |
Interday precision |
|||||
|
Conc. of gallic acid (ng/spot) |
Peak area |
%RSD
|
Conc. of gallic acid (ng/spot) |
Peak area |
%RSD
|
|
|
200 |
536.31 ± 3.43 |
0.64 |
200 |
534.69 ± 3.36 |
0.63 |
|
|
400 |
693.68 ± 2.10 |
0.30 |
400 |
695.23 ± 2.51 |
0.36 |
|
|
600 |
872.83 ± 4.94 |
0.57 |
600 |
873.18 ± 4.29 |
0.49 |
|
|
Conc. of embelin (ng/spot) |
|
Conc. of embelin (ng/spot) |
|
|||
|
200 |
6228.56 ± 13.47 |
0.22 |
200 |
6232.71 ± 17.99 |
0.29 |
|
|
400 |
9974.11 ± 25.02 |
0.25 |
400 |
9983.26 ± 15.03 |
0.15 |
|
|
600 |
13780.12 ± 18.92 |
0.14 |
600 |
13755.90 ± 32.64 |
0.24 |
|
Under the stated experimental condition, minimum amount of analyte that could be detected is known as LOD which was found to be 75.24 ng/spot for gallic acid and 81.60 ng/spot for embelin. Minimum amount of analyte that could be quantified is known as LOQ which was found to be 227.99 ng/spot for gallic acid and 247.28 ng/spot for embelin. Result shows that the developed method is quite sensitivity.
The study of percent recovery reflects the accuracy of the method. The percent recovery study was performs by addition of known added amount of standard solution in the sample. The known amount of mixture of gallic acid and embelin were added in triplicates of three concentration levels viz. 50%, 100% & 150%. The percentage recovery was found to be 100.71%, 101.06% and 99.59% for gallic acid and 99.29%, 98.96% and 98.58% for embelin (Table 3).
Table 3: Recovery studies of Gallic acid & Embelin
|
Formulation |
Standard |
Recovery level (%) |
Amount in sample (ng) |
Amount added (ng) |
Recovered amount (ng) |
% RSD |
% Recovery |
Average Recovery (%) |
|
MYPF |
Gallic Acid |
50 |
200 |
100 |
302.13 |
0.61 |
100.71 |
100.45 |
|
100 |
200 |
200 |
404.22 |
0.13 |
101.06 |
|||
|
150 |
200 |
300 |
497.93 |
0.42 |
99.59 |
|||
|
Embelin |
50 |
200 |
100 |
297.87 |
0.65 |
99.29 |
98.94 |
|
|
100 |
200 |
200 |
395.85 |
0.36 |
98.96 |
|||
|
150 |
200 |
300 |
492.89 |
0.71 |
98.58 |
The %RSD of the peak areas were calculated for intentionally variation in chamber saturation time, variation in detecting wavelength and variation in mobile phase composition for 400 ng/spot for both marker compounds. The values of % RSD were less than 2 which indicated that there is no significant change in any parameters. Variations in the experimental parameters do not affect developed HPTLC method which proved that the developed method is robust (Table 4).
Table 4: Robustness Study (mean ± SD, n=3)
|
Chamber saturation time |
Variation |
AUC ± SD |
%RSD of AUC |
Rf ± SD |
AUC ± SD |
%RSD of AUC |
Rf ± SD |
|
20 m |
–10 |
682.69 ± 5.33 |
0.78 |
0.30 ± 0.01 |
9844.88 ± 17.71 |
0.18 |
0.66 ± 0.01 |
|
30 m |
0 |
695.34 ± 8.74 |
1.26 |
0.33 ± 0.01 |
9984.95 ± 13.56 |
0.14 |
0.67 ± 0.01 |
|
40 m |
10 |
707.67 ± 4.87 |
0.69 |
0.33 ± 0.01 |
10210.95 ± 15.09 |
0.15 |
0.67 ± 0.01 |
|
Change in wavelength |
|||||||
|
244 nm |
–10 |
685.57 ± 4.44 |
0.65 |
0.29 ± 0.01 |
9924.67 ± 10.46 |
0.11 |
0.65 ± 0.01 |
|
254 nm |
0 |
695.34 ± 8.74 |
1.26 |
0.33 ± 0.01 |
9984.95 ± 13.56 |
0.14 |
0.67 ± 0.01 |
|
264 nm |
10 |
708.10 ± 6.50 |
0.92 |
0.33 ± 0.01 |
10099.38 ± 12.61 |
0.12 |
0.68 ± 0.01 |
|
Change in mobile phase |
|||||||
|
Toluene: Ethyl acetate: Methanol: Formic acid |
4: 5: 0.5: 0.5 |
651.85 ± 6.55 |
0.96 |
0.36 ± 0.02 |
9807.05 ± 17.25 |
0.18 |
0.70 ± 0.03 |
|
5: 4: 0.5: 0.5 |
695.34 ± 8.74 |
1.26 |
0.33 ± 0.01 |
9984.95 ± 13.56 |
0.14 |
0.67 ± 0.01 |
|
|
6: 3: 0.5: 0.5 |
708.56 ± 5.06 |
0.71 |
0.28 ± 0.01 |
10196.12 ± 16.43 |
0.16 |
0.65 ± 0.01 |
The HPTLC chromatogram shows that there is no interferencewith the peak of gallic acid and embelin. Therefore the method was specific. The presences of both marker compounds in sample track were confirmed by their Rf values with that of reference standard (Fig.3 and Fig. 4). The chromatogram of in-house formulated MYPF and its market formulations (MYPF-M1, MYPF-M2 and MYPF-M3) showing the presence of gallic acid and embelin The peaks of individual standard in sample track were analyzed by comparing spectra. (Fig. 5, 6, 7 and 8). The overlay spectrum of standard gallic acid and embelin spots and gallic acid and embelin spots present in the samples were found to be overlap (Fig. 7). The spectra shows good resolution between gallic acid and embelin in the presence of other phytoconstituents confirms the specificity of the method.
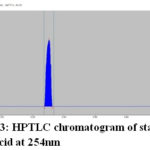 |
Figure 3: HPTLC chromatogram of standard gallic acid at 254nm |
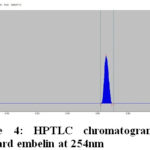 |
Figure 4: HPTLC chromatogram of standard embelin at 254nm |
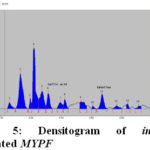 |
Figure 5: Densitogram of in-house formulated MYPF |
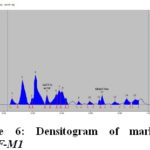 |
Figure 6: Densitogram of marketed MYPF-M1 |
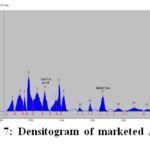 |
Figure 7: Densitogram of marketed MYPF-M2 |
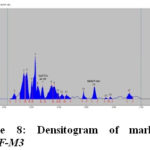 |
Figure 8: Densitogram of marketed MYPF-M3 |
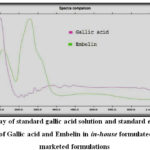 |
Figure 9: Overlay of standard gallic acid solution |
The amount of gallic acid and embelin in in-house formulated MYPF was found to be 46.57 ± 0.814 & 16.15 ± 0.180 mg/mg of MYPF with a %RSD of 1.75 and 1.11 respectively which showed highest among all tested marketed formulations (Table 5).
|
Formulation |
Standard |
Quantity (µg/mg of formulation) |
% RSD |
|
MYPF |
Gallic Acid |
46.57 ± 0.814 |
1.75 |
|
Embelin |
16.15 ± 0.180 |
1.11 |
|
|
MYPF-M1 |
Gallic Acid |
36.42 ± 0.551 |
1.51 |
|
Embelin |
10.59 ± 0.158 |
1.49 |
|
|
MYPF-M2 |
Gallic Acid |
26.14 ± 0.516 |
1.97 |
|
Embelin |
8.48 ± 0.150 |
1.77 |
|
|
MYPF-M3 |
Gallic Acid |
32.11 ± 0.426 |
1.33 |
|
Embelin |
9.40 ± 0.098 |
1.05 |
Conclusion
For biomarker (gallic acid and embelin) based characterization and standardization of MYPF, this invented HPTLC method was found to be most convenient, reliable and simple method 12-13. The developed HPTLC method is rapid, specific, accurate, precise and robust. This is proved, efficient and reproducible method according to the ICH guidelines for quantitative calculation of gallic acid and embelin in in-house formulated MYPF its market formulations (MYPF-M1, MYPF-M2 and MYPF-M3) 14-15. Reproducible, simple and efficient HPTLC method for quantitative determination of biomarkers present in MYPF has been developed. This method showed good peak shape of gallic acid and embelin. The present method of standardization can be implemented in ayurvedic pharmaceutical industries for regular quality control and quantitative determination of gallic acid and embelin in MYPF. This HPTLC provides a set quality standard for identification, characterization and quantitative estimation of biomarkers in MYPF.
Acknowledgement
The authors are Arbro Pharmaceutical Pvt. Ltd (Analytical Div.) for providing Laboratory facility for HPTLC analysis.
Financial Support and Sponsorship
None
Conflict of Interest
No conflicts of interest.
References
- Mukharjee, P.K and Wahile, A. J. Ethanopharmacol., 2006, 103(1), 25-35.
CrossRef - Rout, S.P.; Choudhary, K.A.; Kar, D.M.; Das, L.; Jain, A. Int. J. Pharm. Pharm. Sci., 2009, 1(1), 1-23.
- Govt. of India, The Ayurvedic Formulary of India, Ministry of Health and Family Planning, Dept. of Health, Delhi, 149, 1999.
- Jeganathan, N.S and Kannan, K. Res. J. Phytochem., 2008, 2(1), 1-9.
- Saraswathy, A.; Rukmani, S.; Ariyanathan, S. Ind. J. Trad. Know., 2009, 8(3), 319-325.
- Folashade, K.O.; Omoregie, E.H.; Ochogu, A.P. Int. J. Biodivers. Conserv., 2012, 4(3), 101-112.
- Arup, U.; Ekman, S.; Lindblom, L.; Mattsson, J.E.Lichenologist., 1993, 25, 61-71.
CrossRef - WHO, Quality control methods for medicinal plant materials, Geneva. 1-15 (1998a).
- Mukherjee, D., Kumar, N.S., Khatua, T., Mukherjee, P.K. Phytochem. Anal., 2010, 21, 556-560.
CrossRef - Validation of Analytical Procedures: Text and Methodology: ICH http://www.ich.org/products/guidelines/quality/quality-single/article/validation-of-analytical-procedures-text-and-methodology.html (accessed Aug 02, 2019).
- ICH guidelines. International Conference on Harmonisation Guidelines on Validation of Analytical Procedure: Text and Methodology Q2 (R1), Geneva, 2005, 1-8.
- Kumar, A.; Lakshman, K.; Jayaveera, K.; Mani. T. S.; Satish, K. Jordan J Pharm Sci., 2010, 3(1), 63-68.
- Slaveska-Raicki, R.; Rafajlovska, V.; Rizova, V.; Spirevska, I. J Planar Chromat., 2003, 16(5), 396-401.
CrossRef - Patel, D.K.; Patel, K.; Dhanabal, S.P. J Acute Dis., 2012, 1(1), 47-50.
CrossRef - Andola, H.; Rawal, R.; Rawat, M.; Bhatt, I.; Purohit, V.K. Asian J Biotechnol., 2010, 2(4), 239-245.
CrossRef
Accepted on: 04 Jan 2020


ISSN Online: 2231-5039

![]()


