Development of Microfluidic Technology for the Extraction of Ions from Some Dye Samples for Pretreatment Prior Analysis
Ahmed Mohamed Fallatah
Chemistry Department, Science Faculty, Taif University, 888-Alhawya, Taif City Kingdom of Saudi Arabia
Corresponding Author E-mail: a.fallatah.11@hotmail.com
DOI : http://dx.doi.org/10.13005/ojc/350515
Article Received on : 26-08-2019
Article Accepted on : 27-09-2019
Article Published : 12 Oct 2019
Two different dye samples Fast Green and Black T were subjected for extracting their ions using a novel methodology based on microfluidics using a membrane without Treatment and membrane coated with copper nanoparticles, which exploits the advantages of miniaturization for sample introduction and extraction of a range of ions through a membrane before and after treatment. The membrane coated with Cu nanoparticles increases the extracting efficiency to 96.3 and 91.62 for Fastgreen membrane and Black T membrane respectively. This due to the new and good physical properties of the membrane surface after coating with nanoparticles.
KEYWORDS:Black T; Cu Nanoparticles; Extracting Efficiency; Fastgreen; Membrane; Microfluidics; Preconcentration
Download this article as:| Copy the following to cite this article: Fallatah A. M. Development of Microfluidic Technology for The Extraction of Ions From Some Dye Samples For Pretreatment Prior Analysis. Orient J Chem 2019;35(5). |
| Copy the following to cite this URL: Fallatah A. M. Development of Microfluidic Technology for The Extraction of Ions From Some Dye Samples For Pretreatment Prior Analysis. Orient J Chem 2019;35(5). Available from: https://bit.ly/2otDd5X |
Introduction
The growing demand for water and the complication of water pollution are for both the quantity and quality of all type of water including surface water and groundwater. This is becoming a major concern worldwide, especially in terms of the presence of ions in different forms such as nutrients and heavy metals, which pose a genuine threat to human health1. The elementary step for the effective management of surface and groundwater is the continuous regular monitoring of the quality of water2.
Without doubt water is a very important natural resource upon which relies the sustainability of human existence. Unfortunately, it has been polluted due to human activities; pollutants such as nutrients, pesticides and heavy metals are carried from many different sources, through surface and groundwater pathways3. In addition, runoff from farms and cities is an essential source of ions specially nutrients such as phosphorus and nitrogen, which enter the surface waters such as lakes, rivers and coastal waters; industries and vehicle emissions are also a major source of pollution4.Moreover, with the high use of heavy metal salts, a serious danger increase has been occurring in the concentrations of these ions in the biosphere5. Furthermore, some pollutants do not degrade in the environment and they can persist for decades since they are only transformed from an oxidation state to another, or from an organic complex to another4. However, contamination sources cause damaging effects on plants and animals, and on human health eventually, directly or by the food chain6.Therefore, water pollution, poses a large potential hazard to both the environment and human health.
One of the most powerful analytical techniques for measuring the water quality is Capillary Eelectrophoresis CE7. Separation of ions using CE is fast, and it is relatively simple to find experimental conditions for an adequate separation of sample ions. However, the major disadvantage of CE for environmental analysis is its relatively low concentration sensitivity and poor reproducibility with stems from the limited sample volume (1–10 nl) that can be analysed without embrace separation efficiency8. Therefore, an enhancement step in combination with CE determination is required. A pretreatment procedures such as solid-phase extraction (SPE)9, could enhance the regular analysis of environmental sample and water monitoring . Modern microfluidic SPE, which has become the preferred technique for sample pre-concentration10.
In connection of microfluidics, capillary electrophoresis (CE) has been already performed in the capillary format with dimension of micrometres11, and microchip-based capillary electrophoresis (MCE) was one of the earliest original formats of microfluidics. This was introduced in 1992 by Harrison et al.12 and consisted of a sample injection system and a separation channel connected and integrated on a planar glass chip. MCE devices have advantages over classical CE systems, especially with regard to sample introduction, but because the channel dimension is comparable, the resolutions are also comparable. As device dimensions are minimised, system throughputs increase13. One of the challenges that faces the chemical analysts is the impurities in the samples during the analytical process specially the analysis of ions by CE14. This is due to the fact that, ions are very small and they normally found in mixture of analytical compounds, such as ions in natural waters. Therefore, developing a sample introduction technique to extract ions will enhance the selectivity and the sensitivity of the analysis by CE.
This work will focus on a new methodology based on microfluidics, which exploits the advantages of miniaturization for sample introduction and extraction of a range of ions through a membrane. The membrane is coated with Cu nanoparticles15, which has very good physical properties.
Materials and Methods
Fabrication of the Cu nanoparticles
The Cu nanoparticles were fabricated using the method described in our previous work.7 Briefly, 0.2 g of cupper acetate was mixed with 40 mL of distilled water under constant stirring (350 rpm). Then, add 1ml of (3-Aminopropyl) triethoxysilane into mixture. After that put the mixture into the autoclave. Put the autoclave in the oven at a temperature of 200 0C for 10 hours then the sample was washed with plenty of distilled water at 40°C for 24 hours.
Fabrication of the thin film membrane
About 1.0 g of CS was dissolved in an aqueous acetic acid solution (2%, v/v). The mixture was then stirred at 700 rpm at 30°C for 24 hours to obtain a homogeneous solution before being filtered through a nylon cloth to remove any undissolved material. Then, 0.065 g of Cu nanoparticles was added to 50 mL of the previous solution, which was then stirred at 700 rpm at 30°C for 24 hours. Finally, 10 mL of the formed solution was cast onto a Petri plate and dried at room temperature. Once completely dry, the membranes were ready to use.
Extraction dyes
Add 5ml of dyes into TFM and stirring 700 rpm at 10min. Then, remove the dyes and add 200µl of isopropanol. After that add 1ml of elution (contain 10 ml aqueous solution and 0.5 to 1g of resin. Solution were prepared in sterile deionized water with individual solute( isopropanol 675Mm) was stirred 700 rpm at 10min and measure sample in spectrophotometer. The concentration of CR and EBT was determined using a UV-Vis spectrophotometer in the range of between 350 and 800 nm. The extraction efficiency (%) was calculated using equation (1)

Where is C the initial concentration of the dye after extraction, C’ is the initial concentration of the dye before extraction and V the volume of the dye after extraction and V’ the volume of the dye before extraction, respectively.
Results and Discussions
Atomic Force Microscope (AFM)
The AFM has been applied as nanotechnology tool, and allows new users to acquire meaningful AFM images and Average of grain size, it is higher resolution compared to many other microscopes. Also, AFM is high-speed imaging of surface structures with outstanding resolution and stability. AFM scanning mode was performed for the tow studied membrane samples, Sample A before coating and sample B after coating and given in Table 1. It has been found that the thickness of the membrane has increased after the coating from 41-45 nm to 49.2-46.1 nm and the results shows how homogenous is the distribution of the particles using this methods.
Root mean square (RMS) roughness is a statistical measure used in different fields and measured by atomic force microscopy. RMS of roughness of a surface is a function that takes the square of the measures, it is similar to the roughness average, with the only difference being the mean squared absolute values of surface roughness profile. The Rq exhibits low value for the membrane after coating, it is more sensitive to peaks and valleys than the average roughness due to the squaring of the amplitude in its calculation.
Table 1: Average of grain size and Root mean square (RMS) of the membrane before coating Sample A and after coating Sample B.
|
Sample |
A | B |
| Coating | Before Coating |
After Coating |
|
Average of grain size |
41-45 nm | 49.2- 46.1 nm |
| RMS(Rq) | 71.1 |
52.1 |
Scanning Electron Microscope (SEM)
The scanning electron microscope uses a focused beam of high-energy electrons to generate a variety of signals at the surface of solid specimens. The signals that derive from electron-sample interactions reveal information about the sample including external morphology (texture), chemical composition, and crystalline structure and orientation of materials making up the sample.
The scanning electron microscope of the membrane after coating with the nano particles was given in Figure 1. The SEM image shows some small spots on the membrane surface, these small spots show the successful coating and the presence of the nano particles on the membrane.
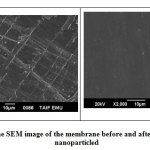 |
Figure 1: The SEM image of the membrane before and after coating with nanoparticled Click here to view figure |
Relation between Absorbance and concentration
We prepare several concentrations of the two studied dye samples, the absorbance of each dye was measured for different concentrations. The relation between absorbance and concentration for each dye sample was given at Figure 2. , Straight line was obtained passing through the origin (Beer law). The concentration of an unknown dye sample was determined using the relation of beers law.
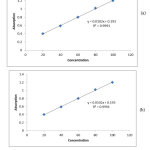 |
Figure 2: The relation between absorbance and concentration of (a) green dye and (b) black T dye. Click here to view figure |
Extraction of ions from fast green and black T dyes
Figure 3. Shows the absorbance of total ions in both fast green dye and Black T dye before treatment and the absorbance of total ions after microfluidic extraction with both membrane and membrane after coating with nanoparticles. It has been found that for the two studied dye samples, the absorbance of total ions using microfluidic extraction higher than the absorbance of total ions directly from each dye sample due to the role of microfluidic membrane. Also, the absorbance of total extracted ions using microfluidic membrane coated with nanoparticles higher than the absorbance of total extracted ions using microfluidic membrane before treatment.
In fast green dye, the absorbance of total ions was achieved at maximum wave length 625 nm but in Black T dye, the absorbance of total ions was achieved at maximum wave length 466 nm
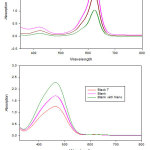 |
Figure 3: shows the wavelength against absorption of the extracted ions from fast green dye and black T dye using the blank membrane and the membrane coated with nanoparticles. Click here to view figure |
The efficiency of extraction
The concentrations of extracted ions from fastgreen and black T dyes and their extraction efficiency using microfluidic with membrane before and after coating with Cu nanoparticles were given at Table 2. It has been found that the microfluidic membrane has efficiencies 71.19 and 67.9 for fastgreen blank membrane and Black T blank membrane respectively. Coating the membrane with Cu nanoparticles increases the extracting efficiency to 96.3 and 91.62 for Fastgreen membrane and Black T membrane respectively. The membrane coated with Cu nanoparticle exhibits good physical properties which improve the extraction giving maximum percentage of total ion extraction from the studied dye sample.
Table 2: The concentration and efficiency of extracted ions using microfluidic with membrane before and after coating with Cu nanoparticles.
|
Membrane |
Concentration before extraction | Concentration after extraction | Extraction efficiency |
| Fastgreen blank membrane | 203.4 | 144.515 |
71.19 |
|
Fastgreen membrane with nano particles |
201.166 | 194.19 | 96.3 |
| Black T blank membrane | 99.09 | 67.288 |
67.9 |
|
Black T membrane with nano particles |
100.2 | 91.8 |
91.62 |
It is very important to Development high technology process for the extraction of ions for pretreatment prior analysis in order to obtain excellent data without any errors
Conclusion
Sample preparation and Sample preconcentration are an essential step before analysis, greatly influencing the reliability and accuracy of resulted time and cost of analysis. The methodology of microfluidics exploits the advantages of miniaturization for sample introduction and extraction of a range of ions through a membrane.
Atomic Force Microscope for the tow studied membrane samples before and after coating indicates that the thickness of the membrane has increased after the coating from 41-45 nm to 49.2-46.1 nm and the results reflect the homogenous of the distribution of the particles after coating with nanoparticles.
Using the two studied dye samples fastgreen and black T , the absorbance of total extracted ions using microfluidic membrane coated with nanoparticles exhibits higher value than that before treatment and the latter gives absorbance higher than the absorbance of ions directly measured from each dye sample.
Microfluidic membrane exhibits good physical properties when coated with Cu nanoparticles reflecting on the high extraction efficiency of 96.3 and 91.62 for Fastgreen membrane and Black T membrane respectively.
Acknowledgements
I would like express my deepest gratitude to Dr. Ashraf Yehia El-naggar for his supporting and reviewing my manuscript , also, thanks to the all my friend and my colleges in the analytical lab. In chemistry department, science faculty, taif university, KSA.
I would like express my deepest gratitude to Dr. Ashraf Yehia El-naggar for his supporting and reviewing my manuscript , also, thanks to the all my friend and my colleges in the analytical lab. In chemistry department, science faculty, taif university, KSA.
References
- Harrison, D. J., Manz, A., Fan, Z., Luedi, H., &Widmer, H. M. Capillary electrophoresis and sample injection systems integrated on a planar glass chip. Analytical chemistry, 1992, 64 (17), 1926-1932.
- Landers, J. P., Oda, R. P., Spelsberg, T. C., Nolan, J. A., & Ulfelder, K. J. Capillary electrophoresis: a powerful microanalytical technique for biologically active molecules. Biotechniques, 1993, 14(1), 98-111.
- Tomlinson, A. J., Benson, L. M., Jameson, S., Johnson, D. H., & Naylor, S. Utility of membrane preconcentration-capillary electrophoresis-mass spectrometry in overcoming limited sample loading for analysis of biologically derived drug metabolites, peptides, and proteins. Journal of the American Society for Mass Spectrometry, 1997, 8 (1), 15-24.
- Loos, R., & Niessner, R. Analysis of aromatic sulfonates in water by solid-phase extraction and capillary electrophoresis. Journal of Chromatography A, 1998, 822(2), 291-303.
- Brown, G. E., Foster, A. L., & Ostergren, J. D. Mineral surfaces and bioavailability of heavy metals: a molecular-scale perspective. Proceedings of the National Academy of Sciences, 1999, 96 (7), 3388-3395.
- Chapman, D. V. Water quality assessments: a guide to the use of biota, sediments and water in environmental monitoring: CRC Press, 2002.
- Bharadwaj, R., Santiago, J. G., & Mohammadi, B. Design and optimization of on‐chip capillary electrophoresis. Electrophoresis, 2002, 23 (16), 2729-2744.
- H., & Chen, D. H. Synthesis of high-concentration Cu nanoparticles in aqueous CTAB solutions. Journal of colloid and interface science, 2004, 273(1), 165-169
- Whitesides, G. M. The origins and the future of microfluidics. Nature, 2006, 442 (7101), 368.
- Ye, C., Li, S., Zhang, Y., & Zhang, Q.. Assessing soil heavy metal pollution in the water-level-fluctuation zone of the Three Gorges Reservoir, China. Journal of hazardous materials, 2011, 191(1-3), 366-372.
- Hendryx, M., Conley, J., Fedorko, E., Luo, J., & Armistead, M. Permitted water pollution discharges and population cancer and non-cancer mortality: toxicity weights and upstream discharge effects in US rural-urban areas. International journal of health geographics, 2012, 11(1), 9-24.
- Ding, X., Liow, C. H., Zhang, M., Huang, R., Li, C., Shen, H., Liu, M., Zou, Y., Gao, N., & Zhang, Z. Surface plasmon resonance enhanced light absorption and photothermal therapy in the second near-infrared window. Journal of the American Chemical Society, 2014, 136(44), 15684-15693.
- Flores, B., Ren, J., Krishnamurthy, S., & Belzer, W.. Assessment of Nutrient and Heavy Metal Levels in Manadas Creek, an Urban Tributary of the Rio Grande in Laredo, Texas. In Environmental Sustainability Issues in the South Texas–Mexico Border Region, Springer, 2014, 97-115.
- Park, M., & Seo, T. S. An integrated microfluidic device with solid-phase extraction and graphene oxide quantum dot array for highly sensitive and multiplex detection of trace metal ions. Biosensors and Bioelectronics, 2019, 126, 405-411.
- Mellors, J. S., Black, W. A., & Ramsey, J. M. U.S. Patent Application No. 10/181,396, 2019.

This work is licensed under a Creative Commons Attribution 4.0 International License.
![]()
A New Edition of Web of Science
Journal Impact Factor
2022: 0.5
Five Year: 0.8
Journal is Indexed in

Cabells Whitelist
![]()


