Microwave Assisted Synthesis, Structural Characterization, Thermal Analysis and Antibacterial Studies of Fe(III), Ni(II) and Cu(II) Complexes of Sulfanilamide
1Department of Chemistry, Government, Engineering College Bikaner, Bikaner-334001, Rajasthan, India.
1Department of Chemistry, Government, Dungar College, Bikaner-334001, Rajasthan, India.
Corresponding Author E-mail: garimagoel4@gmail.com
DOI : http://dx.doi.org/10.13005/ojc/350137
Download this article as:
![]()
Mode of coordination of the drug Sulfanilamide has been meticulously studied in its transition metal complexes with Fe(III), Ni(II) and Cu(II). The present study deals with green synthesis of these metallodrug compounds by microwave irradiation. Elemental, spectral and thermal analysis methods have been carried out for the elucidation of structure of complexes and the coordination behaviour of ligating drug with the metal ions. Sulfanilamide is found to exhibit a bidentate behaviour in Fe(III) and Cu(II) complexes, whereas it shows monodentate coordination with Ni(II). Thermogravimetric data (TGA and DTA) have been utilised to evaluate the kinetic and thermodynamic parameters using Coats and Redfern integral equations. Investigation of antibacterial properties of the complexes has been done against E. coli, S. aureus and B. subtilis.
KEYWORDS:Differential Thermogravimetric Analysis (DTA) and Coats and Redfern Equations; Metallodrugs; Microwave Irradiation; Sulfanilamide; Thermogravimetric Analysis (TGA)
Introduction
Sulfanilamide and its derivatives, comprise a group of molecules, known as Sulfonamides ever since the discovery of sulfanilamide in 1939, these molecules are widely used as chemotherapeutic agents known as Sulfa drugs.1 In past few decades, transition metal complexes of these drugs have gained much attention as important diagnostic and therapeutic agents. Medicinal inorganic chemistry effectively exploits the coordination properties of the metal ions as well as the donor behaviour of these drug molecules in designing of advanced metal based therapeutic agents, known as metallodrugs, which possess enhanced pharmacological properties, such as increased antibacterial potency, diminished toxicity, optimum solubility in biological fluids and minimal side effects.2-3 Metallosulfa drugs find important use in pharmaceutical industries as anticancer and radio sensitizing agents, antibiotics, antibacterials, antivirals, antiparasites and antidiabetics.4 Appreciable amount of work has been reported on the synthesis and biological studies of these metal-based sulfa drugs in the past.5-10 But research articles on thermal studies of these complexes are still very scarce. Also the literature survey reveals that microwave assisted organic synthesis (MAOS) of transition metal complexes of sulfonamides has been rarely reported
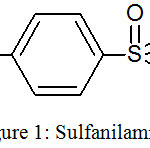 |
Figure 1: Sulfanilamide.
|
The present study deals with microwave irradiation method for the green synthesis of metal complexes of sulfanilamide with Fe(III), Ni(II) and Cu(II) ions. Microwave assisted synthesis involves microwave dielectric heating, and hence has a number of advantages associated with it. As it generates rapid heating of the reactants, the reaction time period as well as the side reactions are greatly reduced, thereby increasing the yield and improving the reproducibility of the reaction.11 Sulfanilamide molecule contains three potential donors sites i.e. N atom of aromatic amino group, N atom of sulfonamide group and O atom of sulfonyl group.12 Hence, our present work aims to discover elaborately the coordination behaviour of sulfanilamide drug with a few transition metal ions in direction of developing the pharmacodynamics of the drug. Thermal studies of the complexes provide evidential backbone to the spectral findings and also reveals the thermal decomposition behaviour of the complexes within a viable temperature range of 30-900°C. Effect of metallation on the efficacy of sulfanilamide drug as compared to the parent drug molecule has been studied by antibacterial investigations.
The present study deals with microwave irradiation method for the green synthesis of metal complexes of sulfanilamide with Fe(III), Ni(II) and Cu(II) ions. Microwave assisted synthesis involves microwave dielectric heating, and hence has a number of advantages associated with it. As it generates rapid heating of the reactants, the reaction time period as well as the side reactions are greatly reduced, thereby increasing the yield and improving the reproducibility of the reaction.11 Sulfanilamide molecule contains three potential donors sites i.e. N atom of aromatic amino group, N atom of sulfonamide group and O atom of sulfonyl group.12 Hence, our present work aims to discover elaborately the coordination behaviour of sulfanilamide drug with a few transition metal ions in direction of developing the pharmacodynamics of the drug. Thermal studies of the complexes provide evidential backbone to the spectral findings and also reveals the thermal decomposition behaviour of the complexes within a viable temperature range of 30-900°C. Effect of metallation on the efficacy of sulfanilamide drug as compared to the parent drug molecule has been studied by antibacterial investigations.
Materials and Methods
Metal halides, FeCl3.6H2O, Ni(NO3)2.6H2O and CuCl2.2H2O (Himedia), were used and their solutions(1 mmol) were prepared separately in acetone each. The ligand sulfanilamide (Himedia) was separately dissolved in acetone to obtain its solution (3 mmol). The solutions of each metal halide was then separately mixed together with the drug solution and the resultant reaction mixtures were then subjected to microwave irradiation in a domestic microwave oven reactor model KENSTAR – OM20ACF, 2450MHz, at a medium power level of 600 W for about 4 to 5 minutes. The reaction products were monitored by thin layer chromatography (TLC) using silica gel. The complexes finally precipitated down as amorphous solids and were filtered off, washed with distilled water and ethanol and were then dried in desiccators. UV-Vis spectra of sulfanilamide and its complexes were determined using a double beam spectrophotometer of Royal model with quartz cell of 10mm light path and a range of 200-1100 nm, in DMSO solvent, owing to the restricted solubility of the complexes. FT-IR spectra for all the complexes were recorded on Bruker Optic Model Alpha (FT-IR) (Zn-Se Optics, ATR) (4000-400 cm-1) using KBr disc. Thermogravimetric Analysis (TGA), Derivative Thermogravimetric Analysis (DTG) and Differential Thermal Analysis (DTA) of all the complexes was conducted at a constant heating rate of 10°C/min, using Mettler Toledo (TGA/ DSC/ IHT/ 546) STARe system, within a temperature range of 30-900°C using alumina crucible. The magnetic studies of the complexes have been carried out at room temperature. The antimicrobial investigations of metal drug complexes and their parent drug were conducted against three bacterial strains i.e. Escherichia coli, Staphylococcus aureus and Bacillus subtilis, by disc diffusion- zone inhibition method, using nutrient Muller Hinton Agar medium (Himedia).13 The inoculated plates were incubated at 37°C and observed at an interval of 24 hours with DMSO as solvent. The results obtained in the form of inhibition zones were measured with an accuracy of 0.5mm.
![Scheme 1: Schematic representation of Fe(III) complex of Sulfanilamide.[Fe(SA)Cl2].H2O.](https://www.orientjchem.org/wp-content/uploads/2019/02/Vol35No1_Mic_Gar_sch1-150x150.jpg) |
Scheme 1: Schematic representation of Fe(III) complex of Sulfanilamide.[Fe(SA)Cl2].H2O. |
![Scheme 2: Schematic representation of Ni(II) complex of Sulfanilamide. [Ni(SA)2(NO3)2].](https://www.orientjchem.org/wp-content/uploads/2019/02/Vol35No1_Mic_Gar_sch2-150x150.jpg) |
Scheme 2: Schematic representation of Ni(II) complex of Sulfanilamide. [Ni(SA)2(NO3)2]. |
![Scheme 3: Schematic representation of Cu(II) complex of Sulfanilamide. [Cu(SA)2(H2O)2]](https://www.orientjchem.org/wp-content/uploads/2019/02/Vol35No1_Mic_Gar_sch3-150x150.jpg) |
Scheme 3: Schematic representation of Cu(II) complex of Sulfanilamide. [Cu(SA)2(H2O)2]. |
Results and Discussion
Synthesis of complexes by the green method of microwave irradiation was found to be very effective. The yields of the complexes prepared were appreciable and better than those prepared by conventional thermal methods.14-17 Also the overall reaction time period consumed in thermal method has was reduced from several hours to few minutes in case of microwave synthesis. The findings are assimilated in Table 1.
Table 1: Physico Chemical Properties Of Sulfanilamide and its metal complexes.
|
Complexes |
Colour and State |
Melting point (°C) |
Reaction Period |
Yield% |
Elemental Analysis Calcd. (Found)% |
||||
|
C.M. (Hrs.) |
M.M. (Min.) |
C.M. |
M.M. |
C |
H |
N |
|||
|
Sulfanilamide |
Crystalline White |
162 |
– |
– |
– |
– |
41.81 (40.98) |
4.65 (4.56) |
16.26 (16.30) |
|
[Fe(SA)Cl2].H2O |
Brown Solid |
158 |
3 |
4 |
63 |
78 |
22.78 (22.58) |
2.85 (2.55) |
8.86 (8.80) |
|
[Ni(SA)2(NO3)2] |
Light Green Solid |
175 |
3 |
4 |
62 |
72 |
27.32 (27.26) |
3.04 (3.09) |
15.94 (15.62) |
|
[Cu(SA)2(H2O)2] |
Dark Brown Solid |
198 |
3 |
4 |
64 |
76 |
32.58 (32.38) |
4.07 (4.50) |
12.67 (12.36) |
C.M. = Conventional heating method. M.M. = Microwave Irradiation method.
Electronic Spectra
The recorded UV-Vis spectra of pure drug Sulfanilamide and its Fe(III), Ni(II) and Cu(II) complexes are presented in Fig. 2 and Table 2.
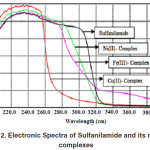 |
Figure 2: Electronic Spectra of Sulfanilamide and its metal complexes. |
The d-d transition bands observed for all the three complexes were very weak and less defined as compared to the strong inter-ligand transitions and the L → M charge transfer bands. In aqueous solution, phenyl and SO2 groups of sulfanilamide molecule exhibit resonance and merge together to display a single strong absorption band at 265 nm due to π → π* and n → π* transitions. When recorded in DMSO, this characteristic band of sulfanilamide molecule is appears at 300 nm.18 Upon complexation this characteristic band shifted, appreciably, towards lower wave lengths and appeared at 270, 282 and 255 nm in Fe(III), Ni(II) and Cu(II) complexes respectively. The decrease in λmax ensures the coordination of drug molecules with the metal ions and also signifies the decrease of electron delocalization in the sulfanilamide molecule upon complexation to the metal ions. In Fe(III)-Sulfanilamide complex absorption bands at 347 and 500 nm are assignable to L→MCT and 6A1 → 4T2 d-d transitions respectively, confirming a tetrahedral environment around iron ion. Ni(II) complex exhibited absorption bands at 344, 420, 490 and 535nm that may be attributed to L→M charge transfer and d-d transitions, i.e. 3A2g → 3T1g(P), 3A2g → 3T1g(F) and 3A2g → 3T2g(P) respectively, supporting an octahedral geometry of its complex. Absorption bands that appeared at 348 and 570nm in Cu(II) complex correspond to L→M charge transfer and 2Eg → 2T2g transitions respectively, hence suggesting an octahedral geometry around Cu(II). These findings are supported by the magnetic susceptibility data,19 given in Table 2.
Table 2: Electronic Spectral And Magnetic Moment data of Sulfanilamide and its metal complexes.
|
Complexes |
Formula Mass |
µeff (B.M.) |
Electronic Spectral Bands (nm) |
Tentative |
Expected |
|
Sulfanilamide |
172.21 |
– |
300 |
π → π*, n→π* |
– |
|
[Fe(SA)Cl2].H2O |
316.06 |
5.89 |
270, 347, 500 |
π→π*, n→π* L→ MCT 6A1→4T2 |
Tetrahedral |
|
[Ni(SA)2(NO3)2] |
527.11 |
3.2 |
282, 340, 420, 490, 535 |
π→π*, n→π* L→MCT, 3A2g→3T1g(P) 3A2g→3T1g(F),3A2g→3T2g(F) |
Octahedral |
|
[Cu(SA)2(H2O)2] |
441.97 |
1.92 |
255, 348, 570 |
π→π*, n→π* L→ MCT 2Eg→2T2g |
Distorted |
FT IR Spectra
Vibrational frequencies of sulfanilamide drug and all its three complexes have been recorded between 4000 to 400cm-1 and are given in Fig. 3 and Table 3. Important frequencies have been assigned by comparing the IR spectra of complexes with those of pure sulfanilamide and the data provided in the literature.20-21 Sulfanilamide is an effective chelating ligand and can behave as monodentate or bidentate through its potential donors sites i.e. primary aromatic amino N atom, sulfonamidic N atom and sulphonyl O atom . The IR spectra of pure sulfanilamide showed two strong bands at 3478 and 3375 cm-1, due to asymmetric and symmetric stretching vibrations of aromatic amino group (Ar-NH2). A weak band at 3338 cm-1 and an intensely sharp band at 3267 cm-1 are observed due to asymmetric and symmetric stretching vibrations of sulfonamidic amino group (-SO2-NH2) respectively. Sulfonyl moiety (-SO2-) absorbs mainly at 1314, 1147 and 563 cm-1. Primary amino bands for all the three metal complexes have been found to be either unaffected (as in case of Ni(II) -Sulfanilamide complex) or shifted towards higher wave numbers (as in case of Fe(III) and Cu(II) -Sulfanilamide complexes) mainly due to hydrogen bonding with coordinated water or water of crystallization. Broadening of aromatic amino bands above 3500 cm-1 in case of Fe(III) and Cu(II) complexes clearly indicates the presence of water molecules in the complexes.22 However, the presence of lattice water or coordinated water was confirmed by the TGA studies of the complexes, mentioned in the thermal analysis section. No such feature was shown in the FT-IR spectrum of Ni(II) complex and hence it may be concluded that it does not contain any form of water in it. Any interaction of metal ions with the aromatic amino group (-NH2) is hence overruled in all the three metal complexes of sulfanilamide. In case of Fe(III) and Cu(II) complexes of sulfanilamide, the asymmetric stretching band of sulfonamidic (-NH2) group is missing while the other bands corresponding to this group are substantially weekend and shifted towards lower wave numbers. This clearly signifies the chelation of the drug molecule to the Fe(III) and Cu(II) ion is through deprotonated sulfonamidic N atom. The vibrational bands due to the Sulfonyl moiety in these two complexes are also markedly shifted either to lower or higher wave numbers, confirming its coordination to the metal ions. Hence it can be finally concluded that sulfanilamide molecule is coordinated to Fe(III) and Cu(II) ions via deprotonated sulfonamide N atom and sulfonyl O atom. Also the ν(S-N) bands in both the complexes are shifted substantially to the lower frequencies supporting the above findings.
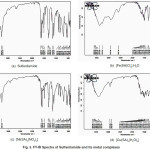 |
Figure 3: FT-IR Spectra of Sulfanilamide and its metal complexes. |
Iron-chlorine band i.e. ν(Fe-Cl) could not be recorded within the experimental range of IR recorded for Fe(III) complex of sulfanilamide. FTIR spectrum of Ni(II) complex of sulfanilamide shows the presence of both the sulfonamidic amino bands but they are substantially shifted towards lower wave numbers. This indicates that the drug molecule is coordinated to Ni(II) ion via sulfonamidic N atom without undergoing deprotonation. The IR frequencies of sulfonyl group and the ν(S-N) band are completely unaffected and appeared exactly at the same position as that of free sulfanilamide, hence indicating non coordination of these groups of ligand with Ni(II) ion. This complex also exhibits two new bands around 1750 and 1780 cm-1 that are attributed to the presence of bidentate nitrate group.23 The characteristic metal-O and the metal-N vibrational frequencies, i.e. ν(M-O) and ν(M-N) have been recorded for all the three complexes and are given in Table 3.
Table 3: IR Spectral Data of Sulfanilamide and its Complexes.
|
Imp. IR Spectral Data ν(cm-1) |
Sulfanilamide |
[Fe(SA)Cl2].H2O |
[Ni(SA)2(NO3)2] |
[Cu(SA)2(H2O)2] |
|
| Aromatic amino group (Ar-NH2) |
νasym(NH2) |
3478 |
3546 |
3478 |
3522 |
| νsym(NH2) |
3375 |
3378 |
3375 |
3391 |
|
| δ(NH2) |
1628 |
1636 |
1628 |
1634 |
|
| Sulfonamidic amino group (-SO2-NH2) |
νasym(NH) |
3338 |
– |
3328 |
– |
| νsym(NH) |
3267 |
3266 |
3267 |
3285 |
|
| δ(NH) |
1572 |
1558 |
1564 |
1562 |
|
| ω(NH) |
694 |
634 |
– |
613 |
|
|
Sulfonyl |
νasym(SO2) |
1314 |
1313 |
1313 |
1318 |
| νsym(SO2) |
1147 |
1155 |
1148 |
1156 |
|
| δ(SO2) |
563 |
559 |
563 |
546 |
|
| S-N Bond | ν(S-N) |
900 |
928 |
900 |
875 |
| Metal-O | ν(M-O) |
– |
514 |
470 |
487 |
| Metal-N | ν(M-N) |
– |
484 |
429 |
408 |
| Nitrate | ν(NO3) |
– |
– |
1750, 1780 |
– |
Thermal Analysis
The TGA, DTG and DTA thermograms for sulfanilamide and its Fe(III), Ni(II) and Cu(II) complexes are presented in Fig. 4, 5 and 6.
Thermal Decomposition of [Fe(SA)Cl2].H2O
The thermal decomposition data of Fe(III) -Sulfanilamide complex supports a three stage decomposition. The first stage of decomposition is attributed to the loss of one molecule of water of hydration with an estimated mass loss of 5.68% (obsd. 7.67%). The DTA curve exhibits a broad endothermic peak for the same. This water molecule is lost very early, within the temperature range 30-120°C, and hence signifies that its association with the complex is not as coordinated form but it constitutes water of crystallisation.24 Presence of water of hydration in the Fe(III) complex has been confirmed by IR data. Temperature range of 120-430°C displayed the second stage of steady decomposition that started immediately after the process of melting. Melting point of the complex is observed by DTG peak at 147°C (Expt. m.pt. 158°C) and a sharp endothermic peak in the DTA curve. The second decomposition stage underwent an estimated mass loss of 28.07% (obsd. 31.08%) which corresponds to the removal of chlorine molecule. The last degradation step occurred within 430-600°C and is accompanied by a calculated mass loss of 74.81 % (obsd. 72.69%), and a sharp exothermic DTA peak, yielding a black residue of Fe2O3. The mass remained constant thereafter and showed no change till 900°C.
![Figure 4: Thermogravimetric analysis (TGA), Differential thermal analysis (DTA) and Derivative thermogravimetric (DTG) curves of [Fe(SA)Cl2].H2O.](https://www.orientjchem.org/wp-content/uploads/2019/02/Vol35No1_Mic_Gar_fig4-150x150.jpg) |
Figure 4: Thermogravimetric analysis (TGA), Differential thermal analysis (DTA) and Derivative thermogravimetric (DTG) curves of [Fe(SA)Cl2].H2O. |
Thermal decomposition of [Ni(SA)2(NO3)2]
The Ni(II)- Sulfanilamide complex showed a three stage decomposition process with practically no change in mass till 170°C.
![Figure 5: Thermogravimetric analysis (TGA), Differential thermal analysis (DTA) and Derivative thermogravimetric (DTG) curves of [Ni(SA)2(NO3)2].](https://www.orientjchem.org/wp-content/uploads/2019/02/Vol35No1_Mic_Gar_fig5-150x150.jpg) |
Figure 5: Thermogravimetric analysis (TGA), Differential thermal analysis (DTA) and Derivative thermogravimetric (DTG) curves of [Ni(SA)2(NO3)2]. |
The complex finally started melting near 180°C, which corresponds to its experimental melting point at 175°C. The melting process is shown by a sharp endothermic peak observed in the DTA curve. Thereafter the complex slowly underwent first stage of decomposition after 270°C with a net mass loss of 17.46% (Calcd. 16.67%), due to the loss of amino phenyl moiety from the ligand. The fragmented metal drug complex then decomposed within a range of 320-380°C with an estimated mass loss of 28.51% (Calcd. 28.57%). This endothermic decomposition step may be attributed to the removal of two nitrate groups. The last step of decomposition (390-600°C), observed a mass loss of 76.01% (calcd. 76.80%) and showed a broad exothermic peak and final breakdown of the complex to yield a stable dark black residue of NiO.
Thermal Decomposition of [Cu(SA)2(H2O)2]
Thermogram of Cu(II)- Sulfanilamide complex remained practically stable till 180°C. Thereafter the complex showed a sharp endothermic peak followed by a broad exothermic peak in DTA plot, depictive of the process of melting of the complex along with its decomposition. The melting point of complex is shown at 208°C in the DTA plot, which closely corresponds to experimental melting point of complex at 198°C. The very first step of degradation (180-280°C) was observed with an estimated loss of 8.45% (calcd. 8.28%) and a short endothermic peak which can be attributed to the loss of two molecules of coordinated water. The findings are consistent with those of IR spectrum of the complex. Second and third steps of decomposition were observed within temperature range of 280-310°C and 310-350°C respectively, as their endothermic and exothermic peaks overlapped and occurred back to back. The estimated mass loss in the above two steps are 15.8% (calcd. 15.96%) and 34.17% (calcd. 33.70%) respectively, possibly due to the loss of ammonia molecule in the second and amino phenyl moiety in the third step respectively. The fourth step of degradation occurred within 350-440°C and corresponds to the loss of a SO2 molecule with an estimated loss of 48.65% (calcd. 44.26%). Lastly a broad exothermic peak (450-600°C) with the mass loss 82.00% (calcd. 82.01%) displayed the final decomposition of the fragmented complex, to yield a black residue of CuO which remained stable after 600°C.
![Figure 6: Thermoravimetric analysis (TGA), Differential thermal analysis (DTA) and Derivative thermogravimetric (DTG) curves of [Cu(SA)2(H2O)2].](https://www.orientjchem.org/wp-content/uploads/2019/02/Vol35No1_Mic_Gar_fig6-150x150.jpg) |
Figure 6: Thermoravimetric analysis (TGA), Differential thermal analysis (DTA) and Derivative thermogravimetric (DTG) curves of [Cu(SA)2(H2O)2]. |
Evaluation of Kinetic and Thermodynamic Parameters
Non-isothermal rate laws can be used for the evaluation of kinetic parameters, such as order
of reaction (n), activation energy (E) and frequency factor (A), from the thermoanalytical data. The present study involves utilization of thermogravimetric data (TGA, DTA and DTG curves) to evaluate various kinetic and thermodynamic parameters of metal complexes of Sulfanilamide, for all the stages of decomposition, using graphical method of Coats and Redfern.25-26
Table 4: Thermoanalytic Data and Kinetic Parameters of Sulfanilamide and its metal complexes.
| Complex | Decomp. Steps |
Temp. Range (°C) |
Weight loss per step (%) calcd (obsd) |
DTGmax (0C) | Order of Reaction (n) |
Activation Energy (kJ/mol)E |
Frequency Factor (sec-1) A |
Correlation Coefficient R2 |
| Decomp. | 30-110 | 5.68 | 55 | 2 | 156.22 | 2.43 x 10²³ | 0.995 | |
| Stage 1 | -7.67 | |||||||
| [Fe(SA)Cl2].H2O | Decomp. | 120-430 | 28.07 (31.08) | 405 | 0.2 | 12.41 | 4.71 x 10⁻² | 0.988 |
| Stage 2 | 74.81 (72.69) | |||||||
| Decomp. | 460-600 | 485 | 2 | 273.56 | 5.39 x 10¹⁶ | 0.949 | ||
| Stage 3 | ||||||||
| Decomp. | 240-310 | 17.46 | 290 | 1 | 201.95 | 4.58 x 10¹⁶ | 0.988 | |
| Stage 1 | -16.67 | |||||||
| [Ni(SA)2(NO3)2] | Decomp. | 320-380 | 40.99 (40.48) | 343 | 1.5 | 321.69 | 2.48 x 10²⁰ | 0.989 |
| Stage 2 Decomp. | 85.85 (86.19) | |||||||
| Stage 3 | 390-610 | 540 | 1 | 85.43 | 1.13 x 10³ | 0.993 | ||
| Decomp. | 180-280 | 8.15 | 205 | 1 | 41.34 | 3.63 x 101 | 0.98 | |
| Stage 1 | -8.28 | |||||||
| Decomp. | 280-310 | 15.84 (15.96) | 295 | 1 | 395.41 | 2.11 x 1034 | 0.999 | |
| Stage 2 Decomp. | 34.17 (33.70) | |||||||
| [Cu(SA)2(H2O)2] | Stage 3 | 310-350 | 48.65 | 320 | 1 | 179.87 | 4.60 x 10¹⁰ | 0.997 |
| Decomp. | -44.26 | |||||||
| Stage 4 | 350-440 | 82 | 430 | 1 | 104.26 | 6.27 x 10⁵ | 0.994 | |
| Decomp. | -82.01 | |||||||
| Stage 5 | 450-600 | 515 | 1 | 152.3 | 2.11 x 10⁷ | 0.989 |
Calculation of thermodynamic parameters from the thermal data has been achieved using standard thermodynamic relations given as:
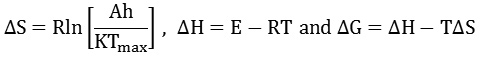
where ∆S is the entropy of activation, h is Planck’s constant, K is Boltzmann constant, Tmax is DTG peak temperature that is obtained from DTG plot, ∆H is the Enthalpy of activation and ∆G is Gibbs free energy. The kinetic and thermodynamic parameters hence derived are presented in and Table 4 and Table 5, respectively. A higher value of activation energy (E) for a particular stage of decomposition signifies the presence of much stable and stronger bonding interaction involved in the decomposing molecule. It may be generalized that the highest activation energies (E) for all the three complexes are mainly observed during the fragmentation of ligand group. A similar order was observed for the values of frequency factor (A) and enthalpy of activation (ΔH) in all the steps of thermal degradation. The negative values of entropy of activation (∆S) suggest that the activated complex has a more ordered structure than the reactants. The positive values of gibbs free energy (∆G), confirms the stability of the complexes at room temperature and also that the process of dehydration and thermal decomposition are slower than normal.
Table 5: Thermoanalytic Data and Thermodyanamic Parameters of Sulfanilamide and its metal complexes.
| Complex | Decomp. Steps | Temp. Range (°C) |
Entropy of Activation (J/Kmol) (J/Kmol) ∆S | Enthalpy of Activation (kJ/mol) ∆H | Gibb’s Free Energy (kJ/mol) ∆G |
| Decomp. Stage 1 | 30-110 | 202.01 | 153.49 | 87.23 | |
| [Fe(SA)Cl2].H2O | Decomp. Stage 2 | 120-430 | -162.32 | 6.77 | 116.83 |
| Decomp. Stage 3 | 460-600 | 73.01 | 267.26 | 211.92 | |
| Decomp. Stage 1 | 240-310 | 68.75 | 197.26 | 158.55 | |
| [Ni(SA)2(NO3)2] | Decomp. Stage 2 | 320-380 | 139.58 | 316.57 | 230.59 |
| Decomp. Stage 3 | 390-610 | -194.8 | 78.67 | 237.04 | |
| Decomp. Stage 1 | 180-280 | -219.01 | 37.86 | 142.55 | |
| Decomp. Stage 2 | 280-310 | 406.9 | 394.1 | 162.98 | |
| [Cu(SA)2(H2O)2] | Decomp. Stage 3 | 310-350 | -46.53 | 174.94 | 202.53 |
| Decomp. Stage 4 | 350-440 | -141.09 | 98.42 | 197.61 | |
| Decomp. Stage 5 | 450-600 | -112.8 | 145.75 | 234.64 |
Antibacterial Investigations
All the three complexes along with their parent drug were tested for antibacterial activities against the bacterial cultures of E.coli, S.aureus and B.subtilis. The experimental results and data are given in Fig. 9 and in Table 5. In the present study it was found that, whereas Cu(II)-Sulfanilamide complex showed no significant antibacterial activity, the Ni(II)-Sulfanilamide complex proved to be promisingly effective against all the three strains. Fe(III)-Sulfanilamide complex showed prominently enhanced antibacterial activity only against S. aureus bacteria. It has been known that the free aromatic amino group present in the sulfa drugs is the potential site that is mainly responsible for their antimicrobial properties.27-28 These results, hence, may be attributed to the presence or absence of any form of water molecules in the complexes, which may or may not show any secondary interaction with free primary amino group present in ligand group. Since Cu(II) complex is found to contain coordinated water molecules which interact with free amino group of sulfanilamide to reduce its free availability. Hence it shows diminished or least antimicrobial activity against these bacteria, as compared to the other two metal complexes. Unlike Cu(II) complex, the absence of any form of water molecules in Ni(II) complex renders the aromatic amino group free for effective antimicrobial activity. While Fe(III) complex shows only a moderate effect.
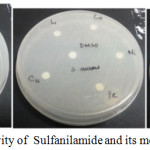 |
Figure 7: Biological activity of Sulfanilamide and its metal complexes. |
Table 6: Antibacterial activity of sulfanilamide and synthesized compounds.
|
Complexes (100 ppm) |
Zone of inhibition (in mm) |
||
|
E. coli |
S. aureus |
B. subtilis |
|
|
Sulfanilamide (SA) |
6 |
0 |
6 |
|
[Fe(SA)Cl2].H2O |
0 |
6 |
6 |
|
[Ni(SA)2(NO3)2] |
8 |
6 |
7 |
|
[Cu(SA)2(H2O)2] |
0 |
0 |
6 |
Conclusion
The present study, discusses the microwave organic synthesis, spectral and magnetic characterization, thermal decomposition studies and antimicrobial studies for Fe(III), Ni(II) and Cu(II) complexes of Sulfanilamide. UV/Vis spectral analyses confirmed the of co-ordination of drug molecules with the metal ions, which was supported by the FTIR spectral data and the magnetic data. On the basis of FTIR and thermal decomposition data, Sulfanilamide drug was found to behave as monodentate as well as bidentate ligand, facilitating six coordinate octahedral geometry around Ni(II) and Cu(II) ions and a four co-ordinate tetrahedral geometry around Fe(III) ion in their sulfanilamide complexes. The thermoanalytical data and Coats and Redfern graphical method has been utilized for the calculation of kinetic and thermodynamic parameters. The Fe(III), Ni(II) and Cu(II) complexes of sulfanilamide were found to have good stability at lower temperatures and their decomposition started only after their melting. The positive values of gibbs free energy (ΔG), indicate that thermal decomposition process for all the complexes is highly non-spontaneous. Thermal degradation followed a multi step decomposition for all the complexes followed by formation of a final stable residue of metal oxide. Biological studies for determining the antimicrobial activities of the complexes were carried against of E.coli, S.aureus and B.subtilis. Among the three complexes, Ni(II)- Sulfanilamide complex proved to be very effective against the three bacterial strains taken. While the efficacy of Fe(III) complex was found only against S.aureus. Cu(II)- sulfanilamide complex did not show any satisfactory resistance against any of the three strains.
Conflict of Interest
There is no conflicting interest.
Acknowledgments
This research did not receive any specific grant from funding agencies in the public, commercial, or not-for-profit sectors.
References
- Cunning, D. S.; Guerry, D. Arch. Otolaryngol. 1941, 34(4), 809-819.
- Navarro, M.; Vásquez, F.; Sanchez-Delgado, R. A.; Perez, H.; Sinou, V.; Schrevel, J. J. Med. Chem. 2004, 47(21), 5204–5209.
- Pattan, S. R.; Pawar, S. B.; Vetal, S. S.; Gharate, U. D.; Bhawar, S.B. Indian Drugs. 2012, 49(11), 5-12.
- McEvoy, G. K. Sulfonamides in american hospital formulary service. Drug Information 1993, 472.
- Zahid, H.; Supuran, C. T. Journal of Enzyme Inhibition and Medicinal Chemistry. 2008, 23(2), 240–251.
- Adedibu, C. T.; Joshua, A. O. Int. J. Chem. Sci. 2010, 8(3), 1675-1683.
- Modhavadiya, Orient J. Chem. 2012, 28(2), 921-925.
- Ahmed M. M. Journal of Molecular Structure. 2013, 1035, 114–123.
- Lahtinen, M. Journal of Molecular Structure. 2014, 1060, 280–290.
- Radha, S.; Mothila, K. K.; Thamaraichelvan, A.;, Elangovana, Journal of Chemical and Pharmaceutical Research. 2016, 8(8), 202-211.
- Kappe, C. O.; Dallinger, D. Nat. Rev. Drug Discovery. 2006 5, 51-63.
- Garcia-Raso, A., Fiol, J. J.; Rigo, S.; Lopez-Lopez, A.; Molins, E.; Espinosa, E. Polyhedron. 2000, https://doi.org/10.1016/S0277-5387(00)00355-7.
- Balouiri, M.; Sadiki, M.; Ibnsouda, S. K. Journal of Pharmaceutical Analysis. 2016, 6, 71–79.
- Prajapat, G.; Gupta, R.; Bhojak, N. Chemical Science International Journal. 2018, 24(2), 1-13.
- Prajapat, G.; Rathore, U.; Gupta, R.; Bhojak, N. AIP Conference Proceedings. 2018, 1953 (080025), 1-5. DOI: 10.1063/1.5032831.
- Yadav, N.; Bhojak, N. The Int. J. Eng. Sci. 2013, 2(2), 166-168.
- Singh, B. K.; Mishra, P.; Prakash, A.; Bhojak, N. Arabian Journal of Chemistry. 2017, 10, S472-S483.
- Narang, K. K.; Gupta, J. K. Transition Met. Chem. 1977, 2, 181-183.
- Cotton, F. A.; Wilkinson, G.; Murillo, C. A.; Bochmann, M. Advanced Inorganic Chemistry. 1999, 6th edn. Wiley, New York.
- Topacli, C.; Topacli, A. Journal of Molecular Structure. 2003, 644, 145–150.
- Topacli, C.; Topacli, A. Journal of Molecular Structure. 2003, 654, 153–159.
- Nakamoto, K. Infrared and Raman Spectra of Inorganic and Coordination Compounds, 2009, 6th edn. Wiley, New York.
- Levere, A.B. P.; Mantovani, E.; Ramaswamy, B. S. Canadian Journal Of Chemistry. 1971, 49(11), 1957-1964.
- Duval, C. Inorganic Thermogravimetric Analysis, 1963, 2nd edn. Elsevier Pub. Amsterdam, London, New York.
- Coats, A. W.; Redfern, J.P. Nature. 1968, 201(1), 68-69.
- Vyazovkin, S.; Burnham, AK, Criado, J. M.; Perez-Maqueda, L.A.; Popescu, C.; Sibrrazzuoli, N. Thermochimica Acta. 2011, 520, 1–19.
- Scholar, E. M.; Pratt, W. B. The Antimicrobial Drugs. 2000, Oxford University Press.
- Anderson, R.; Groundwater, P.; Todd, A.; Worsley, A. Antibacterial Agents. 2012, Wiley, New York.
Accepted on: 03-02-2019


ISSN Online: 2231-5039

![]()


