Structure Activity Relationship Analysis of Antioxidant Activity of Simple Benzene Carboxylic Acids Group Based on Multiple Linear Regression
Fadilah Fadilah1,4, Ade Arsianti1,4, Arry Yanuar2 , Retnosari Andrajati2, Rafika Indah Paramita1,4 and Ernie Hernawati Purwaningsih3,4
1Department of Medical Chemistry, Faculty of Medicine, Universitas Indonesia, Jakarta, Indonesia.
2Faculty of Pharmacy, Universitas Indonesia, Depok, Indonesia.
3Department of Medical Pharmacy, Faculty of Medicine, Universitas Indonesia, Jakarta, Indonesia.
4Drug Development Research Center, Indonesia Medical Education Research Institute, FMUI, Jakarta.
Corresponding Author E-mail: fadilah81@gmail.com
DOI : http://dx.doi.org/10.13005/ojc/340558
Article Received on : 25-04-2018
Article Accepted on : 05-08-2018
Article Published : 01 Oct 2018
A multivariate analysis of the quantitative relationship of antioxidant structure and activity of a series of benzoic acid derivatives based on computational chemical properties was calculated. The parameters were obtained from the optimized structure of ionization pKa and hydrophobic ClogP while the compound activity was obtained from the literature. Analysis of the relationship between antioxidant activity and chemical properties of the compound was performed with the SPSS 21 program. The analysis result gives the best equation model as follows: Log 1 / IC50 = –1.514 + 0,516 log P + 0.087 pKa (n = 10 r = 0,962 SE = 0,301 Fcalc./Ftable = 1,422).
KEYWORDS:Antioxidant; Benzoic Acid Derivatives; QSAR
Download this article as:| Copy the following to cite this article: Fadilah F, Arsianti A, Yanuar A, Andrajati R, Paramita R. I, Purwaningsih E. H. Structure Activity Relationship Analysis of Antioxidant Activity of Simple Benzene Carboxylic Acids Group Based on Multiple Linear Regression. Orient J Chem 2018;34(5). |
| Copy the following to cite this URL: Fadilah F, Arsianti A, Yanuar A, Andrajati R, Paramita R. I, Purwaningsih E. H. Structure Activity Relationship Analysis of Antioxidant Activity of Simple Benzene Carboxylic Acids Group Based on Multiple Linear Regression. Orient J Chem 2018;34(5). Available from: http://www.orientjchem.org/?p=50046 |
Introduction
Phenolic compounds are secondary metabolites in plants with a common aromatic ring bearing one or more hydroxyl groups. More than 8000 natural phenolic compounds have been identified to date. These phenolic compounds are known to exhibit potent anti-cancer activities as well as combat various diseases associated with oxidative stress. Prior studies have demonstrated that the health beneficial effects of dietary phenols are due to their ability to exhibit antioxidant, anti-inflammatory activities. Phenolic compounds have been highlighted for plant growth regulation and antioxidative effect. Benzoic acid derivatives (e.g. syringic acid, salicylic acid, juglone, and salicylaldehyde) have been studied for plant growth promotion and inhibition effects due to abundance of various natural resources. In addition, benzoic acid class is currently used as herbicide since it possesses hormone-like activity.1,2 For example, salicylic acid is known as a root growth regulator on Arabidopsis and its allelopathy mechanism was considered as the ROS-mediated pathway.3 Although benzoic acid class is well studied about their antioxidant activity with structure-activity relationship (SAR),4 studies like biological activity relationships between structure and antioxidative property are rarely reported.
Quantitative structure–activity relationship (QSAR), originally evolved from physical organic chemistry, has now evolved as a well-recognized tool for application in chemistry when a biological activity or property or toxicity is the end point of the study for a series of chemicals of certain degree of structural similarity and predictors.5,6 The predictors including net atomic charge, bipolar moment, and octanol/water partition coefficient (log P).7 In the Hansch analysis, the parameter parameters are treated as independent variables (predictors) to explain the value of biological activity. Multilinear regression analysis is widely used in deriving model coefficients. Hansch8 studied compounds that already had skeletons with limited structural variation on functional groups on specific sides. This approach has been applied in predicting the influence of substituents in a large number of biological tests.9
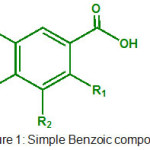 |
Figure 1: Simple Benzoic compounds. |
Table 1: Simple Benzoic compounds.
| Compounds | R1 | R2 | R3 | R4 |
| 1 | H | H | H | H |
| 2 | OH | H | H | H |
| 3 | OH | OCH3 | H | H |
| 4 | OH | NH2 | H | H |
| 5 | OH | H | OCH3 | H |
| 6 | H | H | OH | H |
| 7 | OCH3 | OCH3 | H | H |
| 8 | OH | H | H | OCH3 |
| 9 | NH2 | H | H | OH |
| 10 | H | NH2 | OH | H |
| 11 | OCH3 | OCH3 | OCH3 | H |
| 12 | OH | OH | OH | H |
| 13 | H | OCH3 | OCH3 | H |
| 14 | H | OCH3 | H | OCH3 |
| 15 | OH | H | H | NH2 |
| 16 | OH | H | NH2 | H |
| 17 | Cl | H | Cl | H |
| 18 | NH2 | H | H | H |
Methods
Preparation of Compounds
The structure of phenolic compounds we used based on activity of core molecule. The structure of molecule based on simple benzoic acid are summarized in Table 1.
To obtain the QSAR equation, the data is presented in table 2 covering each antioxidant activity (in IC50 exp. and IC50 theory) as the dependent variable pKa and ClogP the value of QSAR properties as the independent variable calculated by ACD Labs software.
QSAR Analysis
The parameter correlation was calculated by compound activity based on linear regression analysis using SPSS for Windows backward program on 21 data which have separated. The calculation results are used to indicate the order of important free variables that serve as descriptors. Variations of several independent variables form several alternative models of equations. For equation model can be calculated to some statistical parameters such as r, r2, SD and F. In addition to the statistical parameters, the calculation results also obtained the coefficient value of each independent variable involved in the model equation. The value of the obtained coefficient is used to calculate the theoretical activity. The data of theoretical activity is compared with the compound experimental activity. The final equation was obtained by linear regression analysis on 18 compounds with SPSS program.
Results and Discussion
The existence of substitution of one atom induces partial charge of each atom that is from C1 to C6 on ring A (aromatic ring). At atom C number undergoes changes in net charge of atoms which differ greatly from the net charge of other atoms that net charge of atom number influence to electronic and hydrophobic of compounds. That pKa and log P on compounds as independent variable. From table 1 shows that each independent variable has a relatively small effect on IC50. The highest coefficient value is owned by Clog P that is equal to 2.2351. But the closeness of the relationship between variable with activity cannot be used to declare that variable influential to activity. So further study is needed to see the existence of other factors that affect the significance of data. This is done by regression analysis to determine the best equation model with the most significant data.
Table 2: Parameter electronic, hydrophobic and IC50 of simple benzoic compounds.
| Compounds | Electronic | Hydrophobic | MW | IC50 exp. | IC50 Theory | ∆G exp. | ∆G Theory |
| pKa | CLog P | ||||||
| 1 | 4.249 | 1.885 | 122.04 | 1.066863 | 1.154 | -0.2821 | -3.7354 |
| 2 | 2.983 | 2.1872 | 138.03 | 0.791857 | 0.278 | -1.01728 | -5.7539 |
| 3 | 2.799 | 1.9851 | 168.15 | 0.645257 | 0.378 | -1.9097 | -6.363 |
| 4 | 2.901 | 1.0562 | 153.04 | 0.211709 | 0.485 | -6.7675 | -7.0811 |
| 5 | 2.986 | 2.2351 | 168.04 | 0.733754 | 0.121 | -1.3494 | -4.9179 |
| 6 | 4.109 | 1.5572 | 138.03 | 0.782439 | 0.363 | -1.0694 | -4.9856 |
| 7 | 3.413 | 1.2346 | 182.06 | 0.667912 | -0.147 | -1.75929 | -3.765 |
| 8 | 1.716 | 2.252 | 154.03 | 0.667402 | -0.229 | -1.7627 | -3.4649 |
| 9 | 3.696 | 0.6562 | 153.04 | 0.185572 | 0.542 | -7.3419 | -7.4931 |
| 10 | 4.027 | 0.7962 | 153.04 | 0.185572 | 0.525 | -7.438 | -7.3685 |
| 11 | 3.886 | 1.2574 | 212.07 | 0.498892 | -0.340 | -3.0311 | -3.1032 |
| 12 | 3.691 | 0.4254 | 170.02 | 0.067051 | 0.551 | -11.7793 | -7.5656 |
| 13 | 4.069 | 1.6646 | 182.06 | 0.617379 | -0.295 | -2.10223 | -3.2438 |
| 14 | 3.883 | 2.0146 | 182.06 | 0.70691 | -0.340 | -1.51193 | -3.1034 |
| 15 | 2.941 | 1.0562 | 153.04 | 0.173157 | 0.393 | -7.6437 | -6.4572 |
| 16 | 3.904 | 1.208 | 137.05 | 0.328347 | 0.374 | -4.8545 | -6.3342 |
| 17 | 2.986 | 2.2351 | 168.04 | 0.721852 | 0.002 | -1.4207 | -4.36 |
| 18 | 2.8 | 2.2351 | 168.04 | 0.615925 | 0.022 | -2.1125 | -4.456 |
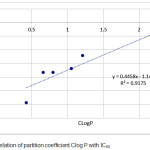 |
Figure 2: Correlation of partition coefficient Clog P with IC50
|
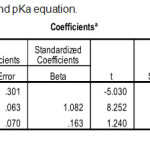 |
Table 3: Statistical result for logP and pKa equation. |
Based on research showed Table 2, benzoic acid with different chemical properties was effect as antioxidant by induces oxidation of enzyme peroxidase. The biological effect of oxygen-reactive species controlled by antioxidant mechanisms are exerted on the basis of antioxidant enzymes and substrates. From the benzoic acid group (compounds 3, 4, 5, 8, 9, 10, 12, 16, 17 and 18) were the strongest antioxidant activity in each group. Thus, benzaldehyde group was considered as an important new structure module to be induced oxidation. C2-functionalized benzaldehydes including salicylaldehyde, 2,3-dihydroxybenzaldehyde, and 2,4,5-trihydroxybenzaldehyde showed stronger inhibition activity than the others. The hydroxylation of aromatic structure is generally involved with antioxidative activity like radical scavenging activity.10
Figure 2 showed that partition coefficient log P have correlation with IC50 in the equation model also has an effect because has R value 0.9175. From regression linear that Clog P most effect on drug molecules, the penetration of cell membranes is related to the solubility of the drug in fat. A high log P value indicates that the compound is more distributed into nonpolar octanols, such as fat, rather than non-polar distributed water. The QSAR equation is very supportive in the early stage of the new drug-making process that is antioxidant from another derivative of simple phenolic acid in the form of new compound model with better activity estimate. Increasing the value of this activity can be done by varying the substituent groups on the influential C atom.
In statistical test, r2 is used because r2 is greater accuracy than r. The best equation model is obtained when the value of r2 approaches 1. If r2 approaches 1 then the correlation between the independent variable and the independent variable is perfect. In model has the highest r2 value of 0.962. For the lowest r2 value with a value of 0.946. However, the parameter r2 is only one linearity measure with the equation model. Another statistical analysis is to review the SE value. The smaller the value of the SE the more accurate the data. A small SE value indicates that the data being analyzed is closer to the true value. The value of SE owned by models is 0.098. Therefore need to be reviewed other parameters that are parameter Fcalc./Ftable. The greater the value of Fcalc/Ftable then the data will be significant. The lowest Fcalc/Ftable is owned by model that is 60.71. Statistically model is unacceptable because the large SE value indicates that the model has a large error rate. A small Fcalc/Ftable value also signifies a significantly low level.
The value of antioxidant activity of simple benzoic acid compounds has a quantitative association with various chemical properties of the compound and is expressed in terms of the following QSAR equation:
Log 1 / IC50 = –1.514 + 0,516 log P + 0.087 pKa …..(1) with n = 10 r = 0,962 SE = 0,301 Fcalc./Ftable = 1,422
The results of the SAR equation show that benzaldehyde such as 2,3-dihydroxybenzaldehyde and 4-hydroxy-3-nitrobenzaldehyde as an active antioxidant induces oxidation processes in peroxidase enzymes, and chemical manual applications should be studied further as an antioxidant active.
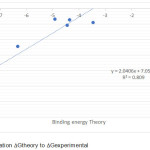 |
Figure 3: Correlation Gtheory to Gexperimental. |
The predicted value of antioxidant activity by inducing oxidation of enzyme peroxidase is listed in Table 2, so it can be compared with experimental activity. Predictive graphs are presented in Fig 3. In this figure, we get the equation of the straight line between the Gprediction to Gexperimental with slope value close to 1 that is 0.809.
In these models, R is the correlation coefficient and R2 is the squared correlation coefficient. These correlation coefficients describe the relative measure of the quality of fit by the regression equations. R-value explains the variation in the observed data (experimental) and its values vary from -1 to +1. The closer the R values to 1, better the fit of the regression equation. R2 values of the training set models are > 0.809 (R ≥ 0.8) in MLR analysis. The regression analysis regressions also give the R2 values 0.809 with the same descriptors as the normal MLR.11
To estimate the predictive power of a QSAR model, Golbraikh and Tropsha recommended use of the following statistical characteristics of the test set12: (i) correlation coefficient R between the predicted and observed activities; (ii) coefficients of determination (R2). (iii) slopes R2 of the regression lines through the origin.
Conclusion
Conclusions on the relationship between physicochemical properties (hydrophobicity, steric property, and electronic property) and antioxidant activity. That benzaldehyde such as 2,3-dihydroxybenzaldehyde and 2,4,5-trihydroxybenzaldehyde as an active antioxidant with induces oxidation processes in peroxidase enzymes.
Acknowledgments
We thank Directorate for higher education, Ministry of Research and Technology Republic of Indonesia and Faculty of Medicine, University of Indonesia for the PITTA (Publikasi Internasional Terindeks untuk Tugas Akhir Mahasiswa) research grant. Drug Development Cluster of Indonesia Medical Education and Research Institute, FMUI for facilities.
References
- Lee, S., Kim, S.G., Park, C.M. New Phytol. 2010, 188, 626–637.
CrossRef - Lee, S.E., Yun, M.S., Yeon, B.R., Choi, J.S., Cho, N.K., Hwang, K.H., Wang, H.Y., Kim, S. Kor J Weed Sci. 2010, 30, 191–198.
CrossRef - Geun, H.C., Jin, H.R., Byoung, J.P., Deuk, Y.L., Mi, S.C, Dong, Y.L., Woo, D.S, Jin, H.K. J Appl Biol Chem. 2016, 59 (2), 159−164.
- Kubinyi, H. QSAR: Hansch Analysis and Related Approaches. 2008.
- Dearden, J.C. Intl J Quant Struct-Prop Rel. 2016, 1, 1–44.
- Roy, K., Kar, S. and Das, R.S. Understanding the Basics of QSAR for Applications in Pharmaceutical Sciences and Risk Assessment. 2015.
- Kokpol, S.U., Hannongboa, S.V., Thongrit, N., Polman, S., Rode, B.M. and Schwendinger, M.G. Anal Sci. 1988, 4, 565-568.
CrossRef - Hansch, C., Leo, A. Exploring QSAR. Fundamentals and Applications in Chemistry and Biology, American Chemical Society, Washington, USA, 1995.
- Richon, A.B dan Young, S.S. An Introduction to QSAR Methodology 2000. Cited in : http://www.netsci.org/Science/Compc hem/feature 19.html.
- Foti, M.C., Daquino, C., Mackie, I.D., DiLabio, G.A., Ingold, K.U. J Org Chem. 2008, 73, 9270–928.
CrossRef - Jianhua, W., Xin, L., Weidong, C., Qinjian X., Yingian, L. Molecular Informatics. 2009, 28, 969-978.
- Golbraikh, A., Tropsha, A.J. Mol. Graphics Mod. 2002, 20, 269-276.
CrossRef

This work is licensed under a Creative Commons Attribution 4.0 International License.
![]()
A New Edition of Web of Science
Journal Impact Factor
2022: 0.5
Five Year: 0.8
Journal is Indexed in

Cabells Whitelist
![]()


