Synthetic and Study the Chelating Activity of Some Polymers Containing Heterocyclic Rings Which Derivative from 1,2,4- Trizol Levofloxacin Acid

1Department of Chemistry, Collage of Science, University of Misan, Misan, Iraq.
2Department of Chemistry, Collage of Basic Education, University of Tikrit, Tikrit, Iraq.
Corresponding Author E-mail: ali_6222@yahoo.com.sg
DOI : http://dx.doi.org/10.13005/ojc/3404042
Download this article as:
![]()
The compound 6-amino-5-mercapto-4H-1,2,4-triazol-3-yl)-9-fluoro-3-methyl-10-(4-methylpiperazin-1-yl)-2,3-dihydro-7H-[1,4] oxazino[2,3,4-ij] quinolin-7-one (M1) synthesize from the reaction of thiocarbohydrazide with levofloxacin acid by using ethanol as a solvent, phenolic Schiff bases (Z)-9-fluoro-6-(4-((4-hydroxybenzylidene) amino)-5-mercapto4H1,2,4-triazol-3-yl)-3-methyl-10-(4-methylpiperazin-1-yl)-2,3-dihydro-7H-[1,4]oxazino[2,3,4-ij] quinolin-7-one (M2), (Z)-6-(4-((2,4-dihydroxybenzylidene) amino)-5-mercapto-4H-1,2,4-triazol-3-yl)-9-fluoro-3-methyl-10-(4-methylpiperazin-1-yl)-2,3-dihydro-7H-[1,4] oxazino[2,3,4-ij]quinolin-7-one (M3) and (Z)-6-(4-((5-chloro-2-hydroxybenzylidene) amino)-5-mercapto-4H-1,2,4-triazol-3-yl)-9-fluoro-3-methyl-10-(4-methylpiperazin-1-yl)-2,3-dihydro-7H- [1,4] oxazino[2,3,4-ij] quinolin-7-one (M4) were prepared from the reaction of trizol derivative of [M1] compound with the appropriate phenolic aldehydes by using ethanol as a solvent. The synthetic Schiff bases used to prepare numbers of phenolic polymers [M5-M7] from the reaction of Schiff bases [M2-M4] with phenol formaldehyde. The analytical efficiency of the synthetic chelating polymers studied by the batch method with different transition metals ions (Cd2+, Fe3+, Cu2+), in terms of the effect of treatment time and the pH on the loading capacity of the polymers, controlling the other factors such as temperature, ions concentration and quantity of polymers. The result shows that the capacity of the polymer increased with increasing of the pH and treating time. The synthetic compounds were characterized by various instrumental techniques like FTIR, 1H-NMR, DTG and TGA studies.These spectral and thermal studies provide very valuable information about the structural features.
KEYWORDS:1,2,4- trizol Levofloxacin acid; 1H-NMR; Heterocyclic Rings; TGA
Introduction
Micro-organisms has reached on alarming level around the world, and the synthesis of new anti-infective compounds has become an urgent need for the treatment of microbial infections. The1,2,4-triazole nucleus has been incorporated into a wide variety of therapeutically important agents, which mainly displaying antimicrobial activities.1 Organic compounds incorporating heterocyclic ring systems continue to attract considerable interest due to their wide range of biological activities. Among different five-membered heterocyclic systems 1,2,4-Triazoles and 1,3,4-Thiadiazoles and their derivatives have gained importance as they constitute the structural features of many bioactive compounds. It is known that Triazole and Thiadiazole rings are included in the structure of various drugs.2,3 From these classes of heterocyclic compounds, the synthesis of new derivatives of 1,2,4-triazole-3-thiones and 2-amino-1,3,4- Thiadiazoles has been attracting considerable attention because of various biological properties such as: antibacterial,4,5 antifungal,6 anti-tubercular,7 antiviral,8 antioxidant ,9,10 antitumoral,8 anti-inflammatory,11 anticonvulsant,12 etc. In this study, a new Triazole derivative was synthesized by many cyclization reactions, the analytical efficiency of the synthetic chelating polymers studied by the batch method with different transition metals ions (Cd2+, Fe3+, Cu2+).
Materials and Methods
Syntheses of Triazole Compound [M1]
A mixture of (0.36g, 0.001mol) of levofloxacin and 0.1g (0.001mol) of thiocarbohydrazide with absolute ethanol as a solvent was refluxed for 6 hrs and then cooled and separated by filtration and the solid was recrystallized from ethanol in order to obtain the desired result in the form of crystals with yellow colour and with a yield of (65%) and melting point (211-213°C). TLC method was used to determine the purity of the prepared compound.
Syntheses of Shiff Base Compounds [M2-M4]
A mixture of (0.001mol, 0.36 g) of the M1 compound and (0.001mol) of the appropriate benzaldehyde derivatives by using the absolute ethanol as a solvent. The reaction mixture was refluxed for 4 hrs on a heat source with stirring, then cooled to room temperature. The precipitated was filtered off, washed with water and recrystallized from ethanol. The TLC method was used to determine the purity of the prepared compounds.
Table 1: Some physical properties of prepared compounds [M2-M4]
| samples | R | Formula | M.P ᴏC | Yield | Color |
| M2 | 4-OH | C25H26FN3O6 | 226-228 | 66% | Brown |
| M3 | 2-OH,4-OH | C25H26FN3O7 | 233-235 | 58% | Brown |
| M4 | 2-OH,5-Cl | C25H25FNO6Cl | 216-218 | 63% | White |
Preparation of Chelating Resins [M5-M7]
In a rotary beaker (0.003mol) of prepared compounds (M2-M4) with (0.074mol) of phenol 12), added a well-mixed formaldehyde mixture (25 mL) and then raise the pH to (9-10.5) by adding (10%) of sodium hydroxide. The mixture refluxed with constant stirring for 4 hours until getting a sticky reddish-brown gel and solvent evaporated. The product was then transferred to a drying oven at a temperature of 120 °C for 2 hours to complete the calcination. grinding then washed thoroughly with the deionized water to dispose of the residue (un-reactant material) then dried in vacuum until the weight was acquired, the products measured by thermal analysis (TG / (DTG).
Preparation of standard solutions for element ions
The standard solutions prepared by dissolving the appropriate weights of the metal nitrate in the little amount of water, added 2 ml of concentrated nitric acid or concentrated hydrochloric acid and according to the using salt, then complete the volume to 500 ml using the deionized water. Table 2 show the weights which used for component salts to prepare standard solutions (1000) ppm in metal ion. A certain volume of these ions was diluted to give a concentration of 100 ppm for each ion and in different pH. The pH was confirmed by using nitric acid solution and ammonium hydroxide solution at a concentration of 1 M for each one.
Table 2: The weights used for the salts of each element required to obtain 500 ml of solutions at a concentration of 1000 ppm.
| No. | Formula | Wight in 500 ml |
| 1 | Cd(NO3)2.6H2O |
2.561gm |
| 2 | FeCl3 | 1.312 gm |
| 3 | Cu(NO3).3H2O |
1.482gm |
Results and Discussion
The compounds were prepared according to the steps of the methods mentioned in the section 2 according to the following scheme 1.
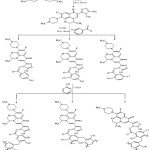 |
Scheme 1 |
The compound [M1] prepared from the reaction of thiocarboohydrazide with levofloxacin acid by reflux and ethanol as solvent as the following mechanic scheme 2:
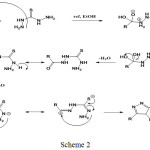 |
Scheme 2 |
FTIR Spectra
FTIR Analysis of Compound (M1)
It was confirmed that the reaction completed by the change in the physical properties such as melting point and color. The FTIR analysis of M1 was observed within the bands at range (3343-3372 cm-1) due to the asymmetric vibration of the NH2 group (Fig.1). A band was also found at the range (3047-3180 cm-1) due to Ar-H and C=C (Ar-H) vibration. A peak at the range (2973-2857 cm-1) due to the pendulous vibration of the SH series and absorption peak at (1691cm-1) was found for the extension of the carbonate group (C=O). A peak at (1649) cm-1 stretching mods of (C=N), as well as the absorption bands appeared within the range (1560 cm-1) belonging to the fluctuation of the bond (C = C).
![Figure 1: Infrared spectra of the [M1]](https://www.orientjchem.org/wp-content/uploads/2018/08/Vol34No4_Syn_Tah_fig1-150x150.jpg) |
Figure 1: Infrared spectra of the [M1]
|
FTIR analysis of compound (M2 and M4)
FTIR spectra are shown in (Fig. 2), The bands at (3464-3508 cm-1) was attributed to the bending mode of the OH group. The disappearance of the NH2 peak was observed. The spectra showed a band within the range 3011-3122 cm-1 as a result of the vibration of C-H and aromatic bands within the range 2919-2894 cm-1 was attributed to the symmetrical symmetry-like- symmetry of C-H, a peak that the 2631-2634 cm-1 was due to SH, 1694-1713 cm-1 is due to the vibration of the carbonate group C=O, peaks at1648-1653 cm-1 due to the variation of C=N group, Absorption bands appeared within the range 1568-1598 cm-1 belonging to the vibration of the C=C bond as shown in Table 3 and (Fig 3). These compounds [M2, M4] were identified using the H-NMR technique using DMSO-d6 as a solvent.
![Figure 2: Infrared spectra of compound [M3]](https://www.orientjchem.org/wp-content/uploads/2018/08/Vol34No4_Syn_Tah_fig2-150x150.jpg) |
Figure 2: Infrared spectra of compound [M3]
|
Table 3: FTIR assignments for the compounds M2, M3 and M4
| No. | OH cm-1 | Ar-H cm-1 | C-Hcm-1 | S-Hcm-1 | C=Ocm-1 | C=Ncm-1 | C=Ccm-1 |
| M2 | 3464 | 3122 | 2941 | 2634 | 1694 | 1648 | 1582 |
| M3 | 3508 | 3075 | 2919 | 2632 | 1713 | 1650 | 1568 |
| M4 | 3487 | 3011 | 2977 | 2631 | 1702 | 1653 | 1598 |
1H NMR Spectra
1H NMR Spectra of (M1)
The magnetic resonance spectrum of the M1 showed a single signal at 1.22 ppm fraction per million of the CH3 protons (fig.3). A single signal at ppm (2.10) was due to the ringing of N-CH3 protons and singled out as resonant (CH3) and (CH) interlocking ring (CH) and other single signalling of protein resonance O-CH2 group at chemical shift (4.43) ppm and the appearance of a single signal at displacement (5.70) ppm due to the resonance of NH2 proteins and multiple signalling at ppm (7.29-7.70) attributed to aromatic rings (Ar-H) and the emergence of other packages
![Figure 3: 1H-NMR spectra of compound [M1]](https://www.orientjchem.org/wp-content/uploads/2018/08/Vol34No4_Syn_Tah_fig3-150x150.jpg) |
Figure 3: 1H-NMR spectra of compound [M1]
|
1H NMR spectra of (M2)
The NMR spectrum of the compound showed a single signal at (1.12) ppm due to the resonance of protons CH3 and a single signal at 2.08 ppm due to the resonance of N-CH3 and single signal at 3.36 ppm, the signal was observed in the absence of the monotonous signal of the NH2 (fig.4). The spectrum showed a multiple signal at the range (7.02-7.89) ppm due to the Ar-H proton resonance. A single new signal was observed at (8.9) ppm due to isomethene proton resonance (N = CH) in addition to the emergence of another single new signal at (9.45) ppm belonging to the group (OH).
![Figure 4: 1H-NMR spectra of compound [M2]](https://www.orientjchem.org/wp-content/uploads/2018/08/Vol34No4_Syn_Tah_fig4-150x150.jpg) |
Figure 4: 1H-NMR spectra of compound [M2]
|
1H NMR spectra of (M4)
The NMR spectrum showed a single signal at (1.87) ppm of protons (CH3) and a mono signal at (2.10) ppm due to protons (N-CH3) and a single signal at 3.33 ppm to the proton (SH) (fig.4). The spectrum showed a multiple signal at the range (7.01-7.88) ppm due to Ar-H resonance with a new mononuclear signal at 8.59 ppm and a new monochromatic signal at (9.55) ppm belong to the group (OH).
![Figure 5: 1H-NMR spectra of compound [M4]](https://www.orientjchem.org/wp-content/uploads/2018/08/Vol34No4_Syn_Tah_fig5-150x150.jpg) |
Figure 5: 1H-NMR spectra of compound [M4]
|
Thermal analysis
Thermal analyses of the prepared polymers (TG, DTG) were recorded at room temperature (900 m) and at a heating rate (min / 10 m) and in an atmosphere of nitrogen.
Thermodynamic Analysis of Polymers [M5]
The shapes show the thermodynamic curves (DTG, TGA) of the polymers (fig.6). Five decomposition phases. The compound showed a weak bond at 100 C and a small loss (3.69%) due to moisture loss. (14.95%) as shown by the TG curve and the third decomposition begins loss of (450-680) m 0 and loss rate of 13.69% and the fourth stage starts loss at (620-470) m 0 loss of 17.025%) and the fifth stage shows weak packets (770-720) m and loss rate of 3.67%) through the stages of the loss process.
![Figure 6: TG / DTG thermal analysis curve for polymer [M5]](https://www.orientjchem.org/wp-content/uploads/2018/08/Vol34No4_Syn_Tah_fig6-150x150.jpg) |
Figure 6: TG / DTG thermal analysis curve for polymer [M5]
|
Thermal Analysis of Polymer [M7]
The shapes show the thermodynamic curves (DTG, TGA) of the polymers(fig.7). Three phases of disintegration of the compound showed a weak bond at 100 m (0) with a low loss rate (60.25%) due to moisture loss and loss rate (6.65%) as shown by the curve (TG) and the third decomposition begins at (380-560 m) and loss rate (12.15%) through the stages of loss.
![Figure 7: TG / DTG thermal analysis curve for polymer [M7]](https://www.orientjchem.org/wp-content/uploads/2018/08/Vol34No4_Syn_Tah_fig7-150x150.jpg) |
Figure 7: TG / DTG thermal analysis curve for polymer [M7]
|
Analytical measurements.
A selective study of resins towards elements
The maximum loading capacity of the resins to the studied elements at the maximum treatment time 24 hours and the highest pH of the metal ion solution, where the solution is clear and non-turbid and at room temperature, is the optimal condition used for the study of selective renal resins. The process is treated with 0.1 g of resins with element ions, which are 100-ppm in isolation for 24 hours and at the highest acidic function of the element ions solution. The filtration process is performed and the concentration of each ion in the leachate is performed mediated Atomic absorption spectrometry to determine the number of ions associated with different resins studied [M5-M7].
Effect of transaction time on resins loading capacity
The effect of the treatment time for resins was studied with the ions of the studied ions after each other stabilizing factors, namely the size of the solution and the acidic function, were treated with (0.1) g of resin with (10) ml of the element ions solution at 100 ppm for different periods of time ranging from 1 to 24 hours and then the concentration of ions associated with resin was calculated.
Effect of pH function on the load capacity of the composite resin [M5-M7]
The effect of the pH on the loading capacity was studied by treating (10 mL) of the ion solution for specific periods of time in each pH studied with 0.1 g of resin. The highest loading capacity of most ions is at the highest pH of the ion solution under study. Cu2+, Fe3+, Cd2+.
Study of Analytical Efficiency of Metallic Resins [M5-M7].
Analytical efficiency of the resin towards the studied ions, which includes the two and three charge ions (Cu2+, Fe3+ Cd2+). The ion concentration in these solutions was determined by atomic absorption spectroscopy technique, Concentrate 100 ppm with 0.1 g of resin and for 24 hours. All ions have shown a significant response to the resin.
The effect of the treatment time on the maximum load capacity of the composite resins [M5-M7].
The increase in the treatment time increases the loading capacity of resins in general for the studied ions. The loading capacity reaches its maximum at the highest treatment time 24 hours. This study was conducted to determine the effect of the processing time on loading capacity. Resins of the ions reach the state of equilibrium almost after 7-8 hours, when all the acidic functions are under study, and the amount of increase in loading capacity becomes slightly until 24 hours of treatment. The effect of the treatment time on the loading capacity of ions resins (Cu2+, Fe3+, Cd2+) show in tables 4-6 and figs 8- 16.
Table 4: Number of milligrams of ions (Cu2+, Fe3+, Cd2+), withdrawn by 0.1 gm of the molar resin [M5] as a function of time in different pH.
| Loading Capacity of ion mg ion/gm resin (Time (hr)) | ||||||
|
Ions pH |
1 |
2 |
4 |
10 |
24 |
|
|
Cd |
3 |
1.6 |
2.2 |
3.5 |
4.3 |
5.8 |
|
4 |
2.4 |
3.9 |
5.1 |
5.9 |
6.4 |
|
|
Fe |
1 |
1.2 |
2.7 |
3.6 |
5.1 |
7.4 |
|
5 |
2.3 |
4.2 |
5.4 |
7.6 |
8.5 |
|
|
Cu |
4 |
1.7 |
2.8 |
4.2 |
5.8 |
6.3 |
|
6 |
2.6 |
4.2 |
5.4 |
7.2 |
7.6 |
|
![Figure 8: Number of mg of ions (Cd2+) withdrawn by (0.1 g) of the polymer [M5] as a function of time in different pH=3.4.](https://www.orientjchem.org/wp-content/uploads/2018/08/Vol34No4_Syn_Tah_fig8-150x150.jpg) |
Figure 8: Number of mg of ions (Cd2+) withdrawn by (0.1 g) of the polymer [M5] as a function of time in different pH=3.4. |
![Figure 9: Number of mg / ions (Fe3+) withdrawn by (0.1 g) of the polymer [M5] as a function of time in different pH = 1.5](https://www.orientjchem.org/wp-content/uploads/2018/08/Vol34No4_Syn_Tah_fig9-150x150.jpg) |
Figure 9: Number of mg / ions (Fe3+) withdrawn by (0.1 g) of the polymer [M5] as a function of time in different pH = 1.5
|
![Figure 10: The number of milligrams of ions (Cu2+) drawn by (0.1 g) of the polymer [M5] as a function of time in pH= 4.6.](https://www.orientjchem.org/wp-content/uploads/2018/08/Vol34No4_Syn_Tah_fig10-150x150.jpg) |
Figure 10: The number of milligrams of ions (Cu2+) drawn by (0.1 g) of the polymer [M5] as a function of time in pH= 4.6. |
Table 5: Number of milligrams of ions (Cu2+, Fe3+, Cd2+), withdrawn by 0.1 gm of the molar resin [M6] as a function of time in different pH.
| Loading Capacity of ion mg ion/gm resin (Time (hr)) | ||||||
|
Ions pH |
1 |
3 |
5 |
8 |
24 |
|
|
Cd |
3 |
1.7 |
2.9 |
3.7 |
5.2 |
6.8 |
|
6 |
3.4 |
6.1 |
6.8 |
7.5 |
8.4 |
|
|
Fe |
2 |
1.7 |
3.1 |
4.3 |
6.5 |
7.2 |
|
6 |
2.5 |
5.9 |
5.7 |
6.8 |
7.2 |
|
|
Cu |
2 |
1.3 |
3.5 |
4.2 |
5.6 |
6.7 |
|
5 |
2.4 |
4.3 |
5.9 |
6.7 |
7.4 |
|
![Figure 11: The number of milligrams of ions (Cd2+) drawn by (0.1 gm) of the polymer [M6] as a function of time in pH.](https://www.orientjchem.org/wp-content/uploads/2018/08/Vol34No4_Syn_Tah_fig11-150x150.jpg) |
Figure 11: The number of milligrams of ions (Cd2+) drawn by (0.1 gm) of the polymer [M6] as a function of time in pH. |
![Figure 12: The number of milligrams of ions (Fe3+) drawn by (0.1 gm) of the polymer [M6] as a function of time in pH.](https://www.orientjchem.org/wp-content/uploads/2018/08/Vol34No4_Syn_Tah_fig12-150x150.jpg) |
Figure 12: The number of milligrams of ions (Fe3+) drawn by (0.1 gm) of the polymer [M6] as a function of time in pH. |
![Figure 13: The number of milligrams of ions (Cu2+) drawn by (0.1 gm) of the polymer [M6] as a function of time in pH.](https://www.orientjchem.org/wp-content/uploads/2018/08/Vol34No4_Syn_Tah_fig13-150x150.jpg) |
Figure 13: The number of milligrams of ions (Cu2+) drawn by (0.1 gm) of the polymer [M6] as a function of time in pH. |
Table 6: Number of milligrams of ions (Cu2+, Fe3+, Cd2+), withdrawn by 0.1 gm of the molar resin [M7] as a function of time in pH.
| Ions pH Loading Capacity of ion mg ion/gm resin (Time (hr)) | ||||||
|
|
1 |
2 |
5 |
7 |
24 |
|
|
Cd |
2 |
1.9 |
3.7 |
5.5 |
6.5 |
7.1 |
|
4 |
2.4 |
4.7 |
5.9 |
6.8 |
7.3 |
|
|
Fe |
3 |
1.6 |
3.2 |
4.9 |
5.2 |
6.1 |
|
5 |
3.1 |
5.4 |
6.7 |
7.2 |
8.4 |
|
|
Cu |
3 |
1.3 |
3.4 |
5.2 |
6.6 |
7.1 |
|
6 |
2.8 |
5.1 |
6.4 |
7.2 |
8.5 |
|
![Figure 14: The number of milligrams of ions (Cd2+) withdrawn by (0.1 gm) of the polymer [M7] as a function of time in pH.](https://www.orientjchem.org/wp-content/uploads/2018/08/Vol34No4_Syn_Tah_fig14-150x150.jpg) |
Figure 14: The number of milligrams of ions (Cd2+) withdrawn by (0.1 gm) of the polymer [M7] as a function of time in pH.
|
![Figure 15: The number of milligrams of ions (Fe2 +) withdrawn by (0.1 gm) of the polymer [M7] as a function of time in different acidic functions.](https://www.orientjchem.org/wp-content/uploads/2018/08/Vol34No4_Syn_Tah_fig15-150x150.jpg) |
Figure 15: The number of milligrams of ions (Fe2 +) withdrawn by (0.1 gm) of the polymer [M7] as a function of time in different acidic functions. |
![Figure 16: The number of milligrams of ions (Cu2+) withdrawn by (0.1 gm) of the polymer [M7] as a function of time in different acidic functions.](https://www.orientjchem.org/wp-content/uploads/2018/08/Vol34No4_Syn_Tah_fig16-150x150.jpg) |
Figure 16: The number of milligrams of ions (Cu2+) withdrawn by (0.1 gm) of the polymer [M7] as a function of time in different acidic functions. |
Acknowledgements
Authors will be Acknowledgements the university of Misan, department of chemistry for supporting to achieved this work.
References
- Almajan, G.L.; Bancescu, S-F.; Ioana, S.; Gabriel.G.; Draghici, C., European Journal of Medicinal Chemistry. 2010. 45(12): p. 6139-6146. Synthesis and antimicrobial evaluation of some fused heterocyclic [1,2,4] triazolo[3,4-b][1,3,4]thiadiazole derivatives.,
- Barbuceanu, S.-F.; Almajan, G.L.; Gabriel, A.; Gabriela, L. D.; Constantin, B.; Florica B., European Journal of Medicinal Chemistry, 2012. 49: p. 417-423. New heterocyclic compounds from 1,2,4-triazole and 1,3,4-thiadiazole class bearing diphenylsulfone moieties. Synthesis, characterization and antimicrobial activity evaluation.
- Desai, S.R.; Laddi, U.; Bennur, R.S.; Patil, P. A.; Bennur, S. Indian Journal of Pharmaceutical Sciences, 2011. 73(1): p. 115-120. Synthesis and Pharmacological Activities of Some New 3-Substituted-4-Amino-5-Mercapto-1,2,4-Triazoles.
- Küçükgüzel, Ş.G.; Küçükgüzel, S.; Güniz, R.; Sevim, K.; Muammer. European Journal of Medicinal Chemistry, 2007. 42(7): p. 893-901. Synthesis of some novel heterocyclic compounds derived from diflunisal hydrazide as potential anti-infective and anti-inflammatory agents.
CrossRef - Plech, T.; Wujec, M.; Siwek, A. K.; Urszula, Malm, A., European Journal of Medicinal Chemistry, 2011. 46(1): p. 241-248. Synthesis and antimicrobial activity of thiosemicarbazides, s-triazoles and their Mannich bases bearing 3-chlorophenyl moiety.
- Güzeldemirci, N.U.; Küçükbasmacı, Ö. European Journal of Medicinal Chemistry, 2010.45(1): p. 63-68. Synthesis and antimicrobial activity evaluation of new 1,2,4-triazoles and 1,3,4-thiadiazoles bearing imidazo[2,1-b]thiazole moiety.
- Küçükgüzel, I.; Küçükgüzel, S.; Güniz, R.; Sevim, K. Medicinal Chemistry Letters, 2001. 11(13): p. 1703-1707. Some 3-Thioxo/alkylthio-1,2,4-triazoles with a substituted thiourea moiety as possible antimycobacterials.
- Mavrova, A.T.; Wesselinova, D.; Tsenov, Y. A.; Denkova, P. European Journal of Medicinal Chemistry, 2009. 44(1): p. 63-69. Synthesis, cytotoxicity and effects of some 1,2,4-triazole and 1,3,4-thiadiazole derivatives on immunocompetent cells.
- Gozzi, G.J.; Pires, Amanda do Rocio A. V.; Glaucio, R.; Maria, E. M.; Glaucia, R.; Noleto, G. R. A.; Alexandra, A. S.; Carlos, E. E; Aurea, M.R.; Camilla, P.; Attilio, S. C.C.; Sílvia M. PLoS ONE, 2015. 10(6): p. e0130046. Selective Cytotoxicity of 1,3,4-Thiadiazolium Mesoionic Derivatives on Hepatocarcinoma Cells (HepG2).
- Barbuceanu, S.-F.; Stefania-Felicia, I.; Diana, C. S.; Gabriel U.; Valentina D. C. Radulescu, V., International Journal of Molecular Sciences, 2014. 15(6): p. 10908-10925.
CrossRef - Synthesis and Antioxidant Activity Evaluation of New Compounds from Hydrazinecarbothioamide and 1,2,4-Triazole Class Containing Diarylsulfone and 2,4-Difluorophenyl Moieties.
- El-Moghazy, S.M.; Samir, M. B.; Flora, F.; Abdel-Rahman, H.; Marzouk, M.; Adel, A. Medicinal Chemistry Research, 2012. 21(8): p. 1722-1733. Synthesis and anti-inflammatory activity of some pyrazole derivatives.
- Pattanayak, P.; Sharma, R.; Sahoo, P.K. Chemistry Research, 2009. 18(5): p. 351-361. Synthesis and evaluation of 2-amino-5-sulfanyl-1,3,4-thiadiazoles as antidepressant, anxiolytic, and anticonvulsant agents.
Accepted on: 05-08-2018


![]()


