Adsorption and corrosion inhibition of Azadirachta indica gum with Zn2+/ Ni2+ cations on mild steel in 1 mol L-1 HCl
Department of Chemistry, PSG College of Arts and Science, Coimbatore-641014, India.
Corresponding author E-mail: jmpsgcas@gmail.com.
DOI : http://dx.doi.org/10.13005/ojc/310216
Download this article as:
![]()
This work deals with synergistic corrosion inhibition efficiency of Azadirachta indica gum and metal cations (Zn2+ and Ni2+) on mild steel in 1 mol L-1 HCl using gravimetric, potentiodynamic polarization and electrochemical impedance spectroscopic methods. The effect of temperature (303 - 348± 1 K) and immersion time (1, 2, 3, 4, 6 and 24 h) on the inhibition of corrosion has also been studied. Corrosion kinetic parameters were calculated and discussed in detail. It obeys Langmuir adsorption isotherm. The interaction of inhibitors with the mild steel surface has been established by Fourier transform infrared spectroscopy.
KEYWORDS:mild steel; metal cations; corrosion inhibition; electrochemical techniques
ntroduction
The corrosion protection of mild steel is a significant concern among the corrosion scientist and material technologist1. Although, mild steel has remarkable economic and substantial applications, its poor corrosion resistance in acids confines its usage2. Acid solutions are widely used in pickling of steel, chemical cleaning/ processing, ore production and oil well acidification3. Several methods are used to control the corrosion process but application of inhibitors has been proven to be most practical and efficient for this purpose. Organic compounds containing nitrogen, sulphur and oxygen can be used as efficient corrosion inhibitors4-6. E.E. Oguzie et al.7 observed that the presence of hetero-atoms (N, S, O), aromatic rings or long alkyl chains generally improves corrosion inhibition efficiency.
However, these organic compounds possess excellent corrosion inhibiting properties; the method of synthesis is expensive, tedious and toxic in nature. In sight of this, many alternative green corrosion inhibitors have now been developed. Al-Sahlanee et al.8 found that Sesbania sesban extract can be used as good corrosion inhibitors for carbon steel in acidic medium. Recently, aqueous extracts of Aleo vera9 and Garlic extract10 and Justicia gendarussa plant11 have been reported to be efficient corrosion inhibitors for steel in acid solutions. Natural polymers have been investigated as a better inhibitor as they possess long chain molecules and show high inhibition efficiency at lower concentrations in corrosive media12-14. Literature reported that the synergistic effect of halide ions with natural polymer is effective corrosion inhibitors for metals in aggressive media15. But the synergistic effect between natural polymers and metal cations (Zn2+ and Ni2+) towards the inhibition of corrosion is very limited.
Azadirachta indica gum (AI gum), a typical plant gum exudate is the salt of a complex polysaccharide acid16. It comprised of 35 % of proteinaceous materials and fatty acids. Thus, the complex structure of AI gum consisting of heteroatoms (N and O), suggests that it can be used as a potential material in several fields.
In the present work the corrosion inhibition of AI gum with metal cations (Zn2+ and Ni2+) has been investigated by gravimetric, potentiodynamic polarization and electrochemical impedance spectroscopic methods. Temperature (303- 348 ± 1 K) and time (1, 2, 3, 4, 6 and 24 h) effect has also been studied and discussed in detail. Corrosion kinetic parameters and adsorption studies were carried out to find the nature of adsorption of the inhibitor on the metal surface. Further, Fourier transform infrared spectroscopy (FT-IR) was employed to examine the mode of inhibitor adsorption on the mild steel surface.
Materials and Methods
The gum exudates of Azadirachta indica A. Juss. Meliaceae was collected locally and identified taxonomically and authenticated by the Botanical Survey of India (BSI), Coimbatore, Tamil Nadu, India. Zinc chloride and Nickel chloride used were analytical grade. Laboratory grade hydrochloric acid solution was used as an aggressive medium. All the solutions were prepared using double distilled water.
The mild steel of the composition 0.07 wt. % C, 0.008 wt. % P, 0.34 wt. % Mn, remaining iron (Fe) was used in the study. The metal specimens used for weight loss measurements were cut to obtain rectangular surfaces with dimensions of 25 x 10 x 1 mm with a hole drilled at the upper edge in order to hook it in the glass rod for immersion in the aggressive medium. Substantial layer of the specimen was removed by using various grades of abrasive papers and degreased by scrubbing with bleach- free scouring powder, followed by thorough rinsing in water and acetone.
The gravimetric experiments were carried out according to the ASTM practice standard G-3117. Before initiating the experiments, the pre-cleaned specimens were weighed on a balance using 0.1 mg precision. The weighed specimens were immersed in the corrosive medium with and without inhibitors for 1 hour. After the experiment, the specimens were removed from the corrosive medium and immersed in the clark solution for 40 seconds, rinsed with water, cleaned with acetone, dried in hot air and finally weighed. The mean of weight loss values of three identical specimens were used to calculate the corrosion rate and inhibition efficiency of the inhibitor. Corrosion rate and inhibition efficiency were calculated using the formulae given in equation (1) and (2)

where, W is the weight loss (g), ‘ρ’ the density of the mild steel specimen (g cm˗3), ‘A’ the area of specimen (cm2) and t is the time of exposure (h).

where, Wi and Wo are the weight losses of mild steel in inhibited and uninhibited solution respectively.
The electrochemical experiments were performed using three-electrode cell assembly. The cell consisted of a platinum counter electrode and a saturated calomel electrode (SCE) as the reference electrode. The working electrode was immersed in the acid solution and the constant steady-state (open circuit) potential was recorded as a function of time, when it became virtually constant. The polarization studies were carried out over a potential of + 200 to − 200 mV with respect to the open circuit potential at a scan rate of 1 mV s-1. The linear Tafel segments of the cathodic curves and the calculated anodic Tafel lines were extrapolated to the point of intersection to obtain the corrosion potential (Ecorr) and corrosion current density (Icorr)18. The inhibition efficiency was evaluated from the measured Icorr values using equation (3)

where, is the corrosion current density without inhibitor and is the corrosion current density with inhibitor.
The electrochemical impedance spectroscopic (EIS) measurements were carried out using AC signals of 10 mV amplitude over the frequency range of 10 KHz to 0.01 Hz. The electrode was immersed in the solution for half an hour before starting the impedance measurements. All the impedance data were automatically controlled by Zview software and the diagrams were given as Nyquist plots. The charge transfer resistance (Rct) values were obtained from the diameter of the semicircles of the Nyquist plots. The inhibition efficiency of the inhibitor has been found out from the charge transfer resistance values according to the following equation (4)
![]()
where, Rct and Rct0 are the charge transfer resistance with and without inhibitors respectively.
To determine the interaction of inhibitors with the mild steel specimen, a Shimadzu FT- IR 8000 spectrophotometer is employed in the 4000-400 cm-1 region with KBr disc technique.
Results and Discussion
Gravimetric measurements
The gravimetric measurements were carried out to calculate the corrosion rate and inhibition efficiency for the mild steel in 1 mol L-1 HCl in the absence and presence of different concentrations of AI gum with Zn2+ and Ni2+ separately for 1 h immersion period at 303 ± 1 K. The results of gravimetric studies using the binary systems (AI gum- metal cations) are shown in Table 1.
Table1: Corrosion parameters for various concentrations of AI gum with metal cations on mild steel in 1 mol L-1 HCl
| Concentration of AI gum (g L-1) with 1 mmol L-1 of metal cations | Inhibition efficiency (%) | Corrosion rate × 10-2 (mmpy) | Synergism parameter (S1) | ||||
| Zn2+ | Ni2+ | ||||||
| 0.02 | 0.02 | 56.4 | 62.7 | 3.43 | 3.09 | 1.59 | 1.57 |
| 0.04 | 0.04 | 58.1 | 69.6 | 3.32 | 2.56 | 1.58 | 1.44 |
| 0.06 | 0.06 | 76.8 | 81.2 | 1.85 | 1.51 | 1.24 | 1.28 |
| 0.08 | 0.08 | 75.4 | 78.0 | 2.64 | 1.73 | 1.43 | 1.32 |
| 0.1 | 0.1 | 69.2 | 76.2 | 3.55 | 1.96 | 1.64 | 1.30 |
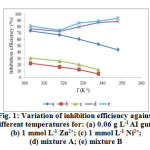 |
Figure1: Variation of inhibition efficiency against different temperatures for: (a) 0.06 g L-1 AI gum; (b) 1 mmol L-1 Zn2+; (c) 1 mmol L-1 Ni2+; (d) mixture A; (e) mixture B |
At lower concentrations, AI gum with metal cations shows very high corrosion rate with heavy mild steel dissolution. The corrosion rate decreases and the inhibition efficiency increases significantly by the addition of 0.06 g L-1 AI gum with Zn2+ (mixture A) and its efficiency reached upto 76.8 %. The inhibition efficiency of 81.2 % is obtained for the formulation consisting of 0.06 g L-1 AI gum – Ni2+ (mixture B). It is evident from the gravimetric results that mixture B shows better inhibition efficiency than mixture A.
Figure 1 represents the inhibition efficiency (%) as a function of different temperatures (303- 348± 1 K) for (a) 0.06 g L-1 AI gum; (b) 1 mmol L-1 Zn2+; (c) 1 mmol L-1 Ni2+; (d) mixture A and (e) mixture B. Analysis of Figure 1 (a) – (c) clearly shows that the decrease in inhibition efficiency with increase in temperature may be attributed to increase in the solubility of the protective films formed by the inhibitors15. In mixture A and B, the inhibition efficiency increase with increase in all the temperature range studied. The obtained inhibition efficiency at 348± 1 K for the mixture A and B are 88.4 % and 92.5 % respectively. From the results it is clear that the synergistic effect is more pronounced at elevated temperature than at lower temperature. Generally, increase in temperature changes the reaction rate. In the present study, not only the corroding rate of mild steel decreases but also the rate of synergistic effect between added metal cations and the AI gum increases. The results revealed that at high temperature synergistic effect predominates over dissolution of the mild steel. The increase in inhibition efficiency with increase in temperature is due to the specific interaction of mild steel surface with the inhibitors19. The increased inhibition efficiency with temperature was due to the change in the nature of adsorption mode, the inhibitor is being physically adsorbed at lower temperatures, while chemisorption is favored as temperature increases20. Thus, at high degree of surface coverage, the diffusion through the surface layer containing the inhibitor and corrosion products becomes the rate- determining step of the metal dissolution process21.
To determine the corrosion inhibition stability of optimum concentration of AI gum, mixture A and B, the variation of inhibition efficiency with various immersion periods (1, 2, 3, 4, 5, 6 and 24 h) in 1 mol L-1 HCl was studied at 303± 1 K. The calculated values of inhibition efficiency are given in Table 2.
Table2: Variation of inhibition efficiency with various immersion periods for mild steel in 1 mol L-1 HCl containing 0.06 g L-1AI gum, mixture A and B
| System | Inhibition efficiency (%) | |||||
| 1 h | 2 h | 3 h | 4 h | 6 h | 24 h | |
| AI gum | 73.5 | 71.5 | 60.2 | 54.7 | 48.2 | 46.2 |
| mixture A | 76.8 | 78.9 | 71.7 | 72.8 | 71.9 | 82.4 |
| mixture B | 81.2 | 74.3 | 76.4 | 74.5 | 79.2.2 | 83.2 |
It is found that the inhibition efficiency increase with increase in immersion time period for mixture A and B and this may be attributed to the formation of an insoluble protective film on the surface of the mild steel22. The possible mechanism of inhibition action of an inhibitor is the adsorption of inhibitor onto the metal surface which blocks the metal surface and this do not permit the corrosion process to take place. Thus, the mixture A and B are proven to be a promising inhibitor that can be used even at higher temperatures and for longer immersion period.
Corrosion kinetic parameters
In an acidic solution the corrosion rate is related to temperature by Arrhenius equation
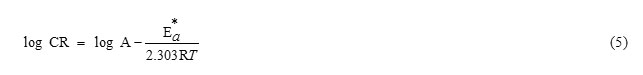
where, ‘CR’ is the corrosion rate determined from the weight loss measurement, is the apparent activation energy, ‘A’ the Arrhenius constant, ‘R’ the molar gas constant and T is the absolute temperature. The apparent activation energy is determined from the slopes of log (CR) versus 1/ T plot (Figure 2, 3) and their values are given in Table 3.
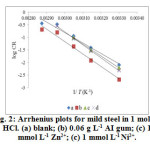 |
Figure2: Arrhenius plots for mild steel in 1 mol L-1 HCl. (a) blank; (b) 0.06 g L-1 AI gum; (c) 1 mmol L-1 Zn2+; (c) 1 mmol L-1 Ni2+. |
 |
Figure3: Arrhenius plots for mild steel in 1 mol L-1 HCl in the presence of: (a) mixture A;(b) mixture B. |
Table3: Corrosion kinetic parameters for mild steel in 1 mol L-1 HCl in absence and presence of inhibitors
| System | Ea*(kJ mol-1) |
ΔH(kJ mol-1)
Ea*-ΔH(kJ mol-1)
ΔS*(J mol-1 K-1)Blank79.176.52.6−32.00.06 g L-1 gum94.491.72.7 6.951 mmol L-1 Zn2+91.088.42.6 4.341 mmol L-1Ni2+98.896.22.6 27.8mixture A
45.342.62.7 −148.2mixture B
34.131.42.7 −184.7
It is seen that Ea* values obtained for AI gum and metal cations (individually) are higher than blank, indicating a strong inhibitive action of inhibitors by increasing energy barrier for the corrosion process, emphasizing the electrostatic interaction (physisorption) between the mild steel surface and the inhibitors. On contrary to this, lower values of Ea* obtained for the corrosive medium containing the mixture A and B attributes to chemisorption23. The decrease in Ea* at higher level of inhibition arises due to a shift of the net corrosion reaction from that on the uncovered surface to one involving the adsorbed sites directly24,25.
The change of enthalpy (ΔH*) and entropy (ΔS*) for the corrosion process in 1 mol L-1 HCl in the presence of AI gum, metal cations and mixture A, B were obtained by the equation (6)
where, h is Planck‘s constant, ‘N’ the Avogadro’s number, R is the universal gas constant, ‘T’ the absolute temperature. Figure 4 and 5 shows the plot of log (CR/ T) versus 1/ T, gives straight line with slope (−/ 2.303 R) and an intercept (log (R/ Nh) + ΔS* / 2.303 R), from which ΔH* and ΔS* are calculated and the values are included in Table 3. The enthalpy change of AI gum and metal cations (individually) are greater than the plain acid correspond to physisorption24. But in the case of mixture A and B, the values are lower than the blank, again supports chemical mode of adsorption.
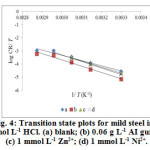 |
Figure4: Transition state plots for mild steel in 1 mol L-1 HCl. (a) blank; (b) 0.06 g L-1 AI gum; (c) 1 mmol L-1 Zn2+; (d) 1 mmol L-1 Ni2+. |
 |
Figure5: Transition state plots for mild steel in 1 mol L-1 HCl in the presence of: (a) mixture A; (b) mixture B. |
We also noted that Ea* and ΔH values vary in the same way for all the systems studied. From the kinetic studies, the unimolecular reactions are characterized by following equation
Ea* – ΔH*= RT (7)
The calculated values are too close to RT (2.67 kJ mol-1). This result shows that inhibitors acted equally on Ea* and ΔH* .
The positive values of ΔS* for the inhibited systems containing 0.06 g L-1 AI gum and metal cations (individually) shows that an increase in disordering takes place on going from reactant to the activated complex26. The behavior of individual inhibitors in the corrosive medium can be explained by the fact that on adding AI gum and metal cations individually to the aggressive medium, the inhibitor molecules move freely in the bulk solution, this results in increase in disorderliness of the system. The negative values of ΔS* for the mixture A and B imply that the activation complex in the rate determining step represents association meaning that a decrease in disordering takes place on going from reactants to the metal/solution interface24. This is the driving force for the adsorption of inhibitors onto the mild steel surface.
Synergism parameter
All the experimental results have suggested that the addition of metal cations to the AI gum increases the inhibition efficiency. The enhanced inhibition behavior is attributed to the synergism existing between the AI gum and metal cations. The extent of synergistic effect exhibited by the inhibitor mixture A and B has been analyzed by evaluating the synergism parameter (S1) obtained from the gravimetric measurements27.
where, ƞ1+2 = ƞ1 + ƞ2; ƞ1 = inhibition efficiency of AI gum; ƞ2 = inhibition efficiency of metal cations and ƞʹ = measured inhibition efficiency for the inhibitor mixture. The calculated values of S1 are included in Table 1. Analysis of Table 1 reveals that the S1 values are greater than unity suggesting the synergistic action of metal cations with AI gum. The observed synergistic effect exhibited by the inhibitor mixture A and B may be due to the co-adsorption of the AI gum and the metal cations on the mild steel surface in 1 mol L-1 HCl.
Adsorption considerations
It is very essential to define empirically which adsorption isotherm fits best to the surface coverage data in edict to calculate the thermodynamics parameters pertaining to inhibitor adsorption on the mild steel surface28. The adsorption provides information about the adsorbed molecules as well as their interaction with the metal surface. The surface coverage (θ) of the inhibitors at different concentrations is used to obtain the best adsorption isotherm. θ values have been calculated using the following relationship

Various adsorption isotherms like Langmuir, Freundlich, Temkin, El- Awady et al. were tested. The experimental data fit best for the Langmuir adsorption isotherm and it is given by the following equation

where, C is the concentration, θ is the degree of surface coverage and Kads is the equilibrium constant for the process of adsorption. Figure 6 represents the Langmuir adsorption isotherm for binary systems with slopes of unity. From the intercept of the straight lines, Kads values are obtained and their values are given in Table 4.
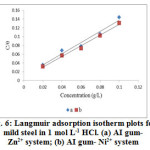 |
Figure6: Langmuir adsorption isotherm plots for mild steel in 1 mol L-1 HCl. (a) AI gum- Zn2+ system; (b) AI gum- Ni2+ system |
Table4: Adsorption parameters for mild steel in 1 mol L-1 HCl in the presence of various concentrations of AI gum with metal cations
| Binary Systems | R2 | Kads (M-1) | ΔG0ads (kJ mol-1) |
| AI gum- Zn2+ | 0.9684 | 101.0 | 22.1 |
| AI gum- Ni2+ | 0.9981 | 156.2 | 23.0 |
Large values of Kads indicate that there is a strong interaction between the phase boundaries of double layer and the adsorbed inhibitor mixtures, which results in better inhibition efficiency. The equilibrium constant of adsorption Kads is related to the standard free energy of adsorption (ΔG0ads) by:
The value 55.5 in the equation is the molar concentration of water molecules at electrode/electrolyte interface. The standard free energy of adsorption () can be calculated by using the above equation. The negative values of ensure the spontaneity of the adsorption process and stability of the adsorbed layer on the steel surface (Table 4). Generally, values of ∆Goads up to −20 kJ mol-1 are consistent with electrostatic interactions between the charged molecules and the metal (physisorption) while those around −40 kJ mol-1 or higher are associated with chemisorption as a result of sharing or transfer of electrons from organic molecules to the metal surface to form a coordinate type of bond. In the present work, the values of ∆Goads obtained are less positive than −40 kJ mol-1 and more negative than −20 kJ mol-1 clearly indicate that the adsorption process is not merely physisorption or chemisorption but obeying a comprehensive adsorption (physisorption and chemisorption).
Electrochemical measurements
Figure 7 shows the polarization curves for mild steel in 1 mol L-1 HCl with and without mixture A and B at 303 ± 1 K. The addition of mixtures into the acid solution affects both the anodic and cathodic curves to lower current densities, while corrosion potential (Ecorr) is only slightly shifted. This implies that mixture A and B functions as a mixed-type inhibitor. The cathodic and anodic current potential curves are extrapolated to obtain the values of corrosion current (Icorr) and corrosion potential (Ecorr). The electrochemical parameters Icorr, Ecorr, anodic and cathodic Tafel slopes (ba, bc) obtained from polarization data and listed in Table 5.
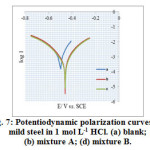 |
Figure7: Potentiodynamic polarization curves for mild steel in 1 mol L-1 HCl. (a) blank; (b) mixture A; (d) mixture B. |
Table5: Potentiodynamic polarization parameters for the corrosion inhibition of mild steel in 1 mol L-1 HCl containing mixture A and B
| System | Icorr |
(mA cm-2)
× 10-4Ecorr (mV/SCE)ba
(mV dec-1)bc
(mV dec-1)Inhibition efficiency
(%)Blank1.21− 0.4677.498.31-mixture A0.49− 0.4598.376.9258.6mixture B0.60− 0.4568.706.8449.7
It is evident from the table that Icorr decreases considerably, indicating an inhibiting effect of the AI gum with metal cations. Also, there is no pronounced change observed in the anodic and cathodic Tafel slopes, suggesting that the inhibitors adsorbs onto the mild steel surface and prevent it from corrosion by blocking the active sites without altering the anodic and cathodic reaction mechanism29. The observed inhibition efficiency values obtained are in good agreement with those determined from weight loss measurements.
Synergistic effects are also revealed in the impedance spectra obtained for mild steel in 1 mol L-1 HCl in the presence of mixture A and B at 303 ± 1 K. The impedance spectra of the Nyquist plot are shown in Figure 8. It describes a single, capacitive- like depressed semi-circle with their centres in the real axis and with their diameters increasing on the addition of mixture A and B to the corrosive medium. The single semicircle indicates that the corrosion process is charge transfer control from the mild steel to the corrosive medium through the electrochemical double layer. The real axis intercepts at high and low frequencies are bigger in the presence of mixture A and B, which means that the impedance of the mild steel in the inhibited solutions is greater than the uninhibited solution30.
EIS data can be calculated by using equivalent electric circuit model, which is depicted in Figure 9, which includes the solution resistance Rs and the double layer capacitance Cdl which is placed in parallel to the charge transfer resistance Rct. The Rct values were calculated from the difference in impedance at low and high frequencies31. The value of Rct is a measure of electron transfer across the surface and inversely proportional to corrosion rate. Double layer capacitance (Cdl) was obtained from the impedance measurements by using equation (12)
![]()
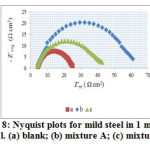 |
Figure8: Nyquist plots for mild steel in 1 mol L-1 HCl. (a) blank; (b) mixture A; (c) mixture B. |
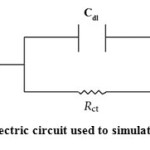 |
Figure9: Electric circuit used to simulate EIS data |
where, fmax is the frequency value at which the imaginary component of the impedance is maximum. The values of Rct, Cdl and inhibition efficiency for mild steel in 1 mol L-1 HCl for mixture A and B are given in Table 6.
Table6: Impedance parameters for mild steel in 1 mol L-1 HCl containing mixture A and B
| System | Rct (Ω cm-2) | Rs (Ω cm-2) | Cdl (µF cm-2) |
× 10-4Inhibition efficiency (%)Blank17.94.741.07-mixture A30.14.670.5241.0mixture B44.85.130.5860.1
It is important to note that by the addition of mixture A and B to the corrosive medium brings as increase in the Rct values and a decrease in Cdl values with increase in the percentage of inhibition efficiency. The decrease in Cdl values are due to the replacement of water molecules by the adsorption of inhibitor mixture, resulting in the formation of protective film on the mild steel surface and decrease the corrosion rate32.
FT-IR spectra
FT-IR spectrum of pure AI gum is shown in Figure 10 (a). The characteristic bands in the region between 3317 cm-1 – 3618 cm-1 are assigned to the – OH stretching vibration and another peak at 1658 cm-1 is due to bending mode of water molecules33. The – C=O stretching frequency is seen at 1705 cm-1. The asymmetric stretching vibration frequency of -COO– and – C-O stretching frequency34 are seen at 1550 cm-1 and 1080 cm-1 respectively. In the spectrum of mild steel in 1 mol L-1 HCl in the presence of AI gum (Figure 10 (b)), the intensity of – OH stretching frequency is shifted in the region between 3309 cm-1 – 3664 cm-1, the – C=O peak on contrary are seen to be shifted towards higher wave number (1743 cm-1). The peak for bending mode of H2O molecule is disappeared. The asymmetric stretching frequency of – COO– is shifted from 1550 cm-1 to 1535 cm-1. The above shifting in the characteristic peaks clearly indicates that the AI gum adsorbed on to the mild steel surface through lone pair of electrons of oxygen atom of – COO– ions.
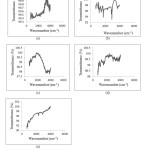 |
Figure10: FT- IR spectrum of: (a) Pure AI gum; (b) Mild steel specimen immersed in the presence of 0.06 g L-1 AI gum; (c) mixture A at 303± 1 K; (d) mixture B at 303 ± 1 K; (e) mixture B at 348± 1 K. |
Figure 10 (c) and (d) represents the FT-IR spectra of mild steel specimen immersed in 1 mol L-1 HCl at 303± 1 K in the presence of mixture A and B respectively. The – OH stretching frequency bands are shifted towards higher wave numbers in both the spectrum. The bending mode of H2O molecule is shifted towards lower frequency side of 1620 cm-1 and 1627 cm-1 in mixture A and B respectively. This clearly indicates that metal cations (Zn2+ and Ni2+) in corrosive medium, may reacts with – OH group of AI gum forming insoluble hydroxides, protecting the mild steel surface from the corrosive attack. In addition to that the asymmetric stretching frequency of – COO– anions is shifted towards lower side of 1512 cm-1 for mixture A and 1519 cm-1 for mixture B. This lower side shifting shows that the – COO– anions of AI gum makes possible its adsorption by co-ordinate type linkage through transfer of lone pairs of electron of oxygen atoms to the metal cations (Zn2+ and Ni2+), giving a stable chelate. The simultaneous interaction of metal cations with AI gum, make it horizontally oriented at the mild steel surface, which led to increase the surface coverage, resulting in increase in the inhibition efficiency.
To verify the stability of the protective layer formed by AI gum- metal cations at higher temperatures, FT-IR spectrum of mild steel in 1 mol L-1 HCl in the presence of mixture B at 348± 1 K was recorded (Figure 10(e)). On comparing this spectrum with Figure 10 (d), the characteristic stretching frequency of bending mode of water molecules doesn’t experiences a change when temperature increases. The – COO– anions peak is shifted towards lower side of 1504 cm-1.It indicates that at higher temperatures more Ni2+ cations co-ordinated with – COO– anions of AI gum, makes the protective film more stronger.
Thus, it is evident from FT- IR studies that the protective film formed on the mild steel surface did not show any significant change during higher temperature (348 ± 1 K), forms a evidence for a distinctive comprehensive adsorption mechanism followed by mixture A and B.
Conclusion
Synergistic effect between AI gum and metal cations have been observed from the weight loss measurements and acting as an effective inhibitor for the corrosion of mild steel in 1 mol L-1 HCl. The synergistic influence of Ni2+ cation in AI gum is more pronounced than Zn2+ ion. Increase in temperature causes increase in inhibition efficiency for both the mixture. Additionally, the decrease in apparent activation energy in the mixture A and B supports the chemical mode of adsorption of inhibitors on the mild steel surface. It obeys Langmuir adsorption isotherm. According to the values, spontaneous and comprehensive adsorption of inhibitor mixtures is suggested to occur on the mild steel surface. A mixed- inhibition mechanism is proposed from the potentiodymanic polarization studies. It can also be concluded from FT-IR studies, the metal cations are preferentially adsorbed on the mild steel surface by columbic attraction where – COO– anions of the AI gum is already chemisorbed and suppresses the corrosion rate by the stabilization of adsorbed anion and by increase in inhibition efficiency
References
- Banerjee, S.; Srivastava, V.; Singh, M. M. Corros. Sci. 2012, 59, 35–41.
- Guo, W.; Chen, S.; Feng, Y.; Yang, C. J. Phys. Chem. C. 2007, 111, 3109–3115.
- Zaafarany, I. A. Int. J. Electrochem. Sci. 2013, 8, 9531- 9542.
- Singh, M. M.; Rastogi, R. B.; Upadhyay, B. N.; Yadav, M. Ind. J. Chem. Tech. 2003, 10, 414.
- Ashassi- Sorkhabi, H.; Seifzadeh, D.; Hassanein, M. G. Corros. Sci. 2008, 50, 3363-3370.
- Shaju, K.S.; Joby thomas, K.; Raphael. V.P. Orient J Chem.2014, 30, 807-813
- Oguzie, E. E.; Wang, S. G.; Li, Y.; Wang, F. H. J. Phys. Chem. C. 2009, 113, 8420.
- Al-Sahlanee, H.H.; Sultan, A.A. Aqua. Sci. Tech. 2013, 1, 135-151.
- Abiola,O.K.; James, A.O. Corros. Sci. 2010, 52, 661-664.
- Al-Mhyawi. S.R. Orient J Chem.2014, 30, 541-552.
- Satapathy, A.K.; Gunasekaran, G.; Sahoo, S.C.; Amit, K.; Rodrigues, P. V. Corros. Sci. 2009, 51, 2848-2856.
- Zaafarany, I. Port. Electrochim. Acta. 2012, 30, 419-426.
- Abdallah, M. Port. Electrochim. Acta. 2004, 22, 161-175.
- Umoren, S.A.; Obot, I.B.; Ebenso, E.E.; Obi-Egbedi, N.O. Int. J. Electrochem. Sci. 2008, 3, 1029-1043.
- Umoren, S.A.; Ebenso, E.E. Mater. Chem. Phy. 2007, 106, 387-393.
- Mukerjee, S.; Srivastava, H.C. J. Am. Chem. Soc. 1955, 77, 422-423.
- ASTM practice standard G-31 “Standard practice for laboratory immersion corrosion testing of metals”, ASTM International, 2004.
- McCafferty, E. Corros. Sci. 2005, 47, 3202-3215.
- Ammar, I.A.; El Khorafi, F.M. Werkst. Korros. 1973, 24, 702-707.
- Ivanov ES. Inhibitors for Metal Corrosion in Acidic Media. Metallurgy, Moscow; 1986.
- Bouklah, M. Hammouti, B.; Lagrenee, M.; Bentiss, F. Corros. Sci. 2006, 48, 2831-2842.
- Granese, S.L.; Rosales, B.M.; Ociede, C.; Zerbino, J.O. Corros. Sci. 1992, 33, 1439-1453.
- Umoren, S.A.; Solomon, M.M.; Udosoro, I.I.; Udoh, A.P. Cellulose. 2010, 17, 635-648.
- Riggs, O.L.; Hurd, R.M. Corrosion. 1967, 23, 252-258.
- Ehteram, A. Noor.; Aisha H. Al-Moubaraki. Mater. Chem. Phys. 2008, 110, 145-154.
- Mingcan, C.; Min, J.; Sang‐Hyun, C.; Jeehyeong, K. Environment. Tech. 2010, 31, 1203-1211.
- Aramaki, K.; Hackerman, N. J. Electrochem. Soc. 1969, 116, 568-574.
- Obi-Egbedi, N.O.; Essien, K.E.; Obot, I.B. J. Comput. Method. Mol. Design. 2011, 1, 26-43.
- Helal , N.H. J. Chem. Engg. Mater. Sci. 2011, 2, 28-38.
- Valle- Quintana, J.C.; Dominguez-Patino, G.F.; Gonzalez- Rodriguez, J.G. Int. J. Corros. 2014, Article ID 945645, 8 pages.
- Amin, M.A.; Khaled, K.F.; Fadl- Allah, S.A. Corros. Sci. 2010, 52, 140-151.
- Elewady, G.Y. Int . J. Electrochem. Sci. 2008, 3, 1149-1161.
- Andreeva, D.V.; Skorb, E.V.; Shchukin, D.G. App. Mater. Interfaces. 2010, 2, 1954.
- Silverstein RM, Bassler GC, Morill TC. Spectrometric identification of organic compounds. Wiley: New York, USA, (1978).


![]()


