Structural and Optical Properties of Chemically Synthesized ZnS Nanoparticals
DOI : http://dx.doi.org/10.13005/ojc/290341
Download this article as:
![]()
Different samples of ZnS nanoparticals were synthesized by chemical co-precipitation method at room temperature using zincsulphate as zinc source and sodium sulphide as sulphur source. Structural properties of synthesized ZnS nanoparticles were studied by X-ray diffraction pattern (XRD) while optical properties were examined by UV-Visible absorption spectroscopy. XRD pattern showed the as synthesized ZnS nanoparticles have cubic zinc blended structure with 2.0-2.87 nm average crystallite size and lattice constant a=5.829 Ao. UV-Visible absorption spectrum showed the band gap energy of the ZnS nanoparticals corresponding to absorption edge are found in the range of 2.63eV-3.87eV, which shows increase in band gap with the decrease of crystallite size of the nanoparticles.
KEYWORDS:ZnS nanoparticals;co-precipitation,;XRD;UV-Vis spectrum;Band gap
INTRODUCTION
Nanoparticles having typical dimensions of 1-10 nm have attracted great interest in the past decade as well as in recent years because of their unique chemical, physical, electronic , optical and transport properties which are drastically different from those of either the bulk materials or single atoms.1,2 Since novel properties of nanomaterials depend on their size, structure and shape,
a new direction for synthetic methods and an understanding of the mechanisms by which the size, structure and shape of the nanocrystals can be easily varied are key issues in nanoscience3. Binary chalcogenide nanocrystalline semiconductors such as ZnS, ZnSe, CdSe and CdS attracted considerable attention in recent years due to their unique properties, which arise due to size quantization. Among them, zinc sulfide (ZnS) is one of the most important group II–VI semiconductor having a typical band gap (Eg = 3.42 eV(515 nm) at room temperature with many excellent physical and chemical properties, which has promising applications in multiple technical fields including photochemical catalysis, gas sensor, detectors for laser and infrared, solar cells, nonlinear optical materials, various luminescence devices, optoelectronic devices, biological labels, waveguides, and photoconductors etc4-9 . ZnS can be obtained in thin film form, or in powder by using different solvents such as water, methanol, dimethyl formamide, dimethyl sulphoxide etc10,11. In last decades, efforts have been devoted to the preparation of high – quality ZnS nanoparticals and the investigation of optical properties12. In present work, ZnS nanoparticles were prepared by a chemical co-precipitation method without using capping agent. Structural properties have been studied by X-raydiffraction and the energy band gap values were calculated by using the UV-visible spectrophotometry.
EXPERIMENTAL
All the chemicals were purchased from analytical grade and used without further purification. Double distilled water was used as a solvent in all the experiments. In the present work, different sized ZnS nanoparticles have been prepared by chemical co-precipitation method at room temperature13. ZnS nanoparticles have been prepared with different molar concentration using zinc sulphate (ZnSO4.5H2O), and sodium sulphide (Na2S.7H2O) as source materials without using capping ligand. For synthesis, the Zinc sulphate and sodium sulphide were taken in different molar concentration. Zinc sulphate (1.0M) and sodium sulphide (1.0M) were dissolved in 100 ml double distilled water separately and so obtained molar solution were stirred continuously for 20 minutes. while stirring Zinc sulphate 1.0M solution of 100 ml was mixed drop by drop in 100 ml 1.0 M solution of Zinc sulphate. The white precipitate of the ZnS nanoparticles were formed slowly in the solution. The obtained precipitate was then filtered washed and dried at room temperature. After sufficient drying, the precipitate was crushed to fine powder with the help of mortar and pestle. Four different samples ZnS-I ,ZnS-II, ZnS-III and ZnS-IV were prepared by changing the molar concentration as 0.4M, 0.6M, 0.8M, and 1.0M.
RESULTS AND DISCUSSION
Structural properties
X-ray powder diffractions (XRD) were performed at room temperature on a Miniplex-ii X-ray diffractometer using monochromatic Cu Ka1 radiation with λ=1.540562 Ao operated at 40 kV and 40 mA with 2q ranging from 10o to 80o at the speed of 2o min-1. The diffraction pattern obtained of ZnS nanoparticles were prepared with different molar concentration of parent solution. Different sizes of nanoparticles have been prepared by changing the molar concentration of the parent samples as 0.4 M, 0.6 M, 0.8 M and 1.0 M of ZnS-I , ZnS-II, ZnS-III and ZnS-IV, respectively. From Fig.(1), XRD patterns obtained in all samples shows three peaks, which shows that the samples have cubic zinc blended structure and the peaks correspond to diffraction at (111), (220) and (311) planes respectively. The lattice parameter has been computed as 5.82 Ao, which is very close to the standard value (5.83 (Ao). It is also seen that peaks are broadened for higher concentration of parent solution of ZnS sample. The peak broadening at lower angle is more meaningful for the calculation of particle size, therefore size of nanocrystals has been calculated using Debye-Scherrer formula14 given as
Where D is the crystallite size, K is constant, λ is the wavelength of x-rays, β is the full width at half maximum (FWHM) after correcting the instrument peak broadening (β expressed in radians), θ is the Bragg’s angle.
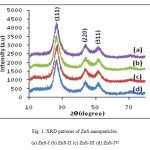 |
Fig. 1. XRD patterns of ZnS nanoparticles. Click here to View figure |
OPTICAL ABSORPTION
UV-Visible absorption spectroscopy is an efficient technique to monitor the optical properties of nano sized particles. The optical absorption spectra of the nanocrystallities were measured using double beam automated UV-Vis spectrophotometer, and absorption spectra have been recorded at room temperature over the range 450 to 550 nm. The most dramatic property of semiconductor nanocrystals, the band gap energy were determined from the optical absorption spectra. The study of optical absorption is important to understand the behavior of semiconductor nanocrystals. A fundamental property of semiconductors is the band gap, the energy separation between the filled valence band and the empty conduction band. Optical excitation of electrons across the band gap is strongly allowed, producing an abrupt increase in absorption at the wavelength corresponding to the band gap energy. This feature in the optical spectrum is known as the optical absorption edge. Fig (2) shows the optical absorption spectra of Zns nanoparticales in the range of 450 to 550 nm . It can be seen that the absorption occurs in visible region, at 486 nm, 484nm, 478nm, 471nm, for ZnS-I , ZnS-II, ZnS-III and ZnS-IV samples respectively. This clearly shows that the absorption edge shifts towards shorter wavelength as the molar concentration is increases. The observed blue shift in the absorption edge is reflection of band gap increase owing to quantum confinement effect.
The energy band gap of material is calculated using the Tauc relation15. The relation between the absorption coefficient (a) and the incident photon energy (hn) can be written as
(αhν)=A ( hν- Eg )n
Where, A is a constant, Eg is the band gap of the material and exponent n depend on the type of transition. Here, the transition are direct so we take n=1/2. The value of optical band gap is calculated by extrapolating the straight line portion of (ahn)2 vs hn graph (fig. 3.) to hn axis at a=0.. The obtained band gap values for different samples are 2.63, 2.79, 2.81, 2.87 eV respectively.
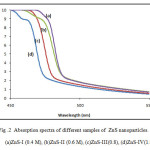 |
Fig .2 Absorption spectra of different samples of ZnS nanoparticles. Click here to View figure |
CONCLUSION
The ZnS nanoparticles were successfully synthesized through chemical co-precipitation method and X-ray diffraction was employed to study the structural properties, the particle sizes calculated were have zinc blended structure, from optical absorption measurement it is found that as molar concentration varies from 0.4 M to 1.0 M the band gap increases while the wavelength of absorption onset shifts to shorter wavelength. Therefore, the onset wavelength is directly related to nanoparticle size. Chemical reaction rates directly affects the time evolution of the no of nuclei, which determines both nucleation and growth process, nucleation and growth takes place simultaneously. This overlapping of nucleation and growth process, which is more pronounced as the chemical reaction is slower leads to larger nanoparticle size. Rate of reaction depends on the molar concentration of reactants solution and increases with the increase in molar concentration of reactants solution. In the present study,the molar concentration of reactants solution varies from 0.4 M to 1.0 M, the reaction rate is highest for 1 M solution and hence the particle size obtained smallest for 1 M solution as compare to other material in the series, which is in accordance with the above Made argument.
ACKNOWLEDGMENTS
The author is thankful to the Director, Government Institute of Forensic Science Aurangabad, for providing necessary facilities.
References
- Dong, W. and Zhu, C., Opt. Mater., 22, 227 (2003)
- Yoffe, A. D., Adv. Phys., 42, 173 (1993)
- Young-wook Jun, Sang-Min Lee and Jinwoo Cheon., J. Am. Chem. Soc. 123, 5150 (2001)
- Yang, Y., Chen, H. and Bao, X., J. Cryst. Grow., 252, 251(2003)
- Wang, Q., Xu, G., and Han, G., J. Solid State Chem., 178, 2680 (2005)
- Nie, Q., Yuan, Q., and Chen, W., J. Crystal. Growth., 265, 420 (2004)
- Romano, R., and Alves, O. L., Mater. Res. Bull., 41, 376 (2006)
- Morales-Acevedo, A., Solar Energy Materials and Solar Cells., 90, 2213 (2006)
- Wang, Y., To, C.Y., and Ng, D. H., Mater. Lett., 60, 1151(2006)
- Jianga, G., Li, L., Penga, H., and Zhanga, B., Mater. Lett., 62, 1881(2008)
- Prabahar, S., Suryanarayanan, N., Kathirvel, D., Chalcogenide Letters., 6, 577 (2009)
- Murugadoss, G., Rajamannan, B., and Ramasamy, V., J. of Luminescence., 130, 2032 (2010)
- Herron, Wang, Y., and Eskert., J. Am. Chem. Soc., 112, 1322 (1990)
- K. H. P. and L. EA, X-Ray Diffraction Procedures, New York :Wiley, PP., 656, 1974.
- Shrarma, T. P., patidar, D., Saxena, N. S., and Sharma, K., Indian J. Pure and Applied Phys., 44, 125 (2006)

![]()


