Eco-energy Adsorbent Based on Agricultural Residues of Cotton Capsules for the Removal of Synthetic Dyes
 , Kouassi N’guessan Louis Bérenger1, Djè Daniel Yannick2, Kouassi Kouadio Dobi-Brice2, Silué Sohtcha Fébé1, Ekou Lynda2
1Department of Mathematics, Physics, and Chemistry (MPC), University Peleforo GON COULIBALY, B.P. 1328 Korhogo, Côte d'Ivoire.
2Laboratory of Thermodynamics and Physical Chemistry of the Environment, University NANGUI ABROGOUA, 02 BP 802 Abidjan 02, Côte d'Ivoire.
Corresponding Author E-mail:zoungranan@gmail.com
DOI : http://dx.doi.org/10.13005/ojc/410232
Download this article as:
![]()
To produce a low-energy yet effective adsorbent for reducing the amounts of violet crystal in contaminated waters, adsorbent (OPCC) was synthesized using chemically treating cotton capsule powder with hydrogen peroxide (H2O2). Another adsorbent, activated cotton capsule carbon (ACCC), was obtained through calcination and chemical activation. Both materials were characterized for FTIR analysis. Crystal violet removal by OPCC is comparable to that of ACCC. The equilibrium time for the adsorption of crystal violet by OPCC is 90 minutes, while for ACCC, it is 120 minutes. Both adsorptions follow pseudo-second-order kinetics and adhere to the Freundlich model, which translates a chemisorption process. The standard enthalpies (ΔH°) of -25.075 kJ/mol for OPCC and 29.024 kJ/mol for ACCC suggest exothermic and endothermic chemisorption, respectively. The study demonstrates that it is possible to synthesize an OPCC-type adsorbent material using agricultural cotton waste, achieving a crystal violet removal capacity comparable to that of ACCC, which requires more energy for its synthesis.
KEYWORDS:Adsorption; Adsorption isotherms; Crystal violet; Cotton capsules
Introduction
Population growth and industrialization are the main driving forces behind the pollution of the environment by a wide range of pollutants. Many organic compounds, including industrial dyes, are discharged daily through various channels of industrial and domestic activities. Synthetic industrial dyes are poorly biodegradable1 and contribute significantly to water pollution. The byproducts of their inadequate degradation are sometimes carcinogenic 2, teratogenic, and mitogenic 3, posing a threat to aquatic life and potentially disrupting photosynthetic activity by reducing light penetration into the water 4. Crystal violet is a basic azine dye from the triphenylmethane family, widely used in the paint and printing industries, as well as to dye polyacrylonitrile-modified nylon and wool. Additionally, it is employed to color plastics, petroleum, varnishes, fats, oils, and waxes 5. Crystal violet is also used in the medical field as a biological marker and as a dermatological agent 6. Despite its widespread use, violet crystal is harmful and even suspected of being carcinogenic 5. Even small amounts of the dye can cause respiratory issues, kidney failure, and permanent blindness. It has been shown to be teratogenic and mutagenic, and as such, is classified as a biological hazard 7,8.
Treatments for removing dyes from contaminated water include advanced oxidation 2, membrane filtration 9, chemical precipitation 10, ion exchange 11, coagulation-flocculation 12, catalysis 13, and adsorption 14–16. In this study, mainly due to its efficiency, ease of implementation and low cost, adsorption is preferred over other dye treatment methods. Many materials have been tested as adsorbents in various adsorption studies17,18. However, recent research has shifted towards finding potential adsorbents that are energy-efficient and more environmentally friendly19. Adsorbents derived from agricultural waste has proven to be both highly effective and environmentally sustainable. Several studies 20–24 have been carried out using agricultural waste as a raw material to produce adsorbents. Despite their abundant availability, little research has focused on the use of post-harvest cotton capsules as adsorbent materials. In Côte d’Ivoire, cotton (Gossypium hirsutum) is grown as a cash crop in the northern and central regions 25. In these northern regions, cotton farming is the primary source of income and employment 26, with the development of various industrial units based on seed cotton ginning, spinning, and oil production. In cotton farming practices, after the seed cotton is harvested, the plant and its capsules are left in the field until the next growing season, when they are weeded and subsequently burned.
The aim of this study is to remove crystal violet through adsorption using an energy-efficient adsorbent derived from the oxidative chemical treatment of cotton capsule powder. The goal is to develop an adsorbent that is as effective as activated carbon produced from similar cotton capsules. To achieve this, two cotton capsule-based materials will be synthesized, and their performance in crystal violet adsorption will be evaluated. The materials will be characterized and used as adsorbents in the treatment of water contaminated with crystal violet dye. In addition, the effects of various physicochemical parameters will be investigated.
Materials and Methods
Cotton Capsules Collection
Dry capsules of the cotton plant (Gossypium hirsutum) consist of 3 to 5 carpels and are borne on the fruiting branches of the plant. For this study, a post-harvest stock of 10 kg of cotton capsules was collected in Lamekaha, a village in the sub-prefecture of Tioroniaradougou, located a few kilometers from the city of Korhogo in Côte d’Ivoire.
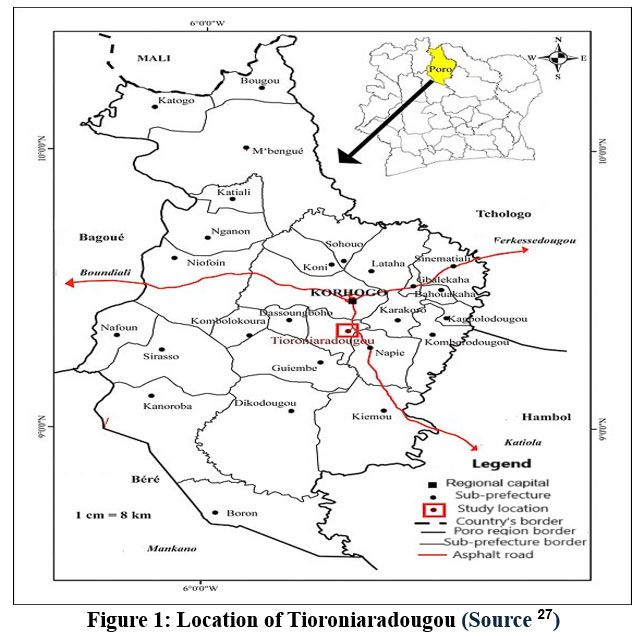 |
Figure 1: Location of Tioroniaradougou (Source 27) |
In the field, the capsules were collected from the stalks left after the seed cotton had been harvested. After being manually removed, they were stored in a plant fiber bag for the duration of the study.
Adsorbents Production
The collected capsules were carefully sorted to remove any impurities, then thoroughly washed and dried for 48 hours at room temperature. Two equal portions of the dried capsules, designated as stocks A and B, were prepared to produce two types of adsorbents: Oxidized Powder from Cotton Capsules (OPCC) and Activated Carbon from Cotton Capsules (ACCC).
To produce OPCC, 250 g of capsules from stock A were ground using a laboratory grinder (Silver Crest, France). The material was then washed with distilled water using a soak-decant-filtration cycle and dried in an oven (Memmert BM300, Germany) at 105°C for 48 hours. 200 g of the dried powder was placed in a 1 L crystallizer. A volume of 50 mL of 0.01 M sulfuric acid (H2SO4) is added, and the mixture is homogenized. Then, 600 mL of 0.5 M hydrogen peroxide (H2O2) is added, and the mixture is kept away from light for 24 hours. The mixture was then filtered, and the filtrate was washed until a neutral pH was achieved. The material was subsequently dried in an oven at 105°C for 24 hours. The resulting material was sieved using a sieve (Saulas, Paris, France) to retain particles smaller than 250 µm in diameter. This final powder is the OPCC adsorbent used in this study (Fig. 2).
For the ACCC, 100 g of capsule stock B was calcined in a muffle furnace (Nabertherm GmbH, Germany) at 600 °C for 1 hour. The resulting charcoal was ground in a porcelain mortar. The charcoal was then chemically activated. 250 g of charcoal was introduced in a crystallizer and impregnated with 500 mL of 1 M potassium hydroxide (KOH) solution. Then, the impregnated material was dried at 105°C for 24 hours. The material was then placed in a muffle furnace and calcined at 650°C for 1 hour. After calcination, activated material was sieved (retaining particles with a diameter less than 250 µm) and thoroughly washed to achieve a neutral pH. The washed material was then dried at 105°C during 24 hours to obtain cotton capsules activated carbon (ACCC) (Fig. 2).
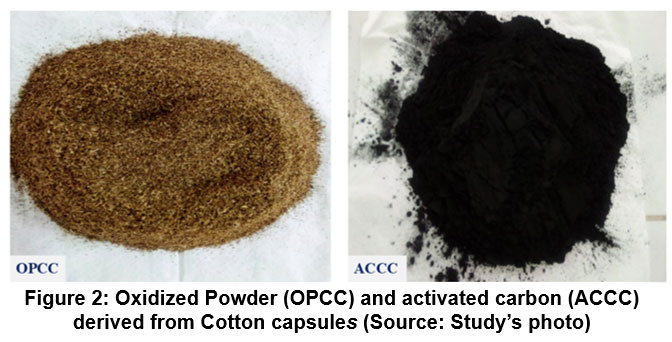 |
Figure 2: Oxidized Powder (OPCC) and activated carbon (ACCC) derived from Cotton capsules (Source: Study’s photo) |
 
Characterisation tests
Moisture Content
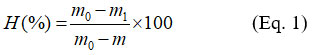
The adsorbent (POCC or ACCC) was placed in a ceramic crucible with an initial mass, m. The total crucible and adsorbent mass (m0) were measured, and then the assembly was dried in an oven at 105 °C for 24 hours. After drying and cooling, the assembly was weighed. The obtained mass is recorded as m1. The moisture content of adsorbent (H%) is then determined using the following formula:
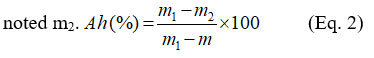
Ash rate
The ash rate was determined after moisture determination experiment. The crucible containing the dried adsorbent, with assembly mass m1, was calcinated in a muffle furnace at 550°C for 4 hours. After calcination and cooling, the assembly was weighed, and its mass was noted m2.
Iodine Value
A quantity of 0.05 g of adsorbent was placed in a beaker, and then 15 mL of 0.1 M iodine solution was added. After filtration, 10 ml of the solution was titrated with 0.1 M sodium thiosulphate. Starch was used as a color indicator. A blank test was also conducted under the same conditions, but without the adsorbent. The iodine value (Id), was determined using the following equation:
With
V0 : Volume of thiosulphate for the blank test
V : Volume of thiosulphate for the sample with adsorbent
m : Mass of adsorbent
Point of Zero Charge pH
The zero charge point (pHpzc) corresponds to the pH at which the resulting adsorbent surface charge is zero. A 50 mL solution of 0.1 M sodium chloride (NaCl) is placed in a beaker, and the pH is adjusted to the required value with drops of sodium hydroxide (NaOH) or hydrochloric acid (HCl). A total of seven solutions were adjusted to pH values of 3, 4, 5, 6, 7, 8, and 10. For a given beaker, a 0.5 g sample of adsorbent was added and the mixture stirred for 48 hours. After stirring and filtration, the final pH (pHf) is measured. The pHpzc was determined by plotting the difference (pHf – pHi) as a function of the initial pH (pHi). The intersection of the pHf-PHi = f(pHi) curve with the x-axis is the pHpzc.
FTIR Analysis
The functional groups present on the surface of the adsorbents were determined by infrared analysis using a spectrophotometer (Agilent Cary 630 FTIR, Santa Clara, California, USA) equipped with the ART module.
Batch tests
General Methodology
To conduct the various adsorption experiments, 500 mL of a 1000 mg/L stock solution of crystal violet (CV) was prepared. The resulting solution was homogenized and stored in the dark. The required working solutions for the different tests were prepared by diluting the stock solution. For each test, a mass m of POCC or CACC was added to 50 mL of crystal violet solution at an initial concentration Cᵢ. The assembly is stirred at 50 rpm for a given time t using an orbital shaker (Innova 2300, Germany). After stirring and gravity filtration, the absorbance of the filtrates was measured at 582 nm using a Jenway 6850 UV/VIS spectrophotometer. The initial concentration Ci and the final concentration Cf were determined using a calibration curve prepared with the crystal violet solution in doubly distilled water. The concentrations Ci and Cf were obtained from the calibration curve constructed using the 99.99% purity crystal violet solution. The adsorption capacity (q) of a mass m of adsorbent was determined using Eq.4.
Assessment of the Influence of Physicochemical Parameters
Adsorbent Masse
For this test, eight beakers were used for each adsorbent. To each beaker, 50 mL of a crystal violet solution with an initial concentration of Cᵢ = 10 mg/L was added. Different amounts of adsorbent, ranging from 0.1 g to 0.8 g in 0.1 g increments, were added separately to each beaker. The beakers were tightly sealed and stirred for 3 hours. After stirring and gravity filtration, the absorbance values of the filtrates have been read.
Initial pH of Solution
Eight beakers, each containing 50 ml of crystal violet at Cᵢ = 10 mg/L, were used for each adsorbent. The pH was adjusted to values of 3, 4, 5, 6, 9, 10, 11, and 12 by adding a few drops of sodium hydroxide (NaOH) or concentrated hydrochloric acid (HCl). For each beaker, 0.3 g of adsorbent is added, and the mixture is stirred for 3 hours. After stirring and gravity filtration, the absorbance values of the filtrates have been read using the Jenway 6850 UV/VIS spectrophotometer.
Temperature Effect
Temperature influence tests were conducted sequentially at 25°C, 30°C, 40°C, and 50°C. In each beaker, 50 mL of crystal violet solution with a concentration of Ci = 10 mg/L was added. In each beaker, 50 mL of crystal violet solution at Ci= 10 mg/L was added. A mass of 0.3 g of adsorbent was added to the crystal violet solution, and the mixture was heated in a water bath. For each temperature setting, the mixture was stirred manually for 15, 30, 45, and 60 minutes. After stirring and gravity filtration, the absorbance values of the filtrates have been read using the Jenway 6850 UV/VIS spectrophotometer.
Initial Solution Concentration and Contact Time
Tests on the influence of contact time and initial concentration were conducted simultaneously. For each time interval, ranging from 10, 30, 60, 75, 90, 120, 150, to 180 minutes, eight beakers were used for each adsorbent. Each beaker contained 50 mL of crystal violet solution at concentrations of 10, 20, 40, 50, 70, 80, 90, and 100 mg/L. After adding 0.3 g of adsorbent to each beaker, the beakers were tightly sealed and agitated for the specified contact time.
Theoretical Approach
Kinetic aspect
Kinetic models help in understanding the processes that control the rate of adsorption. The pseudo-first and pseudo-second order kinetic models were applied to the experimental data obtained from the contact time experiments. In its linear form, the pseudo-first order model is represented by the following equation
Where:
qe (mg/g) is the adsorption capacity at equilibrium time te
qt (mg/g) is the adsorption capacity at time t
k1 (min-1) is the rate constant of the reaction.
The pseudo-second order model is represented in its linear form by the following expression
Where:
qe (mg/g) is the adsorption capacity at equilibrium time te
qt (mg/g) is the adsorption capacity at time t
k1 (g mg-1 min-1) is the rate constant of the reaction.
Adsorption Isotherms
The characterization of adsorption surface properties and the prediction of the nature of the adsorption reaction are carried out using isotherm models relative to the adsorption equilibrium. The Langmuir model assumes a single adsorption layer on a surface with a finite number of sites with identical adsorption energies. The linear form of the Langmuir equation is written as follows:
Where
?? (mg/L) is the solution concentration at equilibrium.
qe (mg/g) is the amount of crystal violet adsorbed at equilibrium.
qm is the maximum adsorbed dye capacity.
?? is the Langmuir constant.
The Langmuir separation factor ?? and is used to evaluate the affinity of the adsorbate for the adsorbent. It is given by the equation:
If:
?? > 1, adsorption is unfavourable,
?? = 1, adsorption is linear
?? = 0. adsorption is reversible
0 < ?? < 1 adsorption is favourable
Multi-layer adsorption on a heterogeneous surface can be described by the Freundlich isotherm. The Freundlich isotherm, in its linearized form, is expressed by the following equation:
Where:
?F (L/mg) is the Freundlich constant related to the adsorption capacity
1/? (L/g) is the adsorption intensity.
Thermodynamic Parameters
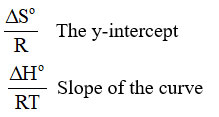
The adsorption phenomenon is accompanied by a thermal effect, which can be either exothermic or endothermic. Thermodynamic quantities (ΔG°, ΔH° and ΔS°) make it possible to predict the spontaneity of an adsorption process and to evaluate its thermal effect. The following equations are used to determine these thermodynamic quantities:
Where
R: Ideal gas constant (8.314 Joule.mole-1 K-1).
T: Absolute temperature of the isotherm (K).
ΔH°: Enthalpy change of adsorption (Joule.mol-1).
ΔS°: variation of the entropy (Joule.mole-1 K-1)
![]()
Kd the distribution coefficient of the solute in the adsorbent is given by
Where:
qe (mg/g) is the amount of crystal violet adsorbed at equilibrium
Ce (mg/L) is the equilibrium concentration of the adsorbate in solution
Plotting the curve makes it possible to calculate the thermodynamic parameters:
Data Processing
All calculations were performed using Microsoft Office Excel 2016 Professional. Means and standard deviations were calculated from three individual measurements.
Results
Characterization
The results of the physicochemical characterization of OPCC and ACCC are presented in Table 1.
Table 1: Some characteristics of the adsorbents
| Moisture content H (%) | Ash rate Ah (%) | Density (g/cm3) | pHpzc | Iodine index Id | |
| OPCC | 13.11 | 5.65 | 0.27 | 7.71 | 194.58 |
| ACCC | 9.24 | 4.94 | 0.32 | 8.21 | 338.4 |
The OPCC has an ash rate of 5.65%, while the ACCC has an ash rate of 4.94%, both of which are relatively low. The ACCC exhibits a higher density of 0.32 g/cm³, indicating a greater amount of material in a given volume compared to the OPCC. The results of the pHpzc determination are shown in Fig. 3. The pHpzc of OPCC is lower than that of ACCC. Additionally, the higher iodine index of ACCC compared to OPCC indicates that ACCC has a more microporous structure.
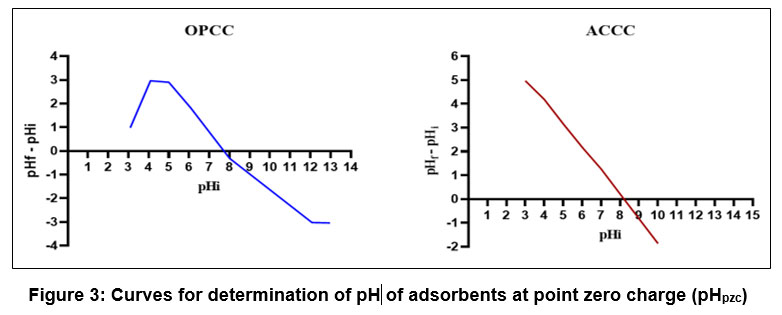 |
Figure 3: Curves for determination of pH of adsorbents at point zero charge (pHpzc). |
FTIR results are shown in Fig. 4. The spectra obtained show several distinct absorption bands.
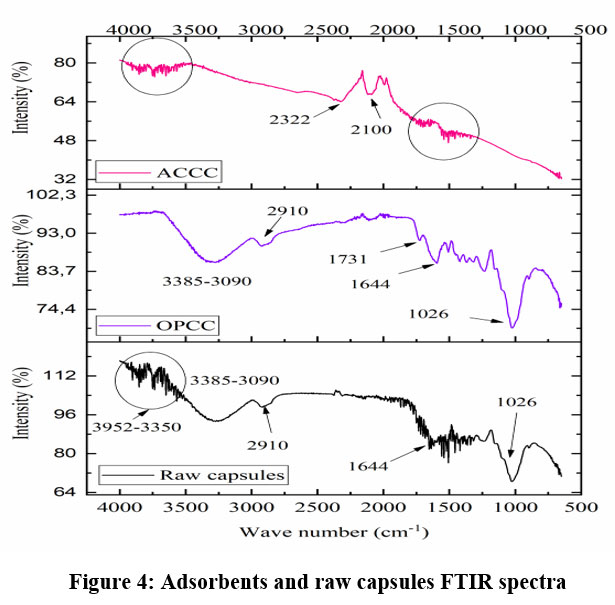 |
Figure 4: Adsorbents and raw capsules FTIR spectra |
For OPCC, there is a grouping of bands between 3952 and 3350 cm-1, corresponding to the O-H groups of various pigments. A band between 3385 cm-1and 3090 cm-1 corresponds to the stretching of the hydrogen bond of the OH groups in the carboxyl groups of polyphenols and alcohols. This band may also be attributed to the OH stretching of the cellulose present in the plant powder. At 2910 cm-1, a weak adsorption band is observed, linked to the C-H stretching vibrations of aliphatic molecules. At 1644 cm-1, a peak is seen, associated with the vibration of C=C double bonds in aromatic structures and unsaturated groups. At 1026 cm-1, there is a peak corresponding to the C-O vibration of ethers and alcohols. The OPCC spectrum shows a disappearance of the peaks observed in the raw capsules between 3952 cm-1and 3350 cm⁻¹. At 1644 cm-1, the peak also disappears, and the peak corresponding to C=C vibration intensifies. Additionally, a weak absorption at 1731 cm-1 is observed, which corresponds to the vibration of free C=O groups, typical of carboxylic acids, formed after oxidation. Therefore, the raw capsules were successfully oxidized by hydrogen peroxide, leading to the modification of hydroxyl groups into carbonyl and/or carboxyl groups. The FTIR spectrum of ACCC shows a decrease in the number and intensity of the peaks between 3952 cm-1 and 3350 cm⁻¹ compared to the raw capsules. A weak absorption appears at 2322 cm⁻¹, corresponding to the C≡N triple bond vibration of nitriles. At 2100 cm-1, a medium peak appears, which is the stretching vibration of the C≡C triple bond.
Effect of Physicochemical Parameters
Adsorbent Mass
Fig. 4 illustrates the variation in the amount of crystal violet adsorbed as a function of the mass of OPCC or ACCC.
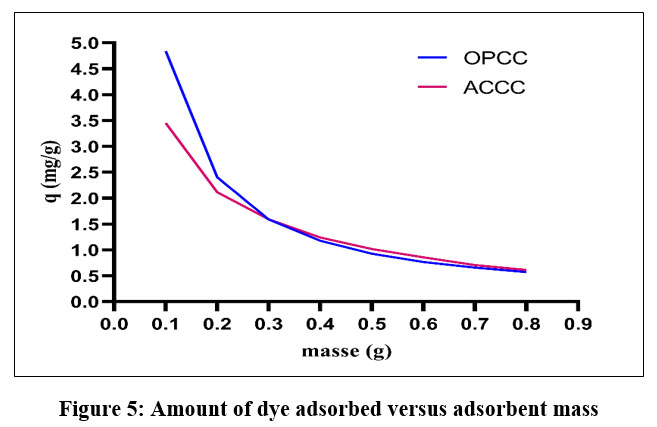 |
Figure 5: Amount of dye adsorbed versus adsorbent mass |
As the mass of the adsorbent increases, the amount of crystal violet adsorbed decreases from 4.84 mg/g to 0.57 mg/g for OPCC and from 3.45 mg/g to 0.61 mg/g for ACCC. The increase in mass at a constant volume indicates that the number of adsorption sites increases for a fixed amount of crystal violet. The two materials show similar amounts adsorbed. In fact, it appears that the adsorbent OPCC has a slightly higher adsorption than the ACCC adsorbent for mass values of less than 3 g for 50 mL of solution.
Initial pH of Solution
The effect of the solution’s pH on the amount of dye adsorbed was evaluated. The results from the different tests are presented in Fig. 6.
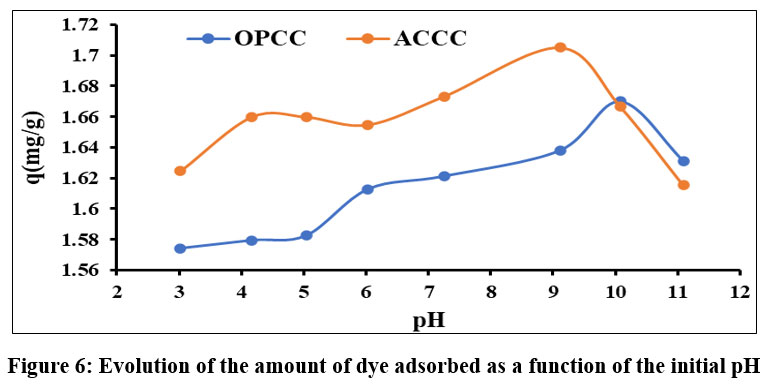 |
Figure 6: Evolution of the amount of dye adsorbed as a function of the initial pH |
Regardless of the adsorbent considered, as the pH varies from 3 to 11, the amount of crystal violet adsorbed increases moderately, reaches an optimum value, and then decreases. For OPCC, the experimental optimum value is 10, while that for ACCC is 9. These values are higher than the pH at zero charge of each adsorbent.
Contact Time
The adsorption kinetics study involved determining the equilibrium contact time and its effect on the pseudo-order of the adsorption reaction. The tests were conducted at a concentration of 10 mg/L. The experimental results for contact time determination for each adsorbent are presented in Fig. 7. Analysis of this figure shows that as contact time increases, the amount of crystal violet adsorbed rises steadily, eventually reaching equilibrium at 90 minutes for OPCC and 120 minutes for ACCC. This equilibrium is characterized by a nearly horizontal curve.
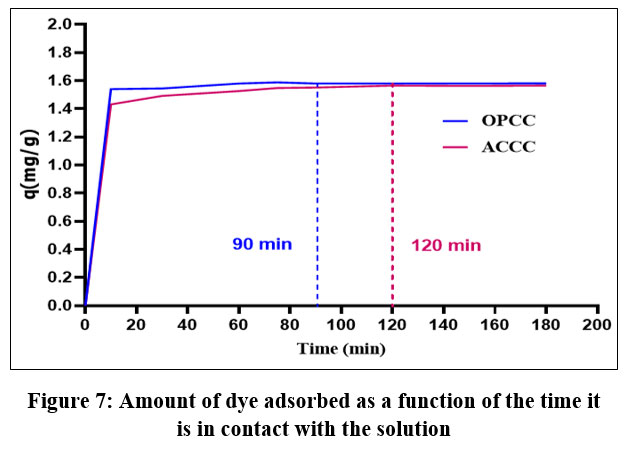 |
Figure 7: Amount of dye adsorbed as a function of the time it is in contact with the solution |
The experimental contact time results obtained previously were used to evaluate the kinetic models. The results of these applications are presented in Fig. 8 and the parameters derived from these different models are logged in Table 2.
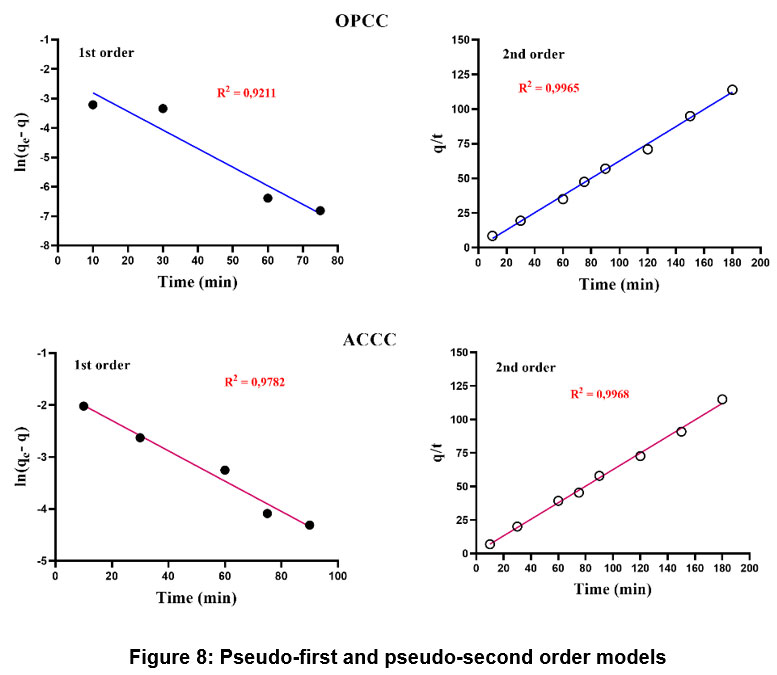 |
Figure 8: Pseudo-first and pseudo-second order models |
Table 2: The kinetic models parameters
| Pseudo-1st order | Pseudo-2nd order | ||||||
| Parameters | qexp(mg/g) | k1(min-1) | qeth(mg/g) | R2 | k2(g.mg-1.min-1) | qeth(mg/g) | R2 |
| OPCC | 1.5791 | 0.0663 | 0.1137 | 0.9211 | 1.1721 | 1.6074 | 0.9965 |
| ACCC | 1.5640 | 0.0292 | 0.1803 | 0.9782 | 0.4230 | 1.6196 | 0.9968 |
The combined analysis of Fig. 8 and Table 2 reveals that the crystal violet adsorption process on OPCC or ACCC does not obey the pseudo-first-order theory. In fact, pseudo-first order R2 coefficients are low. and the theoretical adsorption quantities (qeth) remain far from the values obtained experimentally (qexp).
Solution Initial Concentration
The effect of concentration was studied using initial concentrations ranging from 10 to 100 mg/L and stirring for 150 min. The results are presented in Fig. 9.
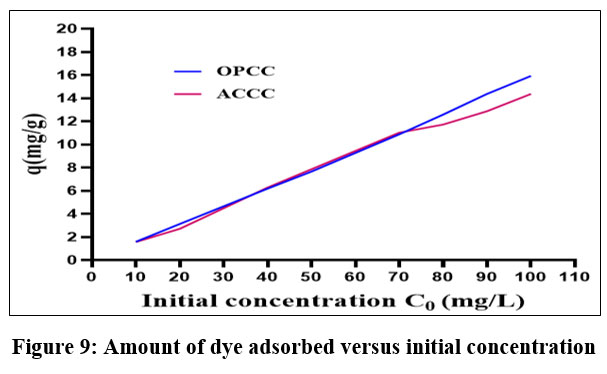 |
Figure 9: Amount of dye adsorbed versus initial concentration |
We observed an increase in the amount of crystal violet adsorbed as the initial dye concentration increased. Both adsorbents displayed nearly identical curve shapes and similar quantities of dye adsorbed, regardless of concentration. However, at concentrations above 70 mg/L, adsorption on OPCC was more efficient than on ACCC. The Langmuir and Freundlich adsorption isotherms were applied to analyze these experimental results. The adsorption isotherms are used to evaluate the performance of the adsorbents and determine key parameters, such as the maximum adsorption capacity. Fig. 10 illustrates the Langmuir and Freundlich adsorption models, while Table 3 presents their respective parameters.
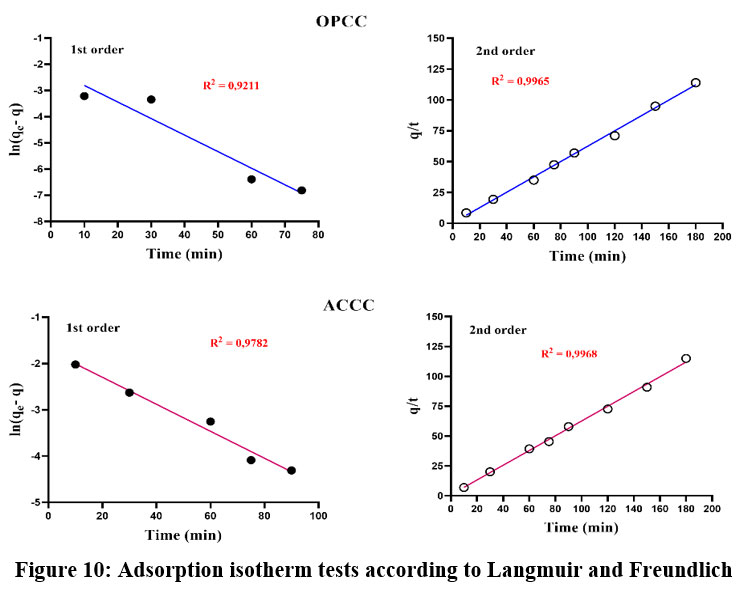 |
Figure 10: Adsorption isotherm tests according to Langmuir and Freundlich. |
Table 3: Parameters of the adsorption isotherms 
| Langmuir | Freundlich | |||||
| R2 | qmax | KL | R2 | n | KF | |
| OPCC | 0.9592 | -5.861 | 0.042 | 0.8988 | 1.15 | 0.313 |
| ACCC | 0.8035 | -11.376 | 0.014 | 0.9168 | 0.72 | 0.853 |
Fig. 10 shows that the Langmuir model predicts a negative maximum adsorption capacity (qmax) for both adsorbents. This typically suggests that the model is not suitable for describing the adsorption process in this case 28. Therefore, the adsorption process on both adsorbents (OPCC and ACCC) follows the Freundlich isotherm.
Environmental Temperature
The impact of temperature variation on the adsorption process was investigated for temperatures from 25°C to 50°C (298 K to 323 K) at a solution concentration Ci = 10 mg/L and a contact time of 150 minutes. The results are presented in Fig. 11.
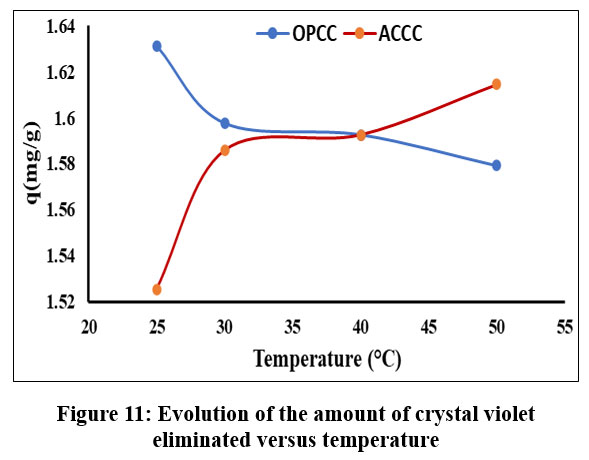 |
Figure 11: Evolution of the amount of crystal violet eliminated versus temperature. |
Analysis of this figure reveals a rapid increase in the amount adsorbed between 25°C and 30°C, followed by a more gradual increase above 30°C for the ACCC adsorbent. In contrast, for the OPCC adsorbent, the adsorbed amount decreases slightly as the temperature increases. This suggests a negative effect of temperature elevation on the dye adsorption process for ACCC and OPCC. The experimental results allowed for the determination of the thermodynamic parameters of the adsorption reaction for each adsorbent, as shown in Fig. 12.
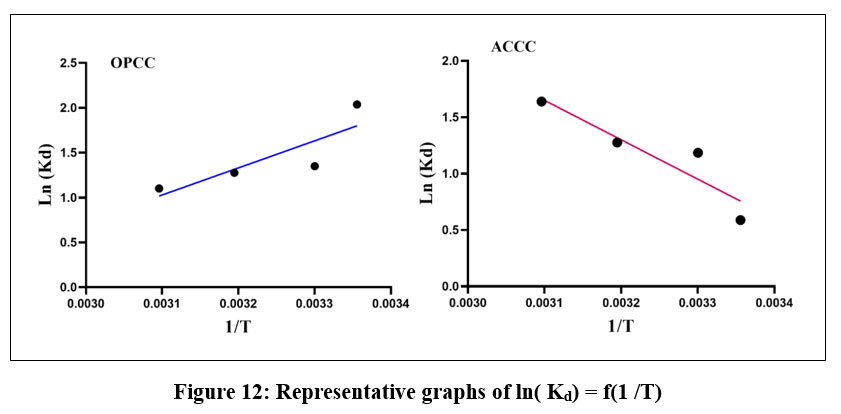 |
Figure 12: Representative graphs of ln( Kd) = f(1 /T). |
Fig. 12 shows the thermodynamic parameters of the adsorption reaction for each adsorbent. The calculated parameters are given in Table 4.
Table 4 : Dye adsorption reaction thermodynamic parameters
| Adsorbent | T (° K) | ΔG°(J/mol) | ΔH°(J/mol) | ΔS°(J/mol) |
| OPCC | 298 | -5045.26598 | -25075.02 | -69.17 |
| 303 | -3398.525 | |||
| 313 | -3319.20754 | |||
| 323 | -2955.01411 | |||
| ACCC | 298 | -1454.66515 | 29024.17 | 103.67 |
| 303 | -2983.8865 | |||
| 313 | -3319.20754 | |||
| 323 | -4399.33527 |
We observe for OPCC that ΔG°<0, ΔH°<0 and ΔS°<0 over the whole temperature range. For the ACCC adsorbent, ΔG° is negative over the whole temperature range, ΔH° and ΔS° are positive.
Discussion
In this study, two types of adsorbents were developed to treat water solutions contaminated with crystal violet. These adsorbents were synthesized from cotton capsules, an agricultural waste left in the fields after cotton seed harvesting. Two distinct chemical treatments resulted in the formation of the OPCC and ACCC adsorbents. OPCC was obtained through mild acid oxidation of cotton capsules using hydrogen peroxide (H2O2), while ACCC was produced by calcination in a muffle furnace followed by activation of the capsules. Characterization of the materials revealed an ash rate of 5.65% for OPCC and 4.94% for ACCC. The low ash rate of both adsorbents can be attributed to their minimal mineral content. According to Kouadio et al. 29, the ash rate can impact the overall performance of an adsorbent by clogging the pores and adsorption sites. The low ash rate, therefore, suggests a positive effect on the effectiveness of the developed adsorbents. Additionally, the low moisture content of ACCC (H = 9.24%, <10%) indicates that it is a potentially effective adsorbent, as less water would occupy the adsorption sites. OPCC has a higher water content which may be related to the retention of water in organic matter. This is because it was not completely degraded during the process of adsorbent synthesis. FTIR analysis of the two adsorbents revealed a disappearance of specific peaks in the OPCC spectrum, corresponding to the pigment discoloration of the raw capsules caused by oxidative treatment with hydrogen peroxide. In contrast, the spectrum of ACCC shows the emergence of new functional groups that could enhance dye adsorption. The results of the adsorbent mass effect assessment indicated that it is a limiting factor in dye adsorption. The increase in mass at constant volume resulted in a relative decrease in the amount adsorbed per mass of adsorbent. This can be explained by the formation of aggregates, which is likely to reduce the availability of adsorption sites. Similar results were reported by Homagai et al., (2022) 20 in their study of crystal violet adsorption on modified rice husks. For the best possible removal of crystal violet by the OPCC, the pH of the solution should be 10. This pH is higher than the pHpzc of OPCC, which is 7.71, while the pHpzc of ACCC is 8.21, and its optimal pH is 9. These pH values for optimal adsorption can be attributed to the greater affinity of the cationic dye for the negatively charged surfaces of OPCC and ACCC. These negative charges on the surface are caused by the deprotonation of the hydrogen containing functional groups 30. In addition, pore filling and π-π interactions between the adsorbate and the cotton capsule adsorbents may also contribute to these optimal adsorption conditions. The adsorption kinetics led to the determination of the kinetic pseudo-orders, with equilibrium times of 90 minutes for OPCC and 120 minutes for ACCC. The adsorption on OPCC and ACCC obeys the pseudo-second order kinetics. This suggests that the removal of violet crystal by both adsorbents is done via a chemisorption process. The findings of this study align with those of Sh et al.,22 who investigated the enhancement of crystal violet removal. The increase in the amount of dye removed with the rise in initial solution concentration may be attributed to the driving force created by the concentration gradient 31. This study also demonstrated that the dye adsorption processes for both adsorbents obey the Freundlich isotherm. The value n < 1 for ACCC indicates favorable adsorption, while for OPCC, the value of n > 1 suggests that process is more complex. This suggests that the removal of crystal violet by OPCC cannot be fully attributed to the adsorption phenomenon alone. Biological mechanisms, such as simple trapping and absorption into the organic matrix, could also play a role. The influence of temperature was the final experimental parameter assessed in the study. An increase in temperature favors the removal of crystal violet using CACC but has an adverse effect on adsorption by OPCC. The adsorption process is spontaneous (ΔG° < 0) for both adsorbents. It is also exothermic for OPCC (ΔH° < 0) and associated with a decrease in entropy (ΔS° < 0). In the case of CACC, the process is endothermic (ΔH° > 0) and is followed by an increase in entropy. (ΔS° > 0).
Conclusion
Two adsorbents derived from cotton plant capsules were developed using different chemical treatments and were utilized for the adsorption of crystal violet from aqueous solutions. The OPCC, obtained through oxidation, and the ACCC, produced by calcination and activation at high temperature, were both characterized. The results of the adsorption tests demonstrated a significant removal of crystal violet, which was influenced by several factors, including the initial dye concentration, stirring time, solution pH, and ambient temperature. The equilibrium time for the dye adsorption reaction was 90 minutes for OPCC and 120 minutes for ACCC. Both adsorption processes followed pseudo-second-order kinetics and the Freundlich model, indicating a chemisorption mechanism. For OPCC, this chemisorption is exothermic and hindered by an increase in temperature, while for ACCC, it is endothermic. The study highlights the potential for developing a less energy-intensive OPCC-type adsorbent with a crystal violet removal capacity comparable to that of activated carbon (ACCC). Both adsorbents are derived from cotton capsules, a valuable agricultural waste product. With further research, OPCC could become a cheaper and more eco-energy material, paving the way for wider recovery of agricultural cotton waste in the study area.
Acknowledgement
We are grateful for technical support from Peleforo GON COULIBALY University and the Central Laboratory of NANGUI ABROGOUA University.
Conflict of Interest
There are no conflicts of interest in relation to this manuscript.
References
- Sadoq, M.; Atlas, H.; Imame S.; Kali, A.; Amar, A.; Loulidi, I.; Jabri, M.; Sadoq, B.E.; Ouchabi, M.; Abdullah, P.S.; Boukhlifi, F., Arabian Journal of Chemistry, 2024, 17, 105453. https://doi.org/10.1016/j.arabjc.2023.105453.
CrossRef - Anjum, F.; Asiri, A.M.; Khan, M.A.; Khan, M.I.; Khan, S.B.; Akhtar, K.; Bakhsh, E.M.; Alamry, K.A.; Alfifi, S.Y.; Chakraborty, S., Journal of Materials Research and Technology, 2021 15, 3171–91. https://doi.org/10.1016/j.jmrt.2021.09.086.
CrossRef
- Ma, X.; Duan, D.; Chen, X.; Feng, X.; Ma, Y., Int. J. Biol. Macromol., 2022, 205, 604–14. https://doi.org/10.1016/j.ijbiomac.2022.02.071.
CrossRef
- Hernández-Zamora, M.; Martínez-Jerónimo, F., Environmental Science and Pollution Research, 2019, 26, 11743–55. https://doi.org/10.1007/s11356-019-04589-1.
CrossRef
- Mani, S.; Bharagava, R.N., 2016, 71–104. https://doi.org/10.1007/978-3-319-23573-8_4.
CrossRef
- Zhang, Q.; Zhang, T.; He, T.; Chen, L.; Appl. Clay Sci., 2014, 90, 1–5.
https://doi.org/10.1016/j.clay.2014.01.003.
CrossRef
- Au, W.; Pathak, S.; Collie, C.J.; ; Hsu, T.C., Mutation Research/Genetic Toxicology, 1978, 58, 269–76. https://doi.org/10.1016/0165-1218(78)90019-8.
CrossRef
- Kulkarni, M.R.; Revanth, T.; Acharya, A.; Bhat, P., Resource-Efficient Technologies, 2017, 3, 71–7. https://doi.org/10.1016/j.reffit.2017.01.009.
CrossRef
- Lima, A.M.; de Oliveira, A.M.; de Sousa, T.G.; Pereira, A.C., de Carvalho, R.B.; Pinheiro, W.A.; Desalination Water Treat., 2022, 278, 217–25. https://doi.org/10.5004/dwt.2022.29027.
CrossRef
- Rasilingwani,T.E.; Gumbo, J.R.; Masindi, V.; Foteinis ,S., Water Res. Ind., 2024, 31, 100253. https://doi.org/10.1016/j.wri.2024.100253.
CrossRef
- Joseph J, Radhakrishnan RC, Johnson JK, Joy SP, Thomas J., Mater Chem. Phys., 2020, 242, 122488. https://doi.org/10.1016/j.matchemphys.2019.122488.
CrossRef
- Goudjil, S.; Guergazi, S, Masmoudi, T.; Achour, S., Desalination Water Treat., 2021, 209, 429–36. https://doi.org/10.5004/dwt.2021.26474.
CrossRef
- Alabbad, E.A.; Bashir, S.; Liu, J.L., Catal Today, 2022, 400–401, 132–45. https://doi.org/10.1016/ j.cattod.2021.06.017.
CrossRef
- He, M.; Zhao, L.; Hu, H.; Yao, L.; Guo, Y.; Hou, C.; Gao, S.; Li, R., Environ. Res., 2024, 263, 120193. https://doi.org/10.1016/j.envres.2024.120193.
CrossRef
- Kouadio, D-B. K.; Zoungranan, Y.; Daniel, Y.D.; Lynda, E.; Tchirioua, E., Int. Res. J. Pure Appl. Chem., 2021, 22, 1–11. https://doi.org/10.9734/IRJPAC/2021/V22I530405.
CrossRef
- Vieira, M.L.G.; Martinez, M.S.; Santos, G.B.; Dotto, G.L.; Pinto, L.A.A., J Environ Chem. Eng., 2018, 6, 3233–41. https://doi.org/10.1016/j.jece.2018.04.059.
CrossRef
- Loffredo, E.; Parlavecchia, M., Environ. Technol. Innov., 2021, 21, 101358. https://doi.org/10.1016/j.eti.2021.101358.
CrossRef
- Tyagi, U.; Anand, N., Waste Management Bulletin, 2024, 2, 308–25. https://doi.org/10.1016/j.wmb.2024.05.010.
CrossRef
- Azka, M.A.; Adam, A.; Ridzuan, S.M. Sapuan, S.M. Habib, A., Int. J. Biol. Macromol., 2024, 269, 132052. https://doi.org/10.1016/j.ijbiomac.2024.132052.
CrossRef
- Homagai, P.L.; Poudel, R.; Poudel, S.; Bhattarai, A., Heliyon, 2022, 8, e09261. https://doi.org/10.1016/j.heliyon.2022.e09261.
CrossRef
- Mohanty, K.; Naidu, J.T.; Meikap, B.C.; Biswas, M.N., Ind. Eng. Chem. Res., 2006, 45, 5165–71. https://doi.org/10.1021/ie060257r.
CrossRef
- Sh, H.; El-taweel, R.M.; Alrefaey, K.A.; Labena, A.; Fahim, I.S.; Said, L.A.; Radwan, A.G., Case Studies in Chemical and Environmental Engineering, 2024, 9, 100534. https://doi.org/10.1016/ j.cscee.2023. 100534.
CrossRef
- Tang, G.; Mo, H.; Gao, L.; Chen, Y.; Zhou, X., Journal of Water Process Engineering, 2024, 68, 106334. https://doi.org/10.1016/j.jwpe.2024.106334.
CrossRef
- Yasin, F.; Javed, T.; Jilani, M.I.; Zafar, S.; Din, M.I., Desalination Water Treat, 2021, 227, 338–49. https://doi.org/10.5004/dwt.2021.27241.
CrossRef
- Tillie, P. ; Louhichi, K.; Gomez-Y-Paloma, S., vol. JRC111027. EUR 29429 FR. Luxembourg: Publications Office of the European Union, 2018.
CrossRef
- Yao, K.S. ; Koissy-Kpein, S.A., L’Actualité Économique, 2016, 90, 191–221. https://doi.org/10.7202/1034737ar.
CrossRef
- Aloko-N’guessan, J., Koffi-Didia, M.A.; Coulibaly, H.T., EchoGéo, 2018, 43. https://doi.org/10.4000/ echogeo.15192.
CrossRef
- Ayawei, N.; Ebelegi, A.N.; Wankasi, D., J. Chem., 2017, 2017, 1–11. https://doi.org/10.1155/ 2017/3039817.
CrossRef
- Kouadio, L., Int. J. Adv. Res., 2019, 7, 920–30. https://doi.org/10.21474/IJAR01/9294.
CrossRef
- Kar, S.; Santra, B.; Kumar, S.; Ghosh, S. ; Majumdar, S., Environmental Pollution, 2022, 312, 120056. https://doi.org/10.1016/j.envpol.2022.120056.
CrossRef
- Deng, H.; Lu, J.; Li, G.; Zhang, G.; Wang, X., Chemical Engineering Journal, 2011, 172, 326–34. https://doi.org/10.1016/j.cej.2011.06.013.
CrossRef


ISSN Online: 2231-5039

![]()


