Spectrophotometric Studies of Ternary Complexes of Erbium to Explore the Hyperchromic Effect with Various Ligands and its Used in Micro Determination
Shamim Shaukat Khan
General Education Department, Dar Al-Hekma University, Jeddah, Kingdom of Saudi Arabia.
Corresponding Author E-mail: skhan@dah.edu.sa
DOI : http://dx.doi.org/10.13005/ojc/360616
Download this article as:
![]()
A comprehensive spectrophotometric study is undertaken for ternary complexes of higher rare earth element Erbium with EDTA, HEDTA, CYDTA and EGTA as primary ligand and the binary ligands used are maltol, tiron, kojic acid and α -picolinic acid. The ternary complexes showed hyperchromic effect as compare to primary complexes is exploited to determine the stoichiometry of ternary complexes and their stability constants were computed. Also order of stabilities with respect to various secondary ligands is established for different Erbium-primary ligand systems. The study is useful in the micro determination of higher rare earth elements like Erbium.
KEYWORDS:Molar Extinction Coefficients; Molar Ratio And Absorbance; Primary Complex; Secondary Complex; Stability Constant; Ternary Complexes
Introduction
In past years there have seen a rise in the study of mixed ligand or ternary complexes, where a metal ion is held simultaneously by two different ligands. However, there is a large paucity of data of such complexes with rare earth metals. This is because the study of rare earth complexes encounters several difficulties. In these elements, the electrons enter into the deeper f orbitals inside the atom and they have small magnitude for f-f transition. Therefore, the molar extinction coefficients of rare earth complexes are smaller compare to transition metals. Further, their spectral characteristics are not much influenced by the chemical environment as they have single stable oxidation state of +3. Thus, attention is directed towards investigating ternary systems (mixed ligand complexes) of rare earth elements with spectrophotometric technique. The rare earth metal ions from solution are separated, estimated and analyzed using versatile complexing agents to form mixed ligand or ternary complexes with constant and extended coordination. Most of the ternary complexes studied are by potentiometric titrations. Such ternary complexes of Ho+3 and Er+3 mixed chelates with various complexones and 5-sulphosalicylic acid have been studied by Taketatsu, T.1
PH-metric titrations of mixed ligand complexes of rare earth with EDTA and HEDTA as primary ligand and oxine, β isopropyltropolone as secondary ligand 2.
Sequential determination of thorium and rare earths elements with EDTA and Kojic acid are more stable than xylenol orange ternary complexes 3.
Potentiometric studies of mixed ligand complexes of rare earth reported by Taqui4 with EDTA as primary and TPP and ATP as secondary ligands.
Spectrophotometric studies of coordination ternary complexes of rare earth elements with chrome azurol in presence of Cetylpyridinium bromide with λ max 620nm at pH5.4 for the determination of Lanthanum, Praseodymium, Neodymium, Samarium, Gadolinium and Dysprosium is reported by C.R.Vekhhande 5. Methylene blue and cetylpyridinium bromide or cetyltrimethyl-ammonium bromide were used for microscopic determination of some rare earth6.
In this paper, spectrophotometric studies of ternary mixed ligand complexes of higher rare earth element (Erbium) are undertaken with hexadentate primary ligands. The primary ligands used are: ethylene diamine tetra acetic acid, hydroxyl ethylene diamine triacetic acid, trans-1,2-cyclohexane diamine tetra acetic acid and ethylene glycol bis (2, amino ethylene)N, N1,N11,N111 tetra acetic acid. Further, the secondary ligands, which are bidentate, are maltol, tiron, kojic acid and α picolinic acid. In the present study the hyperchromic effect that is increased in absorption intensities exhibited by the rare earth elements in mixed ligand complexes as comparedwith the primary complexes are exploited. This is evident from the increased in molar extinction coefficient values of mixed ligand or ternary complexes (Em) as comparedwith the molar extinction coefficients of binary complexes (Ep). The stability constants and the stoichiometry of ternary complexes are also determined for the systems under study.
In utilizing the rare earth absorption bands for analytical purposes, the first problem is to choose the most suitable band for use as index peak to calculate the extinction coefficients under specified test conditions.The light absorption bands of rare earth elements are extremely narrow and consequently, a number of readings should be taken around each index peak position to ensure that the point of maximum light absorption is seen. A generalized light absorption background is present especially in shorter wavelength, so the readings taken may be incorrect if the analyst is unaware of the background due to impurities. Thus, an automatic recording spectrophotometer is used for rare earth analysis.
Methodology
In the present study, the modified molar ratio method7 is used which gives the curve that rises as a straight line and breaks sharply to almost constant optical density at the molar ratio of components in the complex. The primary complex of erbium and hexadentate ligand is a primary species. Equimolar mixture of erbium ions and primary ligand solution is mixed with various concentrations of the secondary ligand. The spectra are studied between fixed wavelength ranges on Hitachi 330 automatic recording spectrophotometer. The optical densities or absorptions are measured at λ max values and the optical density is plotted against the mole ratio concentration of secondary ligand (Ls) to the concentration of primary complex (Ln-Y).

Where Ls is secondary ligand and Ln-Y as primary complex. The extinction coefficient for primary complex (E p) and ternary complex (Em ) are calculated using Lambert-Beer’s law.

Where Epis the molar extinction coefficient of primary complex, C is the molar concentration, L is the optical path length in cm and Em is the molar extinction coefficient for ternary complex. For ternary complex extinction coefficient (Em) is computed at the sharp break point in the curve of absorbance versus mole ratio.
Further, the concentration of the ternary complexes and their stability constants were computed from the absorbance values on the rising portion of the curve of absorbance versus the mole ratio of [Ls]/[primary complex]relation given by Sathe, R.M.8

Where ‘A’ is the measured absorbance of mixed or ternary complex at the respective λ max values. Ep is the extinction coefficient of primary complex, which is a mixture of rare earth element and polyamino carboxylic acids in equimolar quantity; Em is the molar extinction coefficient of metal ion-polyamino carboxylic acids and bidentate secondary ligand. ‘p’ is the initial concentration of primary ligand and ‘x’ is the concentration of mixed chelate formed.
The conditional stability constants at the pH of measurement calculated by the following equation:
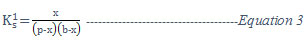
Where b is the concentration of secondary ligand added, and Ks1 is the stability constant at pH value of 8± 0.05.
Apparatus used
The details of the apparatus utilized for analysis mentioned below
Spectrophotometer
Make: Hitachi model 330 automatic recording spectrophotometer.
Measuring wavelength range: 187-2500 nm
Wavelength display: 4 digits LED
Wavelength accuracy: ± 0.2 nm
Photometric accuracy: 0.002 ABS
Recording mode: overlapped or sequential
Light source: WI or D2 lamp automatic
Other details: The instrument performs the checks of performance and functions as well as calibrating operations. The instrument standardized by using distilled wateras blank and potassium permanganate. The spectra run at a scan speed of 60 nm/min. The response adjusted at one and the slit width 2nm. The scanning wavelength range for erbium 450-350 nm and on the spectra the absorbance at λ max chosen for the maximum sensitivity for all calculations.
pH meter
Make: M64 Research pH –meter, accuracy: 0.02 pH unit
Preparation of solutions
The method of standardization of metal ions solutions and the primary ligands are accepted methods from Vogel, A.I. 9. Further secondary ligands are crystallised from appropriate solvents.
Standard zinc Solution
Standard zinc solution 0.1 M is prepared by dissolving 1.6343 g of BDG Analar R zinc pellets in hydrochloric acid and volume made to 250 cm3.
EDTA (Ethylene diamine tetra acetic acid)
Disodium dihydrate E GR, made by Merck, dried at 800 C to prepare a 0.1M solution of EDTA.
HEDTA (Hydroxyethylene diamine triacetic acid)
HEDTA (AR No. 1) made by KOCH –Light laboratories Ltd. was used to prepare 0.1 M solution.
CYDTA (Trans 1, 2, cyclohexane diamine tetra acetic acid)
CYDTA made by Fluka A.G, A.R. grade is used to prepare O.1 M solution by dissolving the compound by adding drop-by-drop ammonia solution and then diluted.
EGTA (Ethylene glycol bis (2-amino ethylene) N,N1,N1 1 ,N1 1 1 tetra acetic acid)
EGTA used is from Fluka. A.G. which is dissolved by adding dilute ammonia drop by drop, just sufficient to dissolve before dilution.
Standardization of solutions of EDTA, HEDTA, CYDTYA and EGTA
10ml of zinc standard solution is diluted to 50 ml with distilled water, 2 ml of ammonia buffer (pH= 10), and a few drops of Eriochrome black T as indicator. The solution is then titrated against the EDTA. Similarly, HEDTA, CYDTA and EGTA are standardized by titrating against zinc standard solution.
Secondary ligands
Maltol (3, hydroxyl-2-methyl 4,pyrone) KOCH Light Laboratories 0.1M.
Tiron (Catechol 3,5-disulfuric acid disodium salt) Fluka AG. Buch.
Kojic acid BDH, biochemical grade recrystallized from hot alcohol containing animal charcoal.
αPicolinic acid BDH A.R.
Preparation of Erbium solution
Erbium (III) oxide (Er2O3) obtained from Indian Rare Earth Ltd of purity 99.905 was dissolved in nitric acid, heated on a water bath, cooled and then diluted. The final free acidity is maintained at 0.1 M.
Standardization of Erbium solution
5 ml of rare earth solution is diluted to 25 ml with distilled water. pH is adjusted to 5.5 using saturated hexamine solution, two drops of xylenol orange indicator is added and then titrated against standard EDTA till the color changes from red to lemon yellow.
Spectrophotometric measurements
Enough solution of Erbium (Er+3) is taken to give 10 ml of 1.0x 10⁻²M with same molarity of primary ligand. The pH is adjusted to 8.0 by 15 % solution of triethanolamine and then made up to 10ml. The spectra of the solutions taken in the range 350-nm-450nm, scan rate 60m/min.
For mixed complexes same procedure with secondary ligand solution added to give 4×10⁻³ to 3x 10⁻²M. The maximum absorbance values recorded for different molar ratios of secondary ligands to the primary complexes. The absorbance values for Erbium measured at 379nm.
Results and Discussions
The absorbance increases steadily in an almost linear fashion with the increased in concentration of secondary ligand until the molar ratio of 1:1 is reached for [secondary ligand] / [ primary- complex], thereafter it increases but the increased is only normal. This patternproves that the primary complex fully transformed into ternary or mixed ligand complex at the above molar ratio and the stoichiometry of all the ternary complexes of erbium (Er) thus found to be 1:1: 1 as shown in Fig.1.
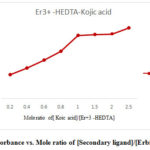 |
Figure 1: Absorbance vs. Mole ratio of [Secondary ligand]/[Erbium-HEDTA] |
This result is in line with the Stoichiometry of ternary complexes of Neodymium and Europium using tryptophan and sodium citrate has constant composition of M-L-L’ (1:1:1) reported by Wang, 10. Mixed ligand systems of Holmim-triethylene tetraamin hexaacetic acid-Maltol shows the stoichiometry of 2:1:2. 11
The absence of interaction between the ligands and 4f orbitals of metal ionssupported by the observation that the complexing groups have only small effects on the position of these sharp well define absorption bands in the UV region as evident from the absorption spectra. Fig.2
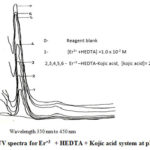 |
Figure 2: UV spectra for Er+3 + HEDTA + Kojic acid system at pH 8 |
A study of rare earth complexes as reported in research article12 shows that the coordination number for these elements varies from six to nine in aqueous solutions. In present study we found the common coordination number for Erbium is eight as evident from the results which shows 1:1:1 stoichiometry for all the ternary complexes of erbium studied, where the primary ligands are hexadentate and the secondary ligands are bidentate.
The hyperchromic effect seen when ternary complexes are formed is evident from increase in molar extinction coefficient of ternary complexes(M-Lp-Ls) compare to primary complexes which are calculated as % increase in the molar extinction coefficients as compared to the primary complex (M-Lp) and are given in table 1.Formation of ternary complexes with large bathochromic shift and increase in molar absorptivity compared to binary complexes is a useful tool in micro determination of rare earths as reported by Belsare, G.W 13
Table 1: % Increase in molar extinction coefficient (Em) of mixed ligand complexes of Erbium with different primary ligands (LP) and secondary ligands (SL)
|
Secondary ligands |
% increase in Em with EDTA (L mol-1 cm-1) |
% increase in Em with HEDTA (L mol-1 cm-1) |
% increase in Em with CYDTA (L mol-1 cm-1) |
% increase in Em with EGTA (L mol-1 cm-1) |
|
Maltol |
83.2 |
79.1 |
69.9 |
31.52 |
|
Tiron |
76.9 |
72.1 |
66.7 |
29.0 |
|
Kojic acid |
82.8 |
79.0 |
77.3 |
57.7 |
|
α- picolinic acid |
47 |
56.6 |
27.7 |
10.44 |
The order of hyperchromic effect with respect to secondary ligands in the ternary complexes of Erbium for all the systems studied are Kojic acid > Maltol > Tiron >α Picolinic acid as evident from the Fig. 3. The ternary complexes of HEDTA and CYDTA shows enhancement of stabilities over those of EDTA/EGTA as evident from the Logk’s values calculated and given in Table. No.2 and can be explained in terms of electrostatic effect. In the case of HEDTA and CYDTA the secondary ligand has to combine with a neutral primary chelate while in EDTA/EGTA, it has to face uninegative metal- EDTA/EGTA chelate. L.C.Thompson14 in the study of Ln-HEDTA- glycine/ iminodiacetate system have noticed similar findings.
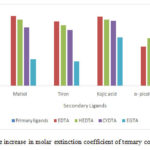 |
Figure 3: Percentage increase in molar extinction coefficient of ternary complexes of Erbium |
Table 2: Comparison of conditional stability constant (Log k s1) with corrected stability constants
|
Primary ligands |
Log ks1 for Er+3-EDTA |
Logks1/pk |
Log ks1 for Er+3-HEDTA |
Logks1 /pk |
Log ks1 for Ho+3-CYDTA |
Logks1 /pk |
Log ks1 for Ho+3-EGTA |
Logks1 /pk |
|
Maltol |
2.55 |
0.29 |
3.37 |
0.38 |
3.27 |
0.37 |
3.02 |
0.35 |
|
Tiron |
3.22 |
0.42 |
3.48 |
0.45 |
2.61 |
0.34 |
3.34 |
0.38 |
|
Kojic acid |
2.72 |
0.35 |
2.84 |
0.36 |
3.48 |
0.44 |
3.16 |
0.40 |
|
α- picolinic acid |
2.86 |
0.57 |
3.06 |
0.60 |
2.52 |
0.5 |
2.89 |
0.57 |
In establishing the order of stability for ligands where ligand has one basic functionality, the ratio of Log ks1 / Log kH = A , where Log kH is the measure of basicity of ligand, thus A will reflect the affinity of ligand anion more faithfully. ‘A’can be named as the affinity parameter and the stability order for the ligands can be established on the basis of A values and not on their Logks1 values. The conditional stability constants corrected using pKs values of secondary ligands as by Shetty, S.Y 8. The KS1 and corrected stability constant values given in TableNo.2. The perusal of this table shows that for Erbium-EDTA-Maltol , Er-HEDTA-Maltol, Er-CYDTA-Maltol and Erbium-EGTA-Maltol systems the values of A, ratio of LogKs1 / pKs remains almost constant at 0.32(+0.04 to -0.04) .
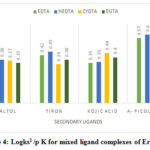 |
Figure 4: Logks1 /p K for mixed ligand complexes of Erbium |
Thus, using this parameter, the order of stability with the series of ligands in different systems is deduced as EDTA and HEDTA: α picolinic acid >Tiron>kojic acid > Maltol and CYDTA and EGTA: α picolinic acid > kojic acid > Tiron > Maltol. The stability order clearly brings out the preference of the erbium ion for nitrogen donor ligands over oxygen donor ligand.It is possible to separate, estimate and analyze the Erbium ions(Er+3) using these versatile complexing agents.
The study will continue to establish relation between stability order for different rare earth elements with same primary and secondary ligands and ionic radii of metal ions.
Acknowledgment
I thank Dr. R. M. Sathe, Dr M. Sunderesan of Analytical Chemistry Division, Bhabha Atomic Research Center Trombay, Mumbai 400085
Conflicts of Interest
The author declares no conflict of interest.
References
- Taketatsu, T.; Yoshida, S.;J. Inog. Nucl. Chem.1973,35, 881.
CrossRef - Shetty. S.Y.;Current. Sc.1972, 41, 675.
- Sathe R.M.; Shetty,S.Y.; J. Talanta,1976,23, 46-47
CrossRef - Khan, M.M. T.; Reddy, P. R.; J. Inorg. Nucl. Chem. ,1972 ,34, 967
CrossRef - Vekhande , C. R..;Munshi, K.N.;Ind. J. Chem.1976, 14, 189-191
- Vekhande, C. R.; Munshi, K.N.;Ind. J. Chem., 1975, 52, 939-941
- Harvey, A.E.; Manning, D.L.; J. Am. Chem. Soc. 1950,72, 4488-4493
CrossRef - Shetty, S.Y.; Sathe, R.M.; Ind. J. Chem.1983. 22A, 452-453
- Vogel, A.I.;A Text. B. Quant. Inorg. Analy.1961, 239.
- Wang, X.-C,; Gao, Q. K.; Wang, K. J.; Wang. R.;Chem. Papers.2012, 66, 188-193
CrossRef - Sathe, R. M.; Shetty, S.Y.;Ind. J. of Chem.1986, 25A, 494-495.
- Khan, M. M.T.; Reddy, P.R.; J. Inorg.Nucl. Chem.1972,34, 967-972
CrossRef - Thompson, L.C.; Loraas, J.A.;Inorg. Chem.1963,2, 89
CrossRef - Belsare, G.W.; Zade, A.B.; Kalbende, P.P.; Belsare,, P.U.;Der Phar. Chemi.,,2012,4 1226-1238


ISSN Online: 2231-5039

![]()


