Physico-Chemical, Antioxidant and Antimicrobial Investigation on new Mixed Ligand Complexes Containing bis(2,4,4-trimethylpentyl)dithiophosphinic Acid and 2,2′-bipyridine
 , Md. Ashraful Alam1, Subrata Paul2, Md. Chanmiya Sheikh3 and Hasan Ahmad4
1Department of Chemistry, Rajshahi University of Engineering & Technology, Bangladesh.
2Department of Pharmacy, University of Rajshahi, Bangladesh.
3Department of Applied Chemistry, University of Toyama, Japan.
4Department of Chemistry, University of Rajshahi, Bangladesh.
DOI : http://dx.doi.org/10.13005/ojc/340303
Download this article as:
![]()
New six mixed ligand complexes have been synthesized from bis(2,4,4-trimethylpentyl)dithiophosphinic acid (C16H35PS2) and 2,2′-bipyridine (C10H8N2) with various metal(II) ions. The molecular formula of the mixed ligand complexes were [Mn(C16H34PS2)(C10H8N2)]Cl (1)
Antioxidant; 2,2′-bipyridine; FAB-mass and DPPH
Introduction
Bis(2,4,4-trimethylpentyl)dithiophosphinic acid (BDTPA) is the sulfur substitution of organo-phosphorous extracting reagent. Sulfur has lower electronegativity as compared to oxygen. Thus electrons of sulfur atom are more easily shared in the formation of metal-sulfur bond and increase the bond strength. BDTPA has been widely used as reagent for the extraction of trace metals in sample [1]. N,N’-chelating heterocyclic ligand, 2,2′-bipyridine is a Lewis base, metal-coordinating, electron-deficient aromatic system which can undergo π–π stacking interactions as π-acceptors [2]. This bidentate ligand readily form complexes with most of the transition metal ions and can help in stabilizing metal atom in very low formal oxidation state [3,4]. The diimine ligand, 2,2′-bipyridine has been used extremely in the complexation of metal ions due to its strong redox stability, ease of functionalization, excellent chelating property and diverse structural feature [5,6]. It is widely used in coordination chemistry, supramolecular and macromolecular chemistry [7]. In a complex where two or more different ligands are present, then the complex is said to be mixed ligand complex [8]. Mixed ligand complexes of S and N-chelating ligands have attracted considerable attention because of their interesting physico-chemical properties and their use as models for metalloenzyme active sites [9]. Mixed ligand complexes based on dinitrogen chelating ligand have been extensively studied due to their potential applications in biological field, photochemistry [5,10], catalyst for the hydrolysis of phosphate ester, synthesis of crown ester [10], antioxidants [11], herbicides, solar energy conversion, colorimetric analysis [12], DNA binding and cleavage studies [4]. Numerous metal complexes with 2,2′-bipyridine as a ligand or mixed with other ligands were reported [5,12–14]. As a continuation of research in this area, we report herein the synthesis, characterization, thermal and antimicrobial study on mixed ligand complexes with bis(2,4,4-trimethylpentyl)dithiophosphinic acid and 2,2′-bipyridine. The mixed ligand complexes were found to have the general formula [M(C16H34PS2)(C10H8N2)]Cl (M= Mn(II), Fe(II), Co(II), Cu(II), Zn(II) or Cd(II)).
Experimental
Materials and Methods
All chemicals were purchased from Merck as well as Sigma Aldrich and used without further purification. FT-IR spectra were recorded on an IR Affinity 1S spectrophotometer, Shimadzu, Japan with samples prepared as KBr pellets, in the 400-4000 cm-1 range. Electronic spectra of the compounds were recorded using a T60 UV-VIS spectrophotometer (PG Instruments, UK) programmed with Win5 software, version 5.1. The mass spectra were measured on a JEOL-JMS-D300 spectrometer. Thermal decomposition was carried out using a TG 60, Shimadzu, at a heating rate of 10°C min-1 from room temperature to 800°C under nitrogen gas. Magnetic susceptibility and molar conductance measurements were acquired on a magnetic susceptibility balance (Sherwood Scientific, UK) and an ECOSCAN CON5 conductivity/temperature meter (Eutech Instruments, Singapore, Serial No. 101886), respectively. Particle size and surface morphology were performed using a JEOL, JSM-6360 LV with energy-diffusive X-ray spectroscopy JEOL, JED-2300. The antioxidant activity of the mixed ligand complexes was carried out by DPPH method [15,16]. The antimicrobial activities were screened against some selected bacteria and fungi species using disc diffusion method [17–19].
Preparation of mixed ligand complexes
An ethanolic solution of 1 mmol of metal(II) chloride was stirred with an ethanolic solution of 2,2′-bipyridine (1 mmol ) and 0.322g of bis(2,4,4-trimethylpentyl)dithiophosphinic acid (1 mmol ) was added. Then the resultant mixture was stirred for 30 minutes and refluxed for about 1h. The precipitated metal complexes were isolated and washed with hot ethanol. The metal complexes were recrystallized from ethanol and dried under vacuum over anhydrous calcium chloride at room temperature.
Results and Discussion
Molar Conductivity and Nature of Species
The molar conductance values of metal complexes were found to be in the range 74-97 -1 cm2 mol-1 (Table 1) suggesting 1:1 electrolyte. The complexes have been showed an ionic in nature due to the presence of one chloride ion in the outside of coordination sphere [3,20,21]. Melting point gives primary information about the formation of complex. The higher melting point of the obtained complexes (171-225oC) were indicated the formation of metal complexes [22,23]. The sharp melting point was also indicated the purity of metal complexes. Mixed ligand complexes were soluble in most common solvents like dichloromethane, acetonitrile, chloroform, DMF and DMSO. The experimental physico-chemical data of the metal complexes were in good agreement with the proposed structural formula.
Table 1: Physical data of the compounds
| Ligand/Complex | Color | Melting point (±2oC) | Yield (%) | ∧ (ohm-1cm2mole-1) |
| 2,2′-bipyridine | Colorless | 72 | – | – |
| BDTPA | Greenish liquid | – | – | – |
| 1 | Dark green | 225 | 56 | 97 |
| 2 | Light yellow | 187 | 60 | 76 |
| 3 | Light Blue | 173 | 59 | 74 |
| 4 | Orange | 210 | 63 | 78 |
| 5 | White | 182 | 52 | 90 |
| 6 | White | 171 | 65 | 94 |
IR Spectra and Mode of Bonding
The infrared spectra gives important information about the nature of functional groups and binding mode of ligand to metal ion in complexes. The characteristic absorption bands in the IR spectra were represented in Table 2. A medium strong band at 1577 cm-1 was attributed to stretching mode of the C=N in 2,2′-bipyridine [24][25]. This band was shifted to lower frequency (17-27) in the complexes which clearly indicated the coordination of the two nitrogen atoms with metal ion. The new peaks in the region 502-513 cm-1 can be assigned to asymmetric stretching M-N in metal complexes proving the coordination of the 2,2′-bipyridine as bidentate ligand [24,26–29]. The free bis(2,4,4-trimethylpentyl)dithiophosphinic acid was showed a medium band at 2638 cm-1 for ν(S-H) vibration [30]. This band was found to have disappeared in respective complexes confirming the coordination of sulfur atom with metal ion via deprotonation. A medium band of ν(P=S) was observed at 637 cm-1 [1,30,31]. This band was shifted to lower frequency (20-47 cm-1) in metal complexes. Due to the donation of electrons, sulphur atom of thiophosphoryl group was coordinated to metal ions. In addition, the weak peak in the region of 415-419 cm-1 was assigned to stretching vibrations of M-S bond confirming the coordination of sulfur atoms of bis(2,4,4-trimethylpentyl)dithiophosphinic acid with metal ion as uninegative bidentate fashion [1,32].
Table 2: Selected infrared absorption frequencies (cm-1) of ligands and their metal complexes
| Ligand/complex | ν(C=N) | ν(P=S) | ν(S-H) | ν(M-S) &ν(M-N) |
| 2,2′-bipyridine | 1577 | – | – | – |
| BDTPA | – | 637 | 2638 | – |
| 1 | 1558 | 617 | – | 419 & 502 |
| 2 | 1550 | 590 | – | 419 & 504 |
| 3 | 1557 | 614 | – | 415 & 503 |
| 4 | 1559 | 594 | – | 419 & 502 |
| 5 | 1558 | 592 | – | 418 & 513 |
| 6 | 1560 | 613 | – | 415 & 506 |
Electronic Spectra and Magnetic Properties
The electronic spectra provide feasible indication about the ligand arrangement in metal complexes. It also distinguishes among the square-planar, tetrahedral and octahedral geometries of complex. Magnetic moment value gives reliable information about paramagnetic or diamagnetic nature as well as geometry of complex. Color further assists to find out the correct geometry of the complexes [33]. The ligand, 2,2′-bipyridine was showed two bands at 230 nm and 275 nm, which ascribed to transitions π → π* and n → π*, respectively. An absorption peak of BDTPA was exhibited at 260 nm and 290 nm, which assigned to π → π* and n → π* transitions, respectively. These bands were shifted in the spectra of metal complexes, which is an evidence of coordination of ligand to metal ions [34]. Electronic spectral data, color and magnetic moment values of the test compounds are listed in Table 3. Complex 1 was exhibited one absorption band at 570 nm which assigned to 6A1→4T1 transition due to tetrahedral geometry. The magnetic moment and green color of the complex are an additional evidence for tetrahedral structure [35,36]. The high-spin complex 2 was showed a weak band at 539 nm owing to 5T2→ 5E transition. In addition, the magnetic moment value as well as yellow color of the complex were ascribed for tetrahedral geometry [37,38]. The four coordinated complex 3 was displayed two peaks at the range 552-645 nm which are closer and assigned to 4A2(F)→4T1(P) transition. The magnetic moment value and blue color of the complex are consistent with tetrahedral stereochemistry [39–41]. Complex 4 was exhibited one absorption band at 624 nm which assigned to 2T2→2Etransition due to tetrahedral geometry [42]. This d-d transition is usually of low molar absorptivity and not greater than 100 L.mol-1.cm-1 [42]. The magnetic moment and orange color of the complex are an additional evidence for tetrahedral structure [43–45]. Metal complexes with white color (5 and 6) did not show d-d electronic transition due to completely filled d10-orbital [41]. Magnetic moment value of the complexes was showed that complex 1 to 4 were paramagnetic while complex 5 and 6 were diamagnetic in nature.
Table 3: Electronic spectra, magnetic moments and geometry of ligands/metal complexes
| Ligand/Complex | Band (nm) | ε (Lmol-1cm-1) | Assignments | µeff (BM) | Geometry |
| 2,2′-bipyridine | 230 | 2243 | π → π* | – | – |
| 275 | 2310 | n → π* | |||
| BDTPA | 260 | 3275 | π → π* | – | – |
| 290 | 2691 | n → π* | |||
| 1 | 245 | 1162 | π → π* | 5.79 | Tetrahedral |
| 293 | 1310 | n → π* | |||
| 570 | 145 | 6A1→4T1 | |||
| 2 | 245 | 1658 | π → π* | 5.25 | Tetrahedral |
| 295 | 1621 | n → π* | |||
| 539 | 107 | 5T2→5E | |||
| 3 | 242 | 2696 | π → π* | 4.24 | Tetrahedral |
| 295 | 2808 | n → π* | |||
| 552-645 | 109 | 4A2(F)→4T1(P) | |||
| 4 | 245 | 1278 | π → π* | 1.96 | Tetrahedral |
| 293 | 1123 | n → π* | |||
| 624 | 96 | 2T2→2E | |||
| 5 | 245 | 1870 | π → π* | Diamagnetic | Tetrahedral |
| 298 | 1664 | n → π* | |||
| 6 | 248 | 1803 | π → π* | Diamagnetic | Tetrahedral |
| 298 | 2240 | n → π* |
Thermal Analysis
Thermogravimetric analysis is a powerful tool to confirm both the composition and stability of the complexes. Table 4 and Fig. 1 represent the proposed chemical change as a function of temperature and corresponding mass loss in each step. 2,2′-bipyridine was decomposed progressively in two steps. The first mass loss of 2,2′-bipyridine was occurred in the range 55 to 138oC having mass loss 16.73% due to elimination C2H2 (Calcd. 16.67). The second mass loss was happened in the range of 139 to 243oC due to deduction of 3C2H2 and C2N2 moleculeswith a found mass loss of 83.27% (Calcd. 83.33%). All metal complexes were decomposed progressively in three steps with almost same trend. In complex 1 the first mass loss was occurred in the range 123 to 209oC having mass loss of 6.27% due to the elimination of 0.5Cl2 molecule (Calcd. 6.17%). The second degradation step was happened in the range of 210 to 358oC with mass loss of 27.27% (Calcd. 27.34%) corresponding to loss of 4C2H2 and C2N2 species. The third step was occurred in the range 359 to 522oC with mass loss of 51.20% (Calcd. 51.17%) due to the deduction of C2H2, 7C2H4, PH3 and H2S molecules. Finally, 15.24% (Calcd. 15.32%) metallic residue remained as MnS. The first thermal decomposition of complex 2 was ensued in the range of 150 to 360oC with mass loss of 6.29% (Calcd. 6.16%) due to the elimination of 0.5Cl2 molecule. The second step was occurred in the range of 361 to 502oC with mass loss of 27.28% (Calcd. 27.29%) corresponding to the loss of 4C2H2 and C2N2 moiety. Third step was happened due to the loss of C2H2, 7C2H4, PH3 and H2S molecules with a found mass loss of 51.02% (Calcd. 51.08%) in the range of 503 to 596oC followed by the formation of 15.39% FeS (Calcd. 15.47%). In complex 3 the first mass loss was ensued in the range 124 to 189oC with mass loss of 6.40% (Calcd. 6.12%) corresponding to the deduction of 0.5Cl2 molecule. The second step decomposition was occurred in the range of 190 to 392oC due to the loss of 4C2H2 and C2N2 species with mass loss of 27.11% (Calcd. 27.15%). The third step was occurred in the range of 393 to 535oC with mass loss of 50.71% (Calcd. 50.81%) due to the loss of of C2H2, 7C2H4, PH3 and H2S molecules, leading finally stable 15.84% CoS as residue (Calcd. 15.91%). The first decomposition of complex 4 was occurred in the temperature range of 160 to 222oC with mass loss of 6.20% (Calcd. 6.08%) corresponding to the loss of 0.5Cl2 molecule. Second decomposition step was happened in the temperature range 223 to 400oC with mass loss of 26.90% (Calcd. 26.96%) due to the loss of 4C2H2 and C2N2 species. Third decomposition step was occurred in the temperature range 401 to 547oC with mass loss of 50.47% (Calcd. 50.46%) corresponding to the loss of C2H2, 7C2H4, PH3 and H2S molecules leading finally to the most stable species copper sulphide as residual product (Found 16.12%; Calcd. 16.50%). The first step of complex 5 was occurred in the range 123 to 295oC having mass loss of 6.25% (Calcd. 6.07%) due to the elimination of 0.5Cl2 molecule. The second degradation step was happened in the range of 296 to 415oC with mass loss of 26.80% (Calcd. 26.91%) corresponding to loss of 4C2H2 and C2N2 species. The third step was occurred in the temperature range of 416 to 562oC with mass loss of 50.40% (Calcd. 50.37%) due to the deduction of C2H2, 7C2H4, PH3 and H2S molecules. Finally, 16.57% (Calcd. 16.64%) metallic residue remained as ZnS. In complex 6 the first mass loss was ensued in the range 146 to 234oC with mass loss of 5.86% (Calcd. 5.59%) corresponding to the deduction of 0.5Cl2 molecule. The second step was decomposition occurred in the range of 235 to 480oC due to the loss of 4C2H2 and C2N2 species with mass loss of 24.67% (Calcd. 24.77%). The third step was occurred in the range of 481 to 604oC with mass loss of 46.31% (Calcd. 46.35%) due to the loss of C2H2, 7C2H4, PH3 and H2S molecules, leading finally stable 23.22% CdS as residue (Calcd. 23.30%).The experimental molecular mass of metal complexes were in good agreement with suggested molecular formula.
Table 4: Thermal decomposition data of the compounds
| Ligand/Complex | Temp. (oC) | Mass loss (%) | Leaving species | Residue | |||
| Theor. | Exp. | Theor. (%) | Exp. (%) | Nature | |||
| 2,2′-bipyridine | 55-138139-243 | 16.6783.33 | 16.7383.27 | C2H23C2H2 and C2N2 | — | — | — |
| 1 | 123-209210-358359-522 | 6.1727.3451.17 | 6.2727.2751.20 | 0.5Cl24C2H2 and C2N2C2H2, 7C2H4, PH3 and H2S | 15.32 | 15.24 | MnS |
| 2 | 150-360361-502503-596 | 6.1627.2951.08 | 6.2927.2851.02 | 0.5Cl24C2H2 and C2N2C2H2, 7C2H4, PH3 and H2S | 15.47 | 15.39 | FeS |
| 3 | 124-189190-392393-535 | 6.1227.1550.81 | 6.4027.1150.71 | 0.5Cl24C2H2 and C2N2C2H2, 7C2H4, PH3 and H2S | 15.91 | 15.84 | CoS |
| 4 | 160-222223-400401-547 | 6.0826.9650.46 | 6.2026.9050.47 | 0.5Cl24C2H2 and C2N2C2H2, 7C2H4, PH3 and H2S | 16.50 | 16.12 | CuS |
| 5 | 123-295296-415416-562 | 6.0726.9150.37 | 6.2526.8050.40 | 0.5Cl24C2H2 and C2N2C2H2, 7C2H4, PH3 and H2S | 16.64 | 16.57 | ZnS |
| 6 | 146-234235 -480481-604 | 5.5924.7746.35 | 5.8624.6746.31 | 0.5Cl24C2H2 and C2N2C2H2, 7C2H4, PH3 and H2S | 23.30 | 23.22 | CdS |
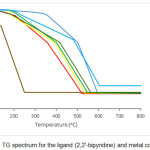 |
Figure 1: TG spectrum for the ligand (2,2′-bipyridine) and metal complexes |
FAB-mass spectra
The data of mass spectroscopic analysis are presented in Table 5. The molecular ion peak of metal complex 1-6 was appeared in the FAB mass spectra at m/z = 570.1, m/z = 571.1, m/z = 573.9, m/z = 577.9, m/z = 578.8 and m/z = 626.2, respectively. Moreover, the complexes (1-6) were showed another characteristic peak at m/z = 535.1, m/z = 536.2, m/z = 538.9, m/z = 542.9, m/z = 543.8 and m/z = 591.2, respectively due to the loss of one chloride ligand [48]. Both molecular ion and characteristic peak of metal complexes were in good agreement with their assigned molecular formula. This further confirmed that the mixed ligand complexes were 1:1 ratio as well as mononuclear composition.
Table 5: Characteristic peaks of FAB-mass spectrum of the mixed ligand complexes
| Complex | [M]+ | [M-Cl]+ | [M-C16H34PS2Cl]+ | [M-C10H8N2Cl] + |
| 1 | 570.1 | 535.1 | 213.9 | 379.1 |
| 2 | 571.1 | 536.2 | 214.9 | 380.1 |
| 3 | 573.9 | 538.9 | 217.7 | 382.8 |
| 4 | 577.9 | 542.9 | 221.8 | 386.9 |
| 5 | 578.8 | 543.8 | 222.6 | 387.8 |
| 6 | 626.2 | 591.2 | 270.1 | 435.2 |
Scanning Electron Microscopy
The surface morphology is one of the characteristics of solid materials. The scanning electron microscope (SEM) uses to evaluate the morphology and particle size of sample. A beam of high-energy electrons of scanning electron microscope creates a variety of signals from the surface of solid matter. These signals provide information about the image of the shape, size of the particles, ductility of substances, strength of materials and how the atoms are arranged in an object. The scanning electron microscope can be as essential tool in metallurgy, forensic science, gemology as well as medical science. From the SEM photographs, the morphology of ligand 2,2′-bipyridine was homogeneously distributed in solid powder. On the other hand, morphology of respective metal complexes was not uniformly distributed and exhibited different structures. The SEM micrographs have been showed that the complexes 1, 2 and 6 were found to be flower like structure. Besides, complexes 3, 4 and 5 were showed small stone like structure.
Antioxidant Activity
Free radicals generate during normal cellular function in body system. Free radicals (such as superoxide anion, hydroxyl radical and hydrogen peroxide) are very reactive. Because of that they interact with proteins, lipids and nucleic acids, may produce various chronic diseases. Therefore, to obstruct the free radical damage in body system, it is important to control drugs that may be rich in antioxidants. Antioxidants have the ability to scavenge free radicals or terminate chain reactions. They play an important role in repairing cellular damage and preventing various human diseases. The scavenging free radical ability of metal complexes is an important property [34,49]. Recently to protect the resultant damage, numerous natural and synthetic free radical scavengers have been developed and studied [22,49]. The newly synthesized mixed ligand complexes were investigated for their antioxidant properties by DPPH radical scavenging method. 1,1-diphenyl-2-picrylhydrazyl (DPPH) shows a strong absorption band at 517 nm due to its odd electron. An antioxidant reacts with it and produces stable 1,1-diphenyl-2-picrylhydrazine. As a result, the band intensity of DPPH decreases [50]. Table 6 demonstrates the free radical scavenging activity of metal complexes and BHT. The decreasing absorbance as well as the lower IC50 value indicate the higher antioxidant activity of test compounds [51,52]. Only the IC50 value of test compounds in descending order was 6 > 4 > 1 > 2 > 3 > 5 > BHT. The complex 5 was found to have better scavenging activity as compared to the standard antioxidant, BHT. The free radical scavenging activity of complex 3 was higher than that of complex 2. In addition, complex 1, 4 and 6 were showed poor scavenging activity as compared to the standard antioxidant.
Table 6: DPPH free radical scavenging activity of metal complexes
| Compounds | |||||||
| 1 | 2 | 3 | 4 | 5 | 6 | BHT | |
| IC50 (ppm) | 2.12 | 1.98 | 1.78 | 2.20 | 1.73 | 2.22 | 1.72 |
| R2 | 0.603 | 0.883 | 0.883 | 0.894 | 0.779 | 0.879 | 0.905 |
R2: correlation coefficient
Antibacterial and Antifungal Activity
The antimicrobial activity of the complexes are presented in Table 7. Both bis(2,4,4-trimethylpentyl)dithiophosphinic acid and 2,2′-bipyridine ligands did not show any activity against test microorganisms. The complex 3 was exhibited very good antibacterial activity against Clostridium botulinum as compared to standard, imipenem. On the other hand, complex 1, 2, 3 and 4 were showed moderate activity against Staphylococcus aureus and Bacillus subtilis. The remaining metal complexes were showed low activity against all bacterial strains. In the case of antifungal study complex 5 was found to be good activity against Aspergillus niger as compared to standard drug, fluconazol. Besides, complex 3 was exhibited moderate activity against Aspergillus flavus and Lecanicillium fungicola. The biological activity of metal complexes depend on the molecular structure, number of chelate rings, polarity of metal complexes, etc. Only lipid soluble substances can pass through the lipid membrane of microorganism. In the present study some mixed ligand complexes were showed less activity due to the lower lipophilicity of the complexes. Because of that the metal complexes could neither block nor inhibit the growth of the microorganisms. While some mixed ligand complexes were displayed greater activity than ligands. The increasing activity of mixed ligand complexes can be explained by chelation theory [33]. The lipophilic nature increases in mixed ligand complexes due to chelation. Therefore, the chelation could increase the ability of metal complex to penetrate through the lipid membrane of test microorganism.
Table 7: Biological activity of the mixed ligand complexes
| Complex/Standard | Zone of inhibition (mm) against bacteria | Zone of inhibition (mm) against fungi | ||||||
| S. pneumoniaee | B. subtilis | S. aureus | S. epidermidis | C. botulinum | A. flavus | L. fungicola | A. niger | |
| 1 | 08 | 10 | 10 | 08 | 08 | 06 | 07 | 07 |
| 2 | 09 | 10 | 09 | 08 | 07 | 08 | 07 | 09 |
| 3 | 08 | 09 | 11 | 07 | 17 | 13 | 10 | 06 |
| 4 | 09 | 10 | 09 | 08 | 06 | 07 | 07 | 09 |
| 5 | 07 | 07 | 08 | 08 | 09 | 09 | 06 | 18 |
| 6 | 07 | 09 | 07 | 08 | 08 | 06 | 08 | 08 |
| Imipenem | 28 | 24 | 22 | 23 | 19 | – | – | – |
| Fluconazole | – | – | – | – | – | 20 | 17 | 23 |
Conclusions
Six new mixed ligand complexes have been successfully synthesized and characterized by various physico-chemical techniques. Based on the experimental data the bis(2,4,4-trimethylpentyl)dithiophosphinic acid was acted as uninegative bidentate ligand. All complexes were showed 1:1 electrolyte in nature. Magnetic moment, color, electronic spectral data, mass and TG observation have been suggested that the geometry of metal complexes were tetrahedral. Thermally the mixed ligand complexes were highly stable.
Acknowledgements
The first author, Tarun Kumar Pal is grateful to Md. Chanmiya Sheikh for SEM, TG and mass analysis. The first author is also thankful to Subrata Paul for providing the facilities to perform antimicrobial assay.
References
- Pal, T. K; Alam, M. A.; Islam, M. A. A. A. A.; Paul, S. R. J. Sci. Res. 2012, 4, 427–435.
CrossRef - Sado, D. G. Y.; Yufanyi, D. M.; Jagan, R.; Agwara, M. O. Cogent Chem. 2016, 27, 1–16.
- Kalia, S. B.; Kaushal, G, Rojila, K. D. J. Therm. Anal. Calorim. 2012, 109, 1463–1471.
CrossRef - Raja, J.D.; Senthilkumar, G. S.; Chinnapiyan, M. V. J. Chem. Pharm. Res. 2015, 7, 1–14.
- Omar, M. M; Abd El-Halim, H. F.; Khalil, E. A. M. Appl. Organomet. Chem. 2017, 31, 1–11.
CrossRef - Joshi, S.R.; Habib, S. I. Int. J. Drug Dev. Res. 2014, 6, 32–38.
- Alias, M.; Ismael, S.; Mousa, S. A. J. Al-Nahrain Univ. 2015, 18, 28–38.
CrossRef - Alam, M. J.; Ullah, M. R.; Akther, M. IOSR J. Appl. Chem. 2018, 11, 1–4.
- Shwetha, K. M.; Krishnamurthy, G.; Prabhakara, M. C. SSRG Int. J. Appl. Chem. 2017, 4, 7–14.
- Thebo, A. A.; Nahyoon, N. A.; Phulpoto, S. N.; Khan, A.; Shah, S. A.; Ali, S. Org. Med. Chem. IJ. 2017, 2, 25–37.
- Akram, S. M. M.; Tak, A. A.; Mustafa, G.; Parray, J. A. Mediterr. J. Chem. 2015, 4, 227–238.
CrossRef - Adekunle, O. F.; Butcher, R.; Bakare, O.; Odunola, O. A. J. Serbian Chem. Soc. 2016, 81, 1251–1262.
CrossRef - Abd El-Halim, H. F.; Omar, M. M.; Anwar, M. N. J. Therm. Anal. Calorim. 2017, 130, 1069–1083.
CrossRef - Vasileiadou, E.; Angaridis, P. A.; Raptis, R. G.; Mathivathanan, L. IUCrData. 2016, 1, x161834.
CrossRef - Bozin, B.; Mimica-Dukic, N.; Simin, N.; Anackov, G. J. Agric. Food Chem. 2006, 54, 1822–1828.
CrossRef - Tabassam, N.; Ali, S.; Shahzadi, S.; Shahid, M.; Abbas, M.; Khan, Q. M. Russ. J. Gen. Chem. 2013, 83, 2423–2437.
CrossRef - Patil, S. A.; Unki, S. N.; Badami, P. S. Med. Chem. Res. 2012, 21, 4017-4027.
CrossRef - Allaka, T. R.; Polkam, N.; Rayam, P.; Sridhara, J.; Garikapati, N. S.; Kotapalli, S. S. Med. Chem. Res. 2016, 25, 977–993.
CrossRef - Zong, G. C.; Ren, N.; Zhang, J. J.; Qi, X. X.; Gao, J. J. Therm. Anal. Calorim. 2016, 123, 105–116.
CrossRef - Chandra, S.; Verma, S. Spectrochim. Acta Part A. 2008, 71, 458–464.
CrossRef - Khalil, M. M. H.; Ismail, E. H.; Mohamed, G. G.; Zayed, E. M.; Badr, A. Open J. Inorg. Chem. 2012, 2, 13–21.
CrossRef - Olanrewaju, A. A.; Tolulope, A. A. O. Chem. Res. J. 2016, 1, 90–96.
- Hasan, M. S.; Kayesh, R.; Begum, F.; Rahman, S. M. A. J. Anal. Methods Chem. 2016, 2016, 1–10.
CrossRef - Osowole, A. A.; Ekennia, A. C.; Osukwe, A. E. Res. Rev. J. Chem. 2013, 3, 32–27.
- Rosu, T.; Negoiu, M.; Circu, V. Analele Univ. din Bucureşti – Chim. 2005, I–II, 153–159.
- Singh, K.; Thakur, R.; Kumar, V. Beni-Suef Univ. J. Basic Appl. Sci. 2016, 5, 21–30.
CrossRef - Sadeek, S. A.; Abd El-Hamid SM. J. Therm. Anal. Calorim. 2016, 124, 547–562.
CrossRef - Abu-Khadra, A. S.; Farag, R. S.; Abdel-Hady, A. D. Am. J. Anal. Chem. 2016, 7, 233–245.
CrossRef - Islam, M. A.; Mumit, M. A.; Pal, T. K.; Alam, M. A. J. Sci. Res. 2012, 4, 635–647.
- Pal, T. K.; Alam, M. A.; Paul, S. R. J. Banglad. Acad. Sci. 2010, 34, 153–161.
- Saglam, E. G. Inorga. Chim. Acta. 2015, 434, 188–197.
CrossRef - Onwudiwe, D. C.; Nthwane, Y. B.; Ekennia, A. C.; Hosten, E. Inorga. Chim. Acta. 2016, 447, 134–141.
CrossRef - Mahmoud, W. H.; Mohamed, G. G.; Mohamedin, S. Y. A. J. Therm. Anal. Calorim. 2017, doi: 10.1007/s10973-017-6482-2
CrossRef - Ejidike, I. P.; Ajibade, P. A. Bioinorg. Chem. Appl. 2015, 2015, 1–9.
CrossRef - Siddiqi, K. S.; Nami, S. A. A.; Chebude, Y. J. Braz. Chem. Soc. 2006, 17, 107–112.
CrossRef - Vellaiswamy, G.; Ramaswamy, S. J Pharm Chem Biol Sci. 2016, 4, 153–159.
- Nami, S. A. A.; Ullah, I.; Alam, M.; Lee, D.; Sarikavakli, N. J. Photochem. Photobiol. B Biol. 2016, 160, 392–399.
CrossRef - Iqbal, M. S.; Khurshid, S. J.; Muhammad, B. Med. Chem. Res. 2013, 22, 861–868.
CrossRef - Ahmed, A. H.; Hassan, A. M.; Gumaa, H. A.; Mohamed, B. H.; Eraky, A. M. Cogent Chem. 2016, 791, 1–14.
- Ikram, M.; Rehman, S.; Islam, N.U.; Jan, N. J. Mex. Chem. Soc. 2011, 55, 164–167.
- Mohamad, M. E. S.; Majed, H. S. Res. J. Pharm. Biol. Chem. Sci. 2017, 8, 723–735.
- Nakahata, D. H.; Ribeiro, M. A.; Corbi, P. P.; Machado, D.; Lancellotti, M.; Lustri, W. R. Inorga. Chim. Acta. 2017, 458, 224–232.
CrossRef - Angel, N. R.; Khatib, R. M.; Jenkins, J.; Smith, M.; Rubalcava, J. M.; Le, B. K. J. Inorg. Biochem. 2017, 66, 12–25.
CrossRef - Zhang, G.; Li, L.; Yang, C.; Liu, E.; Golen, J. A.; Rheingold, A. L. Inorg. Chem. Commun. 2015, 51, 13–16.
CrossRef - Liaqat, M.; Mahmud, T.; Imran, M.; Ashraf, M.; Haq, A. U.; Muddassar, M. Bulg. Chem. Commun. 2018, 50, 37–43.
- Chandran, R.; Antony, S. A. Int. J. Pharm. Sci. Res. 2014, 5, 4339–4350.
- Akter, J.; Hanif, A.; Islam, M. S.; Haque, M.; Lee, S. H.; Banu, L. A. Der Chem. Sin. 2017, 8, 166–174.
- Elsayed, S. A.; Butler, I. S.; Claude, B. J.; Mostafa, S. I. Transit. Met. Chem. 2015, 40, 179–187.
CrossRef - Harikishore, D.; Reddy, K.; Lee, S. J. Serb. Chem. Soc. 2012, 77, 229–240.
- Asghar, F.; Badshah, A.; Butler, I. S.; Tabassum, S.; Lal, B.; Tahir, M. N. Inorga. Chim. Acta. 2016, 442, 46–55.
CrossRef - Tuyen, P.; Xuan, T.; Khang, D.; Ahmad, A.; Quan, N.; Tu, A. T. Antioxidants. 2017, 6, 1–14.
CrossRef - Wright, R.; Lee, K.; Hyacinth, H.; Hibbert, J.; Reid, M.; Wheatley, A. Plants. 2017, 6, 1–8.
CrossRef
Accepted on: April 27, 2018


ISSN Online: 2231-5039

![]()


