A series of Nano-sized metal ion – thiouracil complexes, tem, spectral, γ- irradiation, molecular modelingand biological studies
Khlood Saad Abou- Melha
Chemistry department, Faculty of science of girls, King Khaled University, Saudi Arabia
DOI : http://dx.doi.org/10.13005/ojc/310406
Article Received on :
Article Accepted on :
Article Published : 07 Dec 2015
VO(II), Ni(II), Pd(II), Pt(IV) and UO2(II) complexes were prepared using H5L ligand (C21H15N9S2O3S2). All the prepared complexes are deliberately discussed using different tools(IR, Uv-Vis, 1HNMR, ESR 13CNMR, TGA, TEM, XRD).The octadentate is the main mod of ligand donation, as a neural or trinegativetowards the metal ion. This is verified using molecular modeling as a theoretical tool assert on the stereo structure of the ligand proposed leads to the donation mod. The structural formulas of the complexes were varied in between four to six coordination no. except the VO(II) complex is five. Most investigated complexes are thermally unstable due to the presence of crystal water occluded the coordinating crystal. All the spin Hamiltonian parameters as well as molecular orbital parameters were calculated for VO(II) complex. XRD patterns were investigated to calculate the particle size of each compound and display their nanosized by distinguish values. TEM scenes are also supporting the XRD data. Finally the biological activities were carried out on different bacteria as well as on fungi. The toxic effect was observed especially with Gram positive bacterium (Bacillus subtilis). Also, the effect on DNA degradation was recorded and display a complete degradation by the use of Pt(IV) and Pd(II) complexes. Whereas, a partial degradation was observed with Ni(II) and UO2(II) complexes. But, there is no effect observed with the use of ligand and VO(II) complex.
KEYWORDS:Thiouracil derivative; SEM; Gamma rays; Spectral; Modeling; Biological
Download this article as:| Copy the following to cite this article: Abou- Melha K. S. A series of Nano-sized metal ion – thiouracil complexes, tem, spectral, γ- irradiation, molecular modelingand biological studies. Orient J Chem 2015;31(4). |
| Copy the following to cite this URL: Abou- Melha K. S. A series of Nano-sized metal ion – thiouracil complexes, tem, spectral, γ- irradiation, molecular modelingand biological studies. Orient J Chem 2015;31(4). Available from: http://www.orientjchem.org/?p=13096 |
Introduction
Pyrimidine is the parent heterocyclicthiouracil compounds, its derivative compounds have been extensively studied due to their occurrence in living systems [1], exist in nucleic acids, several vitamins, coenzymes and antibiotics. Pyrimidine derivatives are reported to have broad biological activities suchas anticancer [2], antiviral [3], antibacterial [4], antioxidant[5], anti-inflammatory [6], analgesic activities [7], anxiolytic[8] and antidepressant activities [9]All transition metal ions are known tohave variable coordination number ranging from 3 to 12, and have excellent spacers in assembling fascinatingmetal organic frameworks. Pyrimidines and their derivativesprovide potential binding sites for multi centralmetal ions. The interaction of metal ions with nucleobases is of great interest because of theirrelevance to the essential, medical or toxic bioactivity of metal,where nucleobase molecule can coordinate as exogenous ligandsin metalloproteins[2]. Various metal – Schiff base complexes have interacted through nitrogen and oxygen donoratoms play an important role in biological systems [10]. Schiff base complexes introduce phenolic group as chelating moieties inthe ligand are considered as models for executing important biologicalreactions and mimic the catalytic activities of metalloenzymes[10]. The metal complexes of purines, pyrimidines and their nucleotides play a dominant role in many biochemical systems[11]. Moreover, they have anticancerand fungicidal properties [12]. Furthermore, it has been suggested that the presence of metal ions in biological fluids, could have asignificant effect on the therapeutic action of drugs [13]. In recent years it has been shown that, in many cases, certain metal complexes of more potent than the pure drug.The increase in potency is because binding of a drug with metalions conferred it with some special physicochemical properties helpful in its biological activities; such as low dissociation constant,special redox potential, electron distribution and lipid solubility[4,5].Barbiturates and their derivatives are widely used as sedativehypnotic drugs and are also employed for anaesthesia[14].Compounds containing nitrogen and sulphur donors likethiouracils, have an important role to be used as anti-cancer and anti-viral activities [11]. Synthesis and characterization of barbituric and thiobarbituric acid complexes derived from cobalt(II), nickel(II) and copper(II) salts were reported by Masoud et al[15].Also, barbiturate and thiouracil Cd(II), Hg(II), and Zn(II) complexes have been prepared and characterized [16]. This present study using a multi central thiouracil derivativeto prepare VO(II), Ni(II), Pd(II), Pt(IV) and UO2(II) complexes. The structural formulas will be established based on a spectral analysis.TEM and XRD analysis are too sensitive and used to give insight about the size of the investigated particles. The structural formula of VO(II) complex was investigated before and after irradiation by Gamma rays to give an insight about the deformation on the complex crystal or reflecting its rigidity by the effect of radiation.
Experimental
Reagents
All chemicals used in this study were of analytically reagent grade, commercially available from fulka and used without previous purification as Ni(NO3)2.6H2O, VOSO4.2H2O, PdCl2, H2PtCl6 and UO2(NO3)2 compounds, which represents the metal ions used. All solvents were used as it is without previous purifications.
Synthesis of ligand
0.1 mole of 4-amino-N-(4-aminophenyl)benzamidewas mixed with HCl (0.2 mol in 25 ml distilled water) and diazotized below 50C with NaNO2(0.1mole) in distilled water (30ml). The resulting diazonium chloride was coupled with an alkaline solution of 2- thiouracil (0.1mole) below 50C with equimolar ratio (0.02 mole). The reaction mixture was stirred under reflux for ≈ 1hr. The volume of the resultant solution was reduced to a half by evaporation then the solid product was precipitated, separated, washed with Et2O and dried in vacuum over calcium chloride (Scheme. 1) .
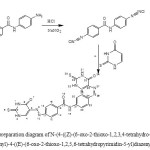 |
Scheme 1: The preparation diagram of N-(4-((Z)-(6-oxo-2-thioxo-1,2,3,4-tetrahydro-6l5-pyrimidin-5-yl)diazenyl)phenyl)-4-((E)-(6-oxo-2-thioxo-1,2,5,6-tetrahydropyrimidin-5-yl)diazenyl)benzamide Click here to View scheme |
Synthesis of metal ion complexes
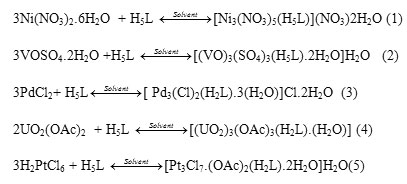
All metal ion complexes were prepared according to equations 1-5, by mixing equimolar (0.01 mole) from each metal salt with the organic ligand (0.01 mole) dissolved previously in ammonia solution (1 : 1, 25ml). The reaction mixture was left overnight where the resulting solid complexes were isolated by filtration, washed several times with EtOH followed by Et2O and dried in a vacuum dissector over anhydrous CaCl2.
Molecular Modeling
Attempt to obtain an acceptable view about the best orientation of several active sites towards each other’s through implemented hyperchem 7.5 program [17]. Molecular modeling structure of the ligand and its complexes were obtained. The geometry optimization in our study is focusing on calculating a total energy content by the use of molecular mechanics (MM+)[18] force – field.
Biological Studies
Antibacterial screening
Antibacterial screening is performed in vitro by the agar disc diffusion method [19]. The species used in the screening are Escherishia coli sp. and Klebsiella sp.as gram – negative bacteria, Bacillus subtilisas gram – positive bacterium. Stock cultures of the tested organisms are maintained on nutrient agar media by sub culturing in Petri dishes. The media are prepared by adding the components as per manufacturer’s instructions and sterilized in the autoclave at 121°C and atmospheric pressure for 15 min. Each medium is cooled to 45 – 60°C, 20ml of it is poured into a Petri dish and allowed to solidify. After solidification, Petri plates with media are spread with 1.0 ml of bacterial or fugal suspension prepared in sterile distilled water. The wells are bored with cork borer and the agar plugs are removed. To each agar well, unique concentration of 100 µg for each compound in DMSO (75 μl) were applied to the corresponding well (6 mm). All the plates are incubated at 37°C for 24 h and they are observed for the growth inhibition zones. The presence of clear zones around the wells indicate that the ligand and its complexes are active. The diameter of zone of inhibition is calculated in millimeters. The well diameter is deducted from the zone diameter and the values are tabulated.
Genotoxicity
A Calf thymus DNA (2 mg) was dissolved in 1 ml of sterile distilled water and completed to a final concentration of 2 g / l. Stock concentrations of the ligand and their complexes were prepared by dissolving 2 mg/ml in DMSO. An equal volume of each compound and DNA were mixed thoroughly and kept at room temperature for 2-3 h. The effects of the chemicals on the DNA were analyzed by agarose gel electrophoresis. A 2 ul of loading dye was added to 15 ul of the DNA-chemical mixture before being loaded into the wall of an agarose gel. The loaded DNA-chemical mixtures were fractionated by electrophoresis, visualized by UV and photographed.
Physical measurements
The elements content (carbon, hydrogen and nitrogen) were determined using a Perkin-Elmer CHN 2400 in the Micro-analytical Unit. The Cl and metal content were determined using standard methods[20].The uraniumcontent in its complex was determined through theignition of 0.1 g using Bunsen flame for 15 min. After that, the crucible was ignited in a muffle at 1000 0C to constant weight for U3O8. IR spectra were recorded on a Mattson 5000 FTIR Spectrophotometer (4000–400 cm-1) using KBr pellets. The UV–Vis., spectra were determined in the DMSO solvent with concentration (≈ 1.0×10⁻³ M) using Jenway 6405 Spectrophotometer with 1cm quartz cell, in the range 200–800 nm. Molar conductance were measured using Jenway 4010 conductivity meter for the freshly prepared solutions at 1.0×10⁻³ mole in DMSO solvent. Magnetic measurements were carried out on a Sherwood Scientific magnetic balance using Goy method. The balance calibration was carried out by two good solid calibrants, Hg[Co(CNS)4] and [Ni(en)3](S2O3). They are easily prepared in pure state, do not decompose or absorb moisture and pack well. Their susceptibilities at 20°C are 16.44×10⁻⁶ and 11.03×10⁻⁶c.g.s. Units, decreasing by 0.05×10⁻⁶ and 0.04×10⁻⁶ per degree temperature raise respectively, near room temperature. Here we are used Hg[Co(CNS)4] only as calibrant.1 HNMR spectrum of the organic compound and its Pd(II), Pt(IV), Ni(II) and UO2+2complexes were recorded on Varian Gemini 200 MHz spectrometer using DMSO-d6 as solvent. ESR spectrum of solid VO(II) complex was obtained on a Bruker EMX Spectrometer working in the X-band (9.808GHz) with 100 kHz modulation frequency. The microwave power was set at 1 mW, and modulation amplitude was set at 4 Gauss. The low field signal was obtained after 4 scans with a 10 fold increase in the receiver gain. A powder spectrum was obtained in a 2 mm quartz capillary at room temperature. A 60Co gamma cell (2000 Ci) was used as a gamma ray source with a dose rate of 1.5 Gy/s (150 rad/s) at a temperature of 30oC. The investigated samplewas subjected to the same gamma dose every time. Using a Fricke dosimeter, the observed dose in water was utilized in terms of dose in glass. No cavity theory correction was made. Each sample was subjected to a total dose of (8 Mrad = 8 X10⁴Gy).X-ray diffraction patterns of the samples were recorded on a X Pert Philips X-ray diffractometer. All the patterns were obtained by using Cu Kα1 radiation, with a graphite monochromator at 0.02o/min scanning rate. The metal complexes were made in the form of tablets, which have ≈ 0.1 cm thickness, under a pressure of approximately 5 X10⁷Pa. Transmittance Electron Microscopy(TEM) images was taken in Joel JSM-6390 equipment. Thermogravimetric and its differential analysis (TGA/DTG) were carried out( 20-900 oC) in dynamic nitrogen atmosphere (30 ml/min) with a heating rate of 10 °C/min using a Shimadzu TGA-50H thermal analyzer. The biological activity screening was tested in the Molecular biology Lab.
Results and Discussion
The elemental analysis and some physical characteristics are summarized in Table 1. All the isolated complexes are relatively stable in air, they having higher m.p. They are insoluble in H2O and most organic solvents except DMSO and DMF, some are completely soluble. The molar conductivity measurements for 1.0 X 10⁻³ mol in DMSO solvent reveal the conducting feature for Pd(II) complex(62 ohm-1cm2mol-1) but nonconducting feature of all others.
IR spectra of complexes
The IR significant bandsserve in proposingthe coordination mod of the ligand towards the metal ions are abstracted and displayed in Table 2. Such multi donationcenterlligand may coordinate by different waysto produce coordination sphere occluded with three central atoms. TheH5L spectrum exhibits an intense characteristic bandsfor its tautomer (keto/ enol)forms. Such was verified applying Hyperchem program through calculating their internal energies (Fig. 1).A small differencein between is found with the priority of a keto form (total energy of keto = 43.1981, enol= 45.2034 kcal/mol).The spectrum displays, bands assigned for υ OH and υ NHs at 3424, 3192and 3085cm-1; bands at 1705, 1315 and 1684 cm-1 assigned for υ C=O, δ OH and δ NHs. Moreover, bands at 1174, 1565 and836 cm-1are assigned to other characteristic bands as υ(C-O), υI(C=S)+υ(N=N) and υIV(C=S)[21]. Octadentate mod is the coordination behavior of multicentral matrixligand by a neutral or trinegative donation. Characterizing the coordination sites is referring to the lower shift recorded for the bands in concern.The spectra of[Ni3(NO3)5(C21H15N9S2O3S2)](NO3)2H2O and[(VO)3(SO4)3(C21H15N9S2O3S2)2H2O]H2O complexes display lower shifted appearance of υ(C=O), υ(C=S) and δNH bands. Thisproposes their participation in coordination towards Ni(II) and VO(II) ions. Ni(II) complex spectrum, displays significant bands at 1670 and1420cm-1attributed to υas(NO3)and υs(NO3) monodentate appearance as well as,a band at 1340cm-1is carracteristic foranioic nitrate[22]. The VO(II) complex displays new specific bands appeared at 1412 and 1262 cm-1assigned to monodentateυ(SO4)vibration bands.Another band attributed to υ(V=O) transition is appeared at 1001cm-1 contributed to a square pyramidal geometry [23]. A complete obscure for υ(C=N) band may suggest the overcoming of a neutral state in coordination. Bands at ≈ 3500, ≈ 870 – 890 and ≈ 720 – 740 cm-1are assigned to stretching (υOH) and bending vibrations of coordinating water molecules[23].While, a trinegative octadentate coordination mode is proposed for the interaction of the ligand towards [Pd3Cl2(C21H12N9S2O3S2)3H2O]Cl.2H2O,[Pt3Cl7(C21H12N9S2O3S2)(OAc)2.2H2O]H2Oand[(UO2)3(OAc)3(C21H12N9S2O3S2)H2O]complexes.A complete obscure for υ(C=O) band as well as the appearance of lower shifted bands assigned to υ(C=N) and υ(C-O)(≈1120cm-1) vibrations proposes the coordination of the ligand in its enolized form. This may refer to the use of a mild basic acetate salt or through the adjustment of the coordination medium.Lower shift observed with υ(C=S) bands introduces the other coordination site.The bands appeared at 947 and 839 cm-1 assigned for υ3 and υ1 of dioxouranium [24]. The value of υ3 is used to calculate the force constant (F)of O=U=O by the method of McGlynn and smith [25]: (υ3)2= (1307)2(FU-O) / 14.103. The constant calculated for the complex is found to be 7.4 mdyn/A0. This value was then substituted into Jones relation : RU-O = 1.08(FU-O)-1/3 + 1.17. The value of RU-Ois found = 1.724 for the complex. The calculated FU-O value falls in the usual range for the uranyl complexes [26].The appearance of new bands at 1673,1520 and 1421 cm-1 assigned for υas(OAc) and υs(OAc) vibrations, the higher difference in between (252cm 1)proposed a monodentate coordination, even the lower difference (99cm-1) propose the bidentate coordination nature [27]. In Pt(IV) complex, the same bands appeared at 1700 and 1550 cm-1assigned for monodentateacetate used to adjust the coordination medium. More or less unshifted υN=N band (≈ 1565 cm-1) reflects the rouling out of azo groups.All the spectra, display new bands at: 589- 550, 450- 544 and 421- 460 cm-1ranges,assigned for υ M-O, υ M-N and υ M-S vibrations but, υ M-Cl cannot detected at the scanning range [28].
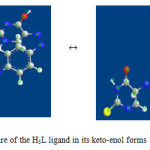 |
Figure 1: The modeling structure of the H5L ligand in its keto-enol forms Click here to View figure |
1HNMR Spectra
Theproton magnetic resonance spectra of free ligand, Pd(II), Ni(II), Pt(IV) and UO2+2 complexes were performed in d6 –DMSO. The spectra are considered a verifying tool for IR data especially with the organic ligand and diamagnetic complexes. The chemical shifts were recorded as follows: 1HNMR spectrum of H5L, δ(ppm): = 2.40 (s, for DMSO), δ = 2.10 (s,NH3,33,pyrimidine), δ = 7.20- 7.90 (m, aromatic), δ = 8.0(s, 3NH1,18,31, pyrimidine), δ = 12.5 (s, OH, enolized ligand). TheNi(II)complex spectrum displays: δ (ppm)= 3.24 (s, H2O in complex), δ = 2.51(s, NH3,33) and δ = 8.42 (s, 3NH1,18,31, pyrimidine). While, the spectra of Pd(II), Pt(IV) and UO2(II) complexes display complet obscure for NH1,18,31 signals around δ ≈ 8, δ = 3.25-3.34(s, H2O in complex), δ = 2.20-2.26(s,NH3,33,pyrimidine). The ligand spectrum displays signals support the tautomer geometries proposed.The 1HNMR spectraldata of the investigated complexes are considered a further support for that abstracted from IR. TheNi(II)complex spectrum displays downshifted appearance for NH1,18,31peaks, even their complete obscure in other spectra[29].
Table 1 : Analytical and Physical data for the H5L and its metal complexes
| Compound |
Color |
Elemental analysis (%) Calcd. (Found) | |||||
|
C |
H |
N |
M |
Cl |
|||
| 1)[ C21H15N9S2O3S2] |
Brown |
49.89(49.88) |
2.99(2.99) |
24.93 (25.10) |
—– |
—— | |
| 2)[Ni3(NO3)5(C21H15N9S2O3S2)](NO3).2H2O |
yellow |
23.15(23.13) |
1.76(1.77) |
19.28(19.38) |
16.16(16.27) |
—— | |
|
3)[Pd3Cl2(C21H12N9S2O3S2)3H2O]Cl.2H2O |
Brown |
24.77(24.81) |
2.18(2.20) |
12.38(12.25) |
31.35(31.31) |
10.45(11.00) | |
| 4)[Pt3(Cl)7(C21H12N9S2O3S2)(OAc)2.2H2O]H2O |
Yellow |
19.91(19.82) |
1.60(1.64) |
8.36(8.34) |
38.81(38.82) |
16.46(16.30) | |
| 5)[(VO)3(SO4)3(C21H15N9S2O3S2).2H2O] H2O |
Olive green |
24.05(23.97) |
2.02(2.01) |
12.02(11.97) |
14.57(14.51) |
—— | |
| 6)[(UO2)3(OAc)3(C21H12N9S2O3S2)H2O] |
Yellow |
21.51(21.52) |
1.54(1.51) |
8.36(8.42) |
47.36(47.25) |
—— |
|
Electronic Spectra and magnetic measurements
The Uv – Vis spectra recorded in DMSO solvent and the magnetic moment measurments are considered the most essential for proposing the stereo structure of the investigated complexes. The spectral data used to propose the structural formula are displayed in Table 3. The ligand spectrum shows intraligand transition bands at 33,530 and 25,240 cm-1. An absorption band at 33,530 cm-1 can be assigned to π → π* transition while,a broad band appeared at 25,240 cm-1 may be assigned to a charge transfer (n → π*)transition[30]. A spectrum of[Ni3(NO3)5(C21H15N9S2O3S2)](NO3).2H2Ocomplex (Fig. 2)displays absorption bands at 33,333 and 28,571 cm-1 attributed to intraligand transition.These bands appeared by little shift due to the coordination of concerned function groupsmay effect on the electron transfer. Also, a band at 20,000cm-1isassigned to 1A1g→ 1A2gtransition in a square-planar configuration [31]. This is supported by diamagnetic feature agrees with the low spin d8. The complex reflects the trend of increasing the size of the ligand the lower shift in the energy of the maxima d –d bands, presumably due to weakening of the coordinate bond with increased bulkiness of the ligand [32,33].The spectrum of[Pd3Cl2(C21H12N9S2O3S2)3H2O]Cl.2H2Ocomplex displays two bands at 20,000 and 23,809 cm-1corresponding to 1A1g → 1A2g and 1A1g → 1B1g,d –d transition. The bands appeared below 470 nm have been reported as due to both distorted square planar or undistorted square planar Pd(II) complexes. The broad bandin this region is assigned to dz2 →dx2y2 transition [34]. This general feature pertains to the low-spin d8 metal ion complexes with square-planar geometry[35].The spectrum of[Pt3(Cl)7(C21H12N9S2O3S2)(OAc)22H2O]H2O complex displays absorption bands at 33,333; 28,570 and 25,000 cm-1. Bands at 33,333 and 28,570 are attributed to intraligand transitions. The absorption bands at 25,000and 21,680 cm-1is attributed to LM charge transfer transition [36].Previous studies proved that the band in theregion 25,000–26,040 cm−1is assignable to S(σ)→M transition,the 20,600 cm−1band is due to S(π) →M transition [20] whereas, the band at 21,790–24,750 is due toO→M(II).The low spin octahedral geometry is the known geometry with d6 systems. The spectrum of [(VO)3(SO4)3(C21H15N9S2O3S2)2H2O]H2O complex displays well defined bands at12,180and 16,100 cm-1 assigned for 2B2→2E2(υ1) and 2B2→2B1(υ2) in a square-pyramidal configuration (Fig. 2) [36]. A weak band at 24,390cm-1can be assigned to ligand-metal charge transfer (LMCT). Magnetic moment of each vanadyl(IV) center was measured at room temperature (μeff = 1.58BM). The magneticmoment values of the vanadyl complexes ranges 1.71 -1.76 B.M which correspond to d1 system.It was proposed earlier that υ(V=O) vibration band appeared at ≈ 970 cm-1 as well as, a dark green colorare supporting asquare – pyramidal geometry for VO2+complexes[37].The spectrum of[(UO2)3(OAc)3( C21H12N9S2O3S2)H2O]complex reveals intraligand transition bands at 32,333 and 27,570 cm-1 as well as charge transfer bands at 25,000 and 20,000 cm-1attributed to OUO symmetric stretching frequency for the first excited state [38]. While, the band at 32,333 cm-1 is assigned to a charge transfer transition probably O→ U. Some complexes exhibit bandsat the ranges 22,624 – 25,000 and 25,000 – 27,933cm-1. The first range is assigned to S → M transition and the second assigned to O → M charge transfer [39]. The diamagnetic appearance of Pd(II), Pt(IV) and UO2+2 complexes are expected with such d6systems.
Table 2: Assignments of the IR Spectral characteristic bands(cm-1) of H5Land its metal complexes
|
Compound |
nOH |
nNHs | nIC=S | nC=O | δNHs | nIVC=S | δOH | nN=NυC=N | nM-O | nM-N | nM-S |
| 1)[C21H15N9S2O3S2] | 3424 | 3192 | 1565 | 1705 | 1684 | 836 | 1315 | 15651604 | —- | …… | ….. |
| 2)[Ni3(NO3)5(C21H15N9S2O3S2)](NO3).2H2O | 3400 | 3210 | 1530 | 1680 | 1660 | 770 | 1330 | 1560—- | 550 | 510 | 460 |
| 3)[Pd3Cl2(C21H12N9S2O3S2)3H2O]Cl.2H2O | 3425 | 3200 | 1520 | — | 1656 | 758 | 1323 | 15661580 | 581 | 544 | 421 |
| 4)[Pt3Cl7(C21H12N9S2O3S2)(OAc)22H2O]H2O | 3455 | 3107 | 1534 | —- | 1663 | 770 | 1323 | 15651586 | 530 | 510 | 435 |
| 5)[(VO)3(SO4)3(C21H15N9S2O3S2)2H2O] H2O | 3420 | 3087 | 1542 | 1670 | 1637 | 762 | 1318 | 1564— | 589 | 547 | 453 |
| 6)[(UO2)3(OAc)3(C21H12N9S2O3S2)H2O] | 3450 | 3100 | 1537 | —- | 1633 | 759 | 1380 | 15661576 | 580 | 450 | 440 |
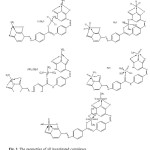 |
Figure 2: The geometries of all investigated complexes
|
Molecular modeling
A trail to gain a better viewon the molecular structure of the ligand and its complexes. The atomic numbering scheme and the theoretical geometry structures for the ligand in its keto-enol forms are calculated. The molecular parameters: total energy, binding energy, isolated atomic energy, electronic energy, heat of formation, dipole moment, HOMO and LUMO were calculated and represented in Table4 by the use of molecular mechanics force field as implemented in hyperchem 7.5 [17]. The data represent a small difference inbetweenketo-enol forms stabilities with the ketoperior. The drown structures of the free ligand displays best orientation of the active sites which reflects the stable stereo structure includes the lowest internal energy. The geometrical arrangement of the sites is welling to the coordination of the ligand as multidentate donor towards poly nucleus.Such supports the mode of coordination proposed.
Table 3: Magnetic moments (BM) and electronic spectra bands (cm-1) of the complexes
| Complex | μeff (BM) | d-d transition(cm-1) | Intraligand and charge Propose transfer bands structure
(cm-1) |
| 2)[Ni3(NO3)5(C21H15N9S2O3S2)](NO3).2H2O |
Dia |
20,000 | 33,333; 28,571 Square- planar |
| 3)[Pd3Cl2(C21H12N9S2O3S2)3H2O]Cl.2H2O |
Dia |
20,000; 23,809 | 33,333 ; 28,571 Square- planar |
| 4)[Pt3(Cl)7(C21H12N9S2O3S2)(OAc)22H2O]H2O |
Dia |
————- | 33,333; 28,570;25,000 Octahedral21,680 |
| 5)[(VO)3(SO4)3( C21H15N9S2O3S2).2H2O] H2O |
1.58 |
12,180;16,100;24,390 | 33,333; 28,571 Square-pyramidal |
| 6)[(UO2)3(OAc)3(C21H12N9S2O3S2)H2O] |
Dia |
—————- | 32,333;27,570;25,000; 20,000 Octahedral |
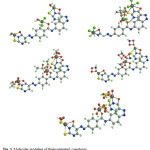 |
Figure 3: Molecular modeling of theinvestigated complexes Click here to View figure |
Thermogravimeric Analysis
The fragmentation data abstracted from thermal analysis were displayed in Table 5. All of investigated complexes are displaying three degradation stages introducing alower thermal stability except UO2(II) complex. This behavior is supporting the presence of crystal water molecules associated physically with Ni(II),Pd(II),Pt(IV) and VO(II) complexes.The TG curve of [Ni3(NO3)5(C21H15N9S2O3S2)](NO3).2H2O complex, displays the following stages; the first stageat 75-150 oC range is attributed to the removal of two water molecules physically attached with the complex as well as two oxides from nitrates by 14.66 (calcd. 14.69%) weight loss. The second degradation stage at 260-400oCrange may be attributed to the removal of remaining nitrates as oxides by 22.65(calcd. 22.76 %) weight loss. The third degradation stage at 450-610 oCrange may be attributed to the removal of a great organic part by35.39(calcd. 35.38 %) weight loss. The residual part was recorded at 650oC may be for3(NiO)+ 6C by 27.30(calcd. 27.18 %) weight percentage. The TG curve of [Pd3Cl2(C21H12N9S2O3S2)3H2O]Cl.2H2Ocomplex displays the following degradation stages; the first stage at 70-95oC range is attributed to the removal of two crystal waters by 3.44 (calcd. 3.54 %) weight loss. The second stage at 160-300oCrange may be attributed to the removal of 3H2O +1.5Cl2by 15.76(calcd. 15.75 %) weight loss. The third stage at 350-500 oCrange may be attributed to the removal of all organic molecule except 12C atoms by 36.23(calcd. 35.20 %) weight loss. The residual part was recorded at 620 C ois attributed toresidual 3Pd polluted with 12C atoms, by 44.57(calcd. 45.51 %) weight. The TG curve of [Pt3(Cl)7(C21H12N9S2O3S2)(OAc)22H2O]H2Ocomplex displays the following degradation stages; the first stage at 95-202.2oCrange is attributing to the removal of 3H2O+3.5Cl2 molecules by 20.11 (calcd. 20.04 3.19%) weight loss. The second stage at323.7-562.9oCrange may be attributed to the removal of an organic part by 7.82(calcd. 7.83 %) weight loss. The third stageat 562.9-638.8oCrange may be attributed to the removal of a still organic fraction except carbon residual part by 23.75(calcd. 23.76 %) weight loss. The residual part is recorded at 650oCincludes the metal atoms polluted with 12C atomsby 48.32(calcd. 48.37 %)weight. The TG curve of [(VO)3(SO4)3(C21H15N9S2O3S2)2H2O]H2Ocomplex displays the following degradation stages; the first stageat 65-120oCrange is attributed to the removal of 3H2O beside the oxides from sulphatesby 14.23(calcd. 14.31 %) weight loss. The second stage at 210-350oCrange may be attributed to the removal of still sulphate oxides by 17.98(calcd. 18.32 %) weight loss. The third stage at 400-580oCrange may be attributed to the removal of a great organic part by 36.68(calcd. 36.76 %) weight loss. The residual part was recorded at 620oC includes V2O4 polluted with carbon atoms by 31.11(calcd. 30.60 %)weight percentage.The TG curve of [(UO2)3(OAc)3( C21H12N9S2O3S2)H2O]complex displays the following degradation stages. The first stage at 134-203 oCrange is attributed to the removal of H2O+ C2H3O2 molecules by 5.02(calcd. 5.11 %) weight loss. The second stageat204-377 oCrange may be attributed to the removal of C4H6O4 molecule by 7.91(calcd. 7.83 %) weight loss. The third stage at521-646oCrange may be attributed to the removal of a remaining organic part by 31.11(calcd. 31.21 %) weight loss. The residue recorded at 660 oCincludes U3O8 by 55.96(calcd. 55.85 %) weight. Sometimes a small difference found in between the calculated and found weight loss, such is referring to the overlapping between the following steps. This is prohibiting the accurate determination of the initial and the final of the step.
Table 4: The molecular parameters of the ligand keto-enol forms
|
The assignment of the theoretical parameters |
The compound |
The theoretical data |
| Total Energy |
H5L (keto form) |
= -125156.6583019 (kcal/mol) |
| Total Energy | = -199.449805963 (a.u.) | |
| Binding Energy | = -5576.4948169 (kcal/mol) | |
| Isolated Atomic Energy | = -119580.1634850 (kcal/mol) | |
| Electronic Energy | = -999035.7683637 (kcal/mol) | |
| Core-Core Interaction | = 533853.2109341 (kcal/mol) | |
| Heat of Formation | = 122.2021831 (kcal/mol) | |
| Dipole moment | = 4.49 (Debys) | |
| Homo | = -9.043045 | |
| Lumo | = -1.8895 | |
|
Total Energy |
H5L( Enol form) |
= -125871.8581134 (kcal/mol) |
|
Total Energy |
= -200.589549270 (a.u.) |
|
|
Binding Energy |
= -5688.7417224 (kcal/mol) |
|
|
Isolated Atomic Energy |
= -120183.1163910 (kcal/mol) |
|
|
Electronic Energy |
= -1000906.6456590 (kcal/mol) |
|
|
Core-Core Interaction |
= 875034.7875456 (kcal/mol) |
|
|
Heat of Formation |
= 114.1592776 (kcal/mol) |
|
|
Dipole moment |
= 4.228 (Debys) |
|
|
Homo |
= -8.876161 |
|
|
Lumo |
= -2.099653 |
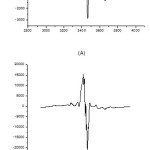 |
Figure 4: The EPR spectrum of VO(II) complex, before(A) and after γ- irridation,(B) Click here to View figure |
EPR spectra
The EPR spectrum of VO2+ complex was carried out at room temperature before and after γ – irradiation (Fig.4 ,a and b) for the complex to investigate its effect on the complex geometry which may occure. The spectrum of the complex before irradiation, exhibits an eight-line pattern corresponding to the usual parallel and perpendicular components of g– and hyperfine (hf)A-tensors. In which, the parallel and perpendicular components are well resolved. Nitrogen super hyperfine splitting is not observed in the complex, which indicates that the unpaired electrons in the dxyorbital [40] are coordinated. The pattern suggests that g and A are axially symmetric in nature. The spin Hamiltonian parameters abstracted from the spectrum are given inTable 6 with MO parameters computed from experimental data.The parameters A and g are found to be in agreement with thevalues generally observed for the vanadyl complex with squarepyramidalgeometry [41]. The molecular orbital coefficient α2and β2 were calculated using the following equations [42]:

The negative values of β2 lead to negative values of α2. Sincehyperfine coupling constants are negative, calculations weredone taking A//and A⊥as negative, which gave positive valuesof β2 and α2. In this study, α2andβ2values indicate that, more ionic character of in -planeσ bonding and the in-plane π bonding.
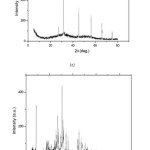 |
Figure 5: XRD spectra of , a) Ni(II), b) Pt(IV), c) Pd(II), d) VO(II) ,e)UO2(II) complexes and free ligand (f) Click here to View figure |
Thespectrum of the complex shows two bands at 16,000 cm−1 (E1)and 12,800 cm−1 (E2) which are assigned to 2B2→2B1 and2B2→2E, transitions, respectively. Assuming pure d-orbital’sand using first- and second-order perturbation theory, the spinHamiltonian parameters can be related to the transition energiesby the following expressions:g// = ge – ( 8λ ⁄ E1) and g⊥= ge – (2λ ⁄ E2)
Table 5: Thermogravimetry data of the investigated complexes
|
Complex |
Steps |
Temp. range (Co)
|
Decomposed assignments | Weight lossFound (Calcd. %) |
| (2) | 1st2nd
3rd residue |
75-150260-400
450-610
|
-2 H2O+O2+2NO2– 2O2+4NO2
-C15H12N9S2 3(NiO)+6C |
14.66 (14.69)22.65(22.76)
35.39(35.38) 27.30(27.18) |
| (3) | 1st2nd
3rd residue |
70-95160-300
350-500 |
-2H2O- 3H2O +1.5Cl2
– C9H12N9O3S2 3Pd+12C |
3.44 (3.54)15.76(15.75)
36.23(35.20) 44.57(45.51)
|
| (4) | 1st2nd
3rd residue |
95-202.2323.7-562.9
562.9-638.8 |
-3H2O+3.5Cl2– C4H6O4
– C9H12N9O3S2 3Pt+12C |
20.11 (20.04)7.82(7.83)
23.75(23.76) 48.32(48.37)
|
| (5) | 1st2nd
3rd residue |
65-120210-350
400-580 |
-3H2O+ SO2+O2– 2SO2+O2
– C15H12N9S2 V2O4+6C |
14.23(14.31)17.98(18.32)
36.68(36.76) 31.11(30.60)
|
| (6) | 1st2nd
3rd residue |
134-203204-377
521-646 |
– H2O+ C2H3O2-C4H6O4
– C21H12N9OS2 U3O8 |
5.02(5.11)7.91(7.83)
31.11(31.21) 55.96(55.85) |
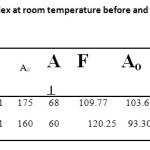 |
Table 6: ESR data of VO (II) complex at room temperature before and after γ– irradiation (A and P x10-4 cm-1) |
where ge is the free-electron g value (2.0023). Using E1 andE2 values, the spin–orbital coupling constant (λ) value (163.6)is evaluated. A value for λ of 250 cm−1 is reported [38] for the free V4+ ion. A strong reduction in the magnitude of λ for the double bonded oxovanadium complex (V= O)2+ is attributed to substantial π bonding as well as a strong spin orbital coupling in between vanadium and the ligand sites. While, the value is within the reasonable limits of predicated values.
Calculation of dipolar term (p)
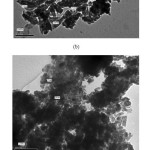 |
Figure 6: The TEM images of , a) Ni(II) , b) Pt(IV), c) Pd(II) and VO(II) (d) complexes Click here to View figure |
The p value is calculated from the following equation:

If A//is taken to be negative and A⊥positive, the p value will bemore than 270 G, which is far from the expected value. Thus, thesigns of both A//and A⊥are taken as negative and are indicatedin the form of isotropic hf constant (A0). McGarvey the oreticallycalculated the value of p to be +136G for vanadyl complexes[43] and the value (124.57) of this complex do not deviate much from this expected value.
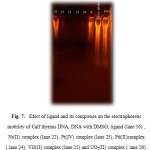 |
Figure 7: Efect of ligand and its complexes on the electrophoretic mobility of Calf thymus DNA, DNA with DMSO; ligand (lane 16) , Ni(II) complex (lane 22), Pt(IV) complex (lane 23), Pd(II)complex ( lane 24), VO(II) complex (lane 25) and UO2(II) complex ( lane 26). Click here to View figure |
Calculation of MO coefficients and bondingparameters
The g values observed so far for most vanadyl complexes aregenerally lower than 2.0023 and the data in this work supportthis observation. This lowering is related to the spin–orbit interactionof the ground state dxy level with low-lying excited states.The isotropic and anisotropic (g and A) parameters have beencalculated from equations:Ao = (A11 + 2 A⊥) ⁄ 3 go = (g11 + 2 g ⊥) ⁄ 3
Table 7: XRD spectral data of the highest value of intensity of the H5L ligand and its complex
| Compound |
Size of particles (nm) |
2θ |
Intensity |
d spacing (oA) | FWHM |
| H5L | 0.0944 | 33 | 1070 | 2.712 | 1.6 |
| Ni(II) complex | 0.2612 | 28 | 970 | 3.184 | 0.5714 |
| Pt(IV) complex | 0.2812 | 32 | 1320 | 2.795 | 0.5357 |
| Pd(II) complex | 0.4669 | 32 | 680 | 2.795 | 0.3226 |
| VO(II) complex | 0.2479 | 31 | 440 | 2.882 | 0.6061 |
| UO2(II) complex | 0.2031 | 32 | 500 | 2.795 | 0.7407 |
Table 8: The values of zone inhibition of bacteria for the effect of ligand and its metal complexes.
|
Compound |
Zone of inhibition (mm) |
|
|
|
Bacillus subtilis Gram (+) bacteria |
Klebsiella sp. Gram (-) bacteria |
Proteus sp. |
|
|
1) H5L 2) Ni(II) 3)Pd(II) 4)Pt(IV) 5)VO(II) 6)UO2(II)
|
1.9R 2.3S 0.0R 1.5R 2.3S 2.1S |
0.0R 0.0R 0.0R 0.0R 0.0R 0.0R |
0.0R 0.0R bacteriostatic bacteriostatic 0.0R 0.0R |
Taking A//and A⊥to be negative values the expression for K is[44]:Thus K (Fermi-contact term) can be evaluated (0.963) which indicates a higher interaction between σ or π electrons with the metal nuclous.The spectrum of γ- irridated complex displays a clear hyperfine splitting. High intense and sharpness appearance for the eight – lines, even the parameters calculated from the spectrum did not deviate much from that aforementioned. This my reveal the absence of significant changes in the complex geometry, just a slight deformation in the crystal.Also, this reflects the rigidity of the complex metal bonds which is expected with such chelated complexes.
X – Ray powder diffraction and TEM scan
demonstrates the XRD patterns of the synthesized compounds were carried out in order to give an insight about the lattice dynamics of the compounds. The diffractions were recorded by using Cu Ka radiation (1.5406 Å). The intensity were collected over a 2h range of 0–80o. The patterns obtained reflect shadow on the fact that each solid represents a definite compound of a definite structure which is not contaminated with starting materials. This identificationwas done by the known method [45]. The mean grain size (D) of the particles was determined from the XRD line broadening measurement usingthe Scherrer equation: D = 0.89λ/(β cosθ). Where λ is the wavelength (Cu Kα), β is the full width at the half-maximum (FWHM) and θ is the Bragg diffraction angle. A definite line broadening of the diffraction peaks indicate that the synthesized ligand and its complexes are in the nanometer range( Fig. 5). The lattice parameters calculated were also in agreement with the reported values.A shift in defiant diffraction peaks of complexes was observed and suggesting a contribution of the referring groups. The θ, d values, full width at half maximum (FWHM) of prominent intensity peak, relative intensity (%) and particle size of compounds were presented in Table 7. The diffraction peaks of the ligand, Pd(II), Ni(II), VO(II), Pt(IV) and UO2(II) complexes were observed at 2θ/d-value (Å) = 33/2.712, 32/2.795, 28/3.184, 31/2.882, 32/2.795 and 32/2.795, respectively. The crystallite size was calculated by applying FWHM of the characteristic peaks using Deby – Scherrer equation: B = 0.94 λ/(S cos θ). Where, S is the crystallite size, θ is the diffraction angle, B is the line width at half maximum height,Cu/Kα (λ)= 1.5406 Aoand the d- spacing were determined by using Bragg equation: nλ = 2dsin(θ)at n = 1.Transmission electron microscopy (TEM) is a sensitive tool used to obtain a direct information about themicrostructure, surface morphology, particle size and chemical composition of respective thiouracil ligand and most of its complexes (Fig. 6). The TEM images were obtained in a neutral aqueous medium. The uniformity and similarity between the particles forms of synthesized complexes indicate that the existence of morphological phases have a homogeneous matrix. The diameter of particles are found in nano range as fellow : Ni(II), 8- 14nm; Pt(IV), 19 – 45 nm; VO(II), 14-20 nm; Pd(II), 7- 14 nm. The nanoparticals sized complexes may serve strongly in different application fields inbetween the biological one. Such is clearly observed with the biological investigation results with definite complexes.
Biological activity
The antimicrobial activity of H5L, ligand and its metal complexes were screened against gram- positive and gram- negative bacteria. These nanometer particles serve by a good efficiencyin the biological field.The inhibition effects of the chemicals were illustrated in Table 8 and expressed as an average diameter of each inhibition zone (mm). The harmful effects of the Ni(II), VO(II), UO2(II) complexesand a free ligand are observed withBacillus subtilis(Gram +Ve bacterium). Pt(IV) and Pd(II) complexes show a bacteriostatic effect against Proteus, while Klebsiella was resistant to all compounds. According to Overtone’s concept of cell permeability, the lipid membrane that surrounds the cell favors the passage of only lipid soluble materials due to which liposolubility is an important factor that controls antimicrobial activity. On chelation, the polarity of the metal ion is reduced to a greater extent due to the overlap of the ligand orbital and partial sharing of the positive charge of the metal ion with donor groups. Further, it increases the delocalization of p-electrons over the whole chelate ring and enhances the lipophilicity of the complex. The increased lipophilicity enhances the penetration of the complexes into lipid membranes and blocking the metal binding sites on the enzymes of the microorganism. Also, however the metal salts alone exhibit a higher activity than the investigated complexes but cannot use as antibacterial agents because of their toxicity and the probability of binding to the free ligand presented in the biological systems such as the nitrogen bases of nucleic acid and proteins.The response of DNA to many chemicals used varies greatly amongligand and its complexes. After incubation of identical concentrations of a given compound (Fig.7). VO(II) complex and a free ligand have no effects on DNA, while, Ni(II) and UO2(II) have partial degradation. Pt(IV) and Pd(II) complexes degrade the DNAcompletely. Although numerous biological experiments have also demonstrated that DNA is the primary intracellular target of anticancer drugs due to the interaction between small molecules and DNA, which can cause DNA damage in cancer cells, blocking the division of cancer cells and resulting in cell death [46].
Conclusion
A series of complexes were prepared using H5L ligand. The structural formula of the prepared complexes are deliberately proposed based on the use of different spectral and analytical tools. The octadentate is the ligand mod of coordination, as a neural or trinegative. Most investigated complexes are thermally unstable. Spin Hamiltonian parameters as well as molecular orbital parameters were calculated for VO(II) complex. XRD patterns display thenanosizedparticles. TEM scenes are also supporting the XRD data. Finally the biological activities reporteda toxic effect with Gram positive bacterium (Bacillus subtilis). Also, the effect on DNA displayed a complete degradation by the use of Pt(IV) and Pd(II) complexes.
References
- Gülcan M., Sönmez M., Berber I., Turk. J. Chem., 36(1)(2012),189 .
- Abou El Ella D. A.,Ghorab M. M.,Noaman E.,Heiba H. I., Khalil A. I., Bioorg. Med. Chem.,16(5)(2008)2391.
- Renau T. E.,Wotring L. L., Drach J. C., Townsend L. B., J. Med. Chem.,39(4)(1996),873.
- Kuyper L. F., Garvey J. M.,Baccanari D. P.,Champness J. N., Stammers D. K.,Beddell C. R., Bioorg. Med. Chem.,1996,4 (4),593.
- Andrus P. K., Fleck T. J., Oostveen J. A., Hall E. D., J. Neurosci. Res.,1997,47 (6),650.
- Chamberlain S. D., Redman A. M., Wilson J. W., Deanda F., Shotwell J. B., Bioorg. Med. Chem. Lett.,2009,19 (2),360.
- Amin K. M. , Hanna M. M., Abo-Youssef H. E., George R. F., Eur. J. Med. Chem.,2009,44 (11),4572.
- Meade E. A.,Sznaidman M., Pollard G. T., Beauchamp L. M., Howard J. L., Eur. J. Med. Chem.,1998,33 (5),363.
- Hogenkamp D. J., Nguyen P., R. Upasani, Inventorsaryl substituted pyrazoles, imidazoles, oxazoles, thiazoles and pyrroles, and the use there of, 2000.
- Koz G., Kaya H.,Astley D.,Yasa I.,Astley S. T., Gazi Univ. J. Sci., 2011,24 (3),407.
- Breault G. A., Pease J. E., Inventors ,2000.
- Kim D. C., Lee Y. R., Yang B. S., Shin K. J., Kim D. J., Chung B. Y., Eur. J. Med. Chem., 2003,38 (5),525.
- Sorensen J., Metal ions, Prog. Med. Chem,.,1978,15, 211.
- Vidal A.,Ferrandiz M. L.,Ubeda A.,Acero-Alarcon A., Sepulveda-Arques J.,Alcaraz M. J., J. Pharm. Pharmacol., 2001,53 (10),1379.
- Masoud M. S.,Heiba A. M.,Ashmawy F. M., Transition Met. Chem.,1983, 8 (2),124.
- Masoud M. S., Ibrahim A. A., Khalil E. A., El-Marghany A., Spectrochim. Acta, Part A , 2007, 67 (3–4),662.
- HyperChem Professional 8, Hypercube, Inc., Gainesville, FL 32601, USA. (http://www.hyper.com) 2007
- Allinger NL, Journal of the American Chemical Society., 1977, 99(25),8127.
- Dhumwad S.D.,Goudar T.R.,Polyhedron.,1993,12( 23),2809.
- Lever A. B. P., Inorganic Electronic Spectroscopy, Elsevier, Amsterdam, 1986
- El-Shazly R. M.,Al-Hazmi G. A.,Ghazy S. E.,El-Shahawi M. S., El-Asmy A. A., Spectrochim. Acta A.,2005, 61, 243.
- El-Asmy A. A., Khalifa M. E.,Hassanian M. M., Indian Journal of Chemistry – Section AInorganic, Physical, Theoretical and Analytical Chemistry.,2004, 43(1), 92.
- El-MetwalyN. M., Transition Metal Chemistry., 2007, 32(1), 88.
- El-Asmy A. A., El-SonbatiA. Z., Ba-Issa A. A., Mounir M., Transition Metal Chemistry.,1990, 15(3),222.
- McGlynn S. P., Daigre J., Smith F. J., The Journal of Chemical Physics., 1963, 39(3),675.
- Diab M. A.,El-Sonbati A. Z.,El-Sanabari A. A.,Taha F. I., Polymer Degradation and Stability,1989,23(1),83.
- Swamy S. J.,Bhaskar K.,Ind. J. Chem.,1999,38A, 961.
- El-Saied F. A., El-Asmy A. A., Kaminsky W., West D. X., Transition Metal Chemistry., 2003, 28(8), 854.
- Efthimiadou E. K., Sanakis Y., Katsaros N., Karaliota A., Psomas G., Polyhedron., 2007,26(5),1148.
- Vetter C., Kaluderovic G. N., Paschke R., Kluge R., Schmidt J., Steinborn D., InorganicaChimicaActa.,2010, 363(11):2452.
- Lever A. B. P., Inorganic Electronic Spectroscopy, 2nd ed., Elsevier, Amsterdam, 1984
- Skoog D. A., West D. M.,Holler F. J., An Introduction of Analytical Chemistry,Savrders College Publishing ,1992.
- Abou-Hussen A. A., El-Metwally N. M., Saad E. M., El-Asmy A. A., Journal of Coordination Chemistry.,2005, 58(18),1735.
- Patel M. N.,Dosi P. A., Bhatt B. S., Inorg. Chem. Commun.,2012,21, 61.
- Geary W. J., Coord. Chem. Rev.,1971,7, 81.
- Al-Hazmi G. A., El-Metwally N. M.,El-Gammal O. A., El-Asmy A. A., SpectrochimicaActa – Part A., 2008, 69(1),56.
- El-Metwally N. M., El-Shazly R. M., Gabr I. M., El-Asmy A. A., SpectrochimicaActa – Part A.2005, 61(6),1113.
- El-Metwally N. M., GabrI. M., El-Asmy A. A., Abou-Hussen A. A., Transition Metal Chemistry., 2006,31(1),71.
- Mcglynn S. P., Neely B.T., Neely C., AnalyticaChimicaActa,., 1963, 28(C), 472.
- Montgomery R. M., Locascio W. V., Archives of Dermatology.,1966,93(6),739.
- Carrano C. J., Nunn C. M., Quan R., Bonadies J. A., Pecoraro V. L., Inorganic Chemistry.,1990, 29(5), 944.
- Dunn T. M., Transactions of the Faraday Society.,1961,57,1441.
- McGarveyB. R., Journal of Physical Chemistry.,1967, 71(1), 51.
- Maurya R. C., Rajput S., Journal of Molecular Structure., 2004, 687( 1-3), 35.
- Cullity B. D., ‘Elements of X –ray diffraction’ second ed., Addison –Wesley Inc.,1993
- Bielawska A., Bielawski K., Muszyńska A., Farmaco., 2004, 59(2),111.

This work is licensed under a Creative Commons Attribution 4.0 International License.


