Phytochemical Isolation and Spectroscopic Characterization of Quercetin and Kaempferol from Hydroalcoholic Extract of Hibiscus rosa-sinensis
 , Subhashish Tripathy1, Hridaya Shankar Chaurasiya2, Md Sajid Ali3, Sushant Kumar Sharma4, Dipika Dubey1, Vineeta Arya5 and Sahil Yadav2
1B.M.S. College of Pharmacy, Tiloi, Amethi, UP, India.
2Jyotiraditya Institute of Pharmacy, JD Shiksha Gram, Kohandaur Pratapgarh, UP, India.
3Department of Pharmaceutics, College of Pharmacy, Jazan University, Jazan, Saudi Arabia
4Institute of Biomedical Education and Research Department of Pharmacy, Mangalayatan University Aligarh-Mathura Highway, Beswan, Aligarh, Uttar Pradesh, India
5Teerthanker Mahaveer College of Pharmacy, Teerthanker Mahaveer University, Moradabad, Uttar Pradesh, India.
Corresponding Author E-mail:jpsingh9452@gmail.com
Download this article as:
ABSTRACT:Hibiscus rosa-sinensis, commonly known as the China rose, is traditionally recognized worldwide for its antioxidant, anti-inflammatory, and antimicrobial properties. The present phytochemical investigation focuses on the isolation and spectroscopic characterization of two bioactive flavonoids, quercetin and kaempferol, from the hydroalcoholic extract of H. rosa-sinensis. Fresh flowers and leaves were collected and subjected to hydroalcoholic extraction (70:30 ethanol: water) using a Soxhlet apparatus. Preliminary phytochemical screening via the Shinoda test confirmed the presence of flavonoids. Thin-layer chromatography (TLC) and column chromatography were employed for the isolation and purification of compounds from the extract. Fractions C-8 and C-9 exhibited sharp and distinct bands under ultraviolet light at 254 nm, indicating the presence of isolated flavonoids. Structural elucidation was performed using FTIR, ¹H NMR, ¹³C NMR, and Mass spectrometry in positive ion mode, confirming the identities of quercetin and kaempferol. The findings underscore the rich flavonoid profile of H. rosa-sinensis and reinforce its therapeutic potential. The presence of Quercetin and Kaempferol validates the plant’s antioxidant and pharmacological activities.
KEYWORDS:Column chromatography; Hibiscus rosa-sinensis; Kaempferol; Phytochemical screening; Quercetin
Introduction
H. rosa-sinensis, a lively ornamental plant with different colors, exists in nature. Due to its medicinal properties,this plant is widely cultivated across tropical regions1. It has been used asa traditional medicine for its diverse therapeutic properties, including antioxidants, anti-inflammatory, anti-hypertensive, and antimicrobial effects.
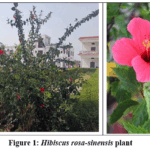 |
Figure 1: Hibiscus rosa–sinensis plant. Click here to View Figure |
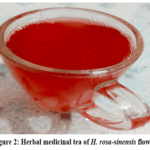 |
Figure 2: Herbal medicinal tea of H. rosa-sinensis flower Click here to View Figure |
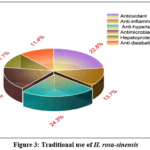 |
Figure 3: Traditional use of H. rosa-sinensis Click here to View Figure |
H. rosa-sinensis has many varied active phytoconstituents, out of which flavonoids are the most active compounds for medicinal values. Quercetin and Kaempferol are useful for this plant potential pharmacological activity and organizational diversity.2
This phytochemical analytical research is built on the isolation and spectroscopic characterization of two important active phytoconstituents Quercetin and Kaempferol from a hydroalcoholic extract (70:30 ethanol: water) of H.rosa-sinensisusing Soxhlet apparatus.3 The Shinoda test was done for preliminary phytochemical screening to confirm the occurrence of flavonoids. Further fractionation by column chromatography and TLC chromatographic analysis identified isolates from (C-8 and C-9) factions, exhibiting discrete UV bands, for flavonoid-rich regions.4
For structural elucidation of isolates from the fraction (C-8 and C-9), we followed spectrophotometric analysis, such as FTIR, ¹H NMR, ¹³C NMR, and positive ion mass spectrometry. By interpretation of the isolates by spectrometric data, Quercetin and Kaempferol were confirmed, which reinforces the plant’s antioxidant potential and supports its traditional use in herbal formulations.5
Materials and Methods
Plant Material Collection and Preparation
Fresh aerial parts, flowers, and leaves of H. rosa-sinensis were collected from the herbal garden of BMS College of Pharmacy, Tiloi, Uttar Pradesh, India, and authenticated. The plant material was washed, shade-dried for 7–10 days, and ground into coarse powder using a mechanical grinder. The powdered sample was stored in airtight glass containers at room temperature(250C) until extraction.6
Hydroalcoholic Extraction
For Hydroalcoholic extraction H. rosa-sinensis we used a solvent system of Ethanol: Water (70:30 v/v) using Soxhlet extractor apparatus. 50 g of dried H. rosa-sinensis powder, placed in a cellulose cover and extracted with 500 mL of hydroalcoholic solvent for 8.5 hr.7 The Ext. was concerted under condensed pressure by rotary evaporator at 40°C temperature.The semi-densedeposit was dehydrated in a vacuum oven and kept at 4°C for column chromatographic separation.
Shinoda test
The presence of flavonoids in the H. rosa-sinensis extract was confirmed through the Shinoda test. In this preliminary phytochemical test, the addition of magnesium turnings tailed by concentrated HCl to the Ext. ensued in the progress of a reddish-orange coloration, which specifies the strong occurrence of flavonoid compounds.8
Column Chromatography and Fractionation
Column chromatography was performed using silica gel (60–120 mesh) as stationary phase, activated at 110°C for 2 hr. A glass column of 60 cm in length and 3 cm in diameter was packed by n-hexane using the wet slurry method. The H. rosa-sinensis extract adsorbed onto silica gel with slight amount of methanol.9 Then it was prudently overloaded onto the glass column. Elution was performed using gradient flow analysis, starting with 100% n-hexane (non-polar) and gradually increasing methanol (polar) concentrations to 15%, 30%, 55%, 75%, and finally 100%. Twelve fractions (C-1 to C-12) were collected in 50 mL portions. Each fraction analysed by Thin Layer Chromatography (TLC) to monitor compound part ion and assess purity. Fractions C-8 and C-9 presented sharp and distinct bands under UV light (254 nm), indicating the avidity of isolated compounds. These fractions were pooled, concentrated, and subjected to structural elucidation.10
Structural Elucidation of Isolated Compounds
Structural Elucidation of Fractions C-8 and C-9 performed by FTIR, 1H NMR, 13C NMR and Mass spectroscopy. FTIR (Fourier Transform Infrared Spectroscopy) is used to detect functional groups by measuring characteristic functional group detection. Like broad O–H stretches around 3400 cm⁻¹ for phenolic hydroxyl groups, while sharp C=O stretches near 1650–1750 cm⁻¹ confirm the availability of ketones or carboxylic acids. Proton Nuclear Magnetic Resonance (¹H NMR) offers comprehensive visions into the hydrogen atoms within the molecule, counting their biochemical situation, number, and connectivity.6 Aromatic protons characteristically appear between δ 6–8 ppm, and phenolic OH groups resonate above δ 9 ppm. This helps differentiate between different ring systems and substitution patterns. ¹³C NMR (Carbon-13 NMR) embellishments this by drawing the carbon outline, screening signals for carbonyl C atoms, aromatic C atoms, and hydroxylated positions, usually between δ 90–180 ppm. This analytical mapping helps the backbone for deciding flavonoids like Quercetin and Kaempferol. Mass spectrometry, particularly in positive ion mode, regulates the molecular weight determination and fragmentation pattern of Isolate-1 and Isolate-2.11
Wavenumber (Cm-1) in X-axis and Transmittance (%) Y-axis
Results and Discussions
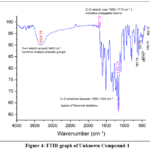 |
Figure 4: FTIR graph of Unknown Compound-1 Click here to View Figure |
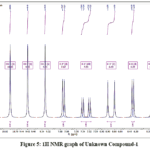 |
Figure 5: 1H NMR graph of Unknown Compound-1 Click here to View Figure |
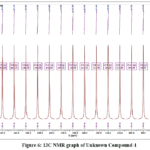 |
Figure 6: 13C NMR graph of Unknown Compound-1 Click here to View Figure |
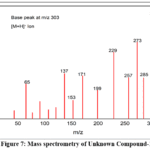 |
Figure 7: Mass spectrometry of Unknown Compound-1 Click here to View Figure |
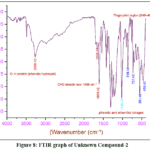 |
Figure 8: FTIR graph of Unknown Compound-2 Click here to View Figure |
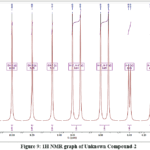 |
Figure 9: 1H NMR graph of Unknown Compound-2 Click here to View Figure |
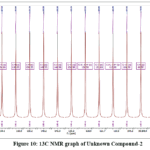 |
Figure 10: 13C NMR graph of Unknown Compound-2 Click here to View Figure |
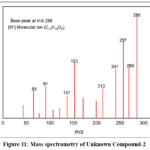 |
Figure 11: Mass spectrometry of Unknown Compound-2 Click here to View Figure |
Discussion
Spectral interpretation
Unknown compound-1 from fraction C-8
FTIR
In Figure 4, FTIR spectrum of Unknown Compound-1 show Broad O–H stretch around 3400 cm⁻¹ confirms multiple phenolic groups. Strong C=O stretch near 1650–1710 cm⁻¹ confirmed the presence of conjugated ketone. Peak in 1000–1300 cm⁻¹ shows C–O stretches between typical of flavonoid skeleton. Fingerprint region (940–400 cm⁻¹) shows complex bending and skeletal vibrations for unknown compound-1.
HNMR
Figure 5, Aromatic protons of Unknown Comound-1 appear between δ 6.1–7.7 ppm.Phenolic OHgroups show broad singlets above δ 9 ppm, due to deshielded OH-4 due to strong intramolecular hydrogen bonding.12 Coupling constants confirm ortho and meta relationships in the B-ring.
C NMR
In Figure 6, Unknown Comound-1 appears downfield at δ ~176.5 ppm for the Carbonyl carbon (C-4) which is common for flavanol ketones.Phenolic carbons (C-5, C-7, C-9)appear at δ 156–164 ppm due to hydroxyl substitution.13 Ar-C in the A and B rings show shifts between δ 93–136 ppm.
Mass Spectroscopy
In Figure 7, Unknown compound-1 shows Base peak at m/z 302 which confirms the molecular ion of quercetin. Retro-Diels–Alder cleavage is prominent in flavonoid mass spectra, yielding m/z 229 and 153. Low-mass fragments (m/z 77, 91) reflect aromatic ring stability. Elemental Analysis: C, 59.61; H, 3.34; O, 37.05, Chemical Formula: C15H10O7, Exact Mass: 302.04, m/z: 302.04 (100.0%), IUPAC Name:2-(3,4-dihydroxyphenyl)-3,5,7-trihydroxy-4H-chromen-4-one
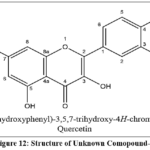 |
Figure 12: Structure of Unknown Comopound-1 Click here to View Figure |
Spectral interpretation
Unknown compound-2 from fraction C-9
Figure 8. In FTIR analysis of Unknown Compound-2 shows Transmittance around 3400 cm⁻¹ and 1655 cm⁻¹ which indicate phenolic O–H and conjugated C=O groups presence.Fingerprint region (1500–400 cm⁻¹) shows complex bending and skeletal vibrations typical of flavanols.14
H-NMR
Figure 9, In PMR analysis of Unknown Compound-2 shows A-ring protons (H-6, H-8) show meta coupling (J = 2.0 Hz) typical of flavanol structure.Phenolic OH groupsshow as singlets above δ 9 ppm, with OH-4 strongly deshielded due to intramolecular hydrogen bonding.15
C-NMR
Figure 10, In 13 C NMR of Unknown Compound-2 shows Carbonyl carbon (C-4) appears downfield at δ -176 ppm typical for flavanol ketones. Phenolic carbons (C-5, C-7, C-9) resonate between δ 156–164 ppm due to hydroxyl substitution. Ar-C in the A and B rings show expected shifts between δ 93–136 ppm.
Mass Spectrometry
Figure 11, Mass Spectrometry of Unknown Compound-2 shows Base peak at m/z286 confirms the molecular ion of kaempferol. Retro-Diels–Alder cleavage yields m/z 213 and 153 diagnostic for flavonoid structure.16
Elemental Analysis: C, 62.94; H, 3.52; O, 33.54, Chemical Formula: C15H10O6, Exact Mass: 286.05, m/z: 286.05 (100.0%). IUPAC Name: 3,5,7-trihydroxy-2-(4-hydroxyphenyl)-4H-chromen-4-one Unknown Compound-2 kaempferol
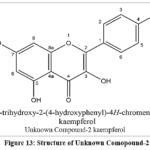 |
Figure 13: Structure of Unknown Comopound-2 Click here to View Figure |
Summary and Conclusion
This phytochemical analysis investigates the phytochemical profile of H. rosa-sinensis, focusing on the isolation and spectroscopic characterization of two key flavonoids Quercetin and Kaempferol from its hydroalcoholic extract. Column chromatography yielded twelve fractions, among which C-8 and C-9 exhibited distinct UV-active bands, suggesting the presence of flavonoid phytoconstituents. These fractions underwent structural elucidation using FTIR, ¹H NMR, ¹³C NMR, and Mass spectrometry. Spectral data confirmed the identities of quercetin (m/z 302) and kaempferol (m/z 286). With spectroscopic interpretation shows characteristic functional groups and fragmentation patterns consistent with flavanol structures. The scientific study strengthens the beneficial property of H. rosa-sinensis, confirming its traditional use in herbal medicine and highlighting its rich flavonoid content.
The successful isolation and characterization of quercetin and kaempferol from Hibiscus rosa-sinensis underscore the plant’s pharmacological relevance, particularly its antioxidant and anti-inflammatory properties. Spectroscopic techniques provided robust confirmation of compound identity, supporting the reliability of the extraction and purification methods. These findings not only validate the ethnomedicinal use of H. rosa-sinensis but also pave the way for its inclusion in future phytopharmaceutical formulations. The study contributes to the growing body of evidence advocating for natural sources of bioactive flavonoids in therapeutic applications.
Acknowledgement
We sincerely thanks to the management of BMS College of Pharmacy, Tiloi, Amethi, Uttar Pradesh, India, for providing access to the laboratory and financial support to complete this research. Special thanks are extended to Mr. Adarsh Pandey, Department of Botany, Babu Mahipati Singh Mahavidyalaya, for authenticating the plant specimen. We also extend our appreciation to Microsoft Copilot AI for its assistance in refining the bibliography and correcting grammatical errors.
Funding Sources
The author(s) received no financial support for the research, authorship, and/or publication of this article.
Conflict of Interest
We declare that there is no conflict of interest regarding the publication of this paper.
Data Availability Statement
All data generated or analysed during this study are included in the published article. No additional datasets were created or analysed.
Ethical Approval Statement
This study involved phytochemical analysis of plant material (Hibiscus rosa-sinensis) and did not require ethical approval, as no human or animal subjects were involved.
Author Contributions
Dr. Jay Prakash Singh conceptualized and supervised the study, designed methodology, interpreted data, and finalized the manuscript. performed phytochemical screening, chromatographic separation, and spectroscopic analysis. assisted in plant collection, extraction, literature review, and figure preparation. All authors reviewed and approved the manuscript.
References
- Sivaraman, C. M.; Saju, F. Medicinal value of Hibiscus rosa sinensis: a review.,International Journal of Pharmacognosy and Chemistry., 2021, 1–11.
CrossRef - Missoum, A. An update review on Hibiscus rosa sinensis phytochemistry and medicinal uses., Journal of Ayurvedic and Herbal Medicine., 2018, 4(3), 135–146.
CrossRef - Mondal, S.; Das, M.; Debnath, S.; Sarkar, B. K.; Babu, G. An overview of extraction, isolation and characterization techniques of phytocompounds from medicinal plants., Natural Product Research., 2024, 1–23.
CrossRef - Al-Snafi, A. E. Chemical constituents, pharmacological effects and therapeutic importance of Hibiscus rosa-sinensis – A review., IOSR Journal of Pharmacy., 2018, 8(7), 101–119.
- Afiune, L. A. F.; Leal-Silva, T.; Sinzato, Y. K.; Moraes-Souza, R. Q.; Soares, T. S.; Campos, K. E.; et al. Beneficial effects of Hibiscus rosa-sinensis flower aqueous extract in pregnant rats with diabetes., PLoS One., 2017, 12(6), e0179785.
CrossRef - Khine, M. Isolation and characterization of phytoconstituents from Myanmar medicinal plants., 2018.
- Bajaj, S.; Fuloria, S.; Subramaniyan, V.; Meenakshi, D. U.; Wakode, S.; Kaur, A.; et al. Chemical characterization and anti-inflammatory activity of phytoconstituents from Swertia alata., , 2021, 10(6), 1109.
CrossRef - Yadav, R.; Agarwala, M. Phytochemical analysis of some medicinal plants., Journal of Phytology., 2011, 3(12).
- Revathy, S.; Elumalai, S.; Antony, M. B. Isolation, purification and identification of curcuminoids from turmeric (Curcuma longa) by column chromatography., Journal of Experimental Sciences., 2011, 2(7).
- Stock, R.; Rice, C. B. F. Chromatographic Methods. Springer, 2013.
- Balasubramaniam, G.; Sekar, M.; Ravi, S.; Badami, S. Isolation and structural characterization of phytoconstituents from Strobilanthes kunthianus., 2020.
CrossRef - Bible, R. H. Interpretation of NMR spectra: an empirical approach. Springer Science & Business Media, 2013.
- Flynn, A. B. NMR Interpretation: Getting from Spectrum to Structure., Journal of Chemical Education., 2012, 89(9), 1210–1212.
CrossRef - Aggarwal, B.; Ali, M.; Singh, V.; Singla, R. K. Isolation and characterization of phytoconstituents from the stems of Ichnocarpus frutescens., Chinese Journal of Natural Medicines., 2010, 8(6), 401–404.
CrossRef - Keeler, J. Understanding NMR Spectroscopy. John Wiley & Sons, 2011.
- McLafferty, F. W.; Turecek, F. Interpretation of Mass Spectra. University Science Books, 1993.
Accepted on: 06 Mar 2026
Second Review by: Dr. Akshay Akotkar
Final Approval by: Dr. Tanay Pramanik


ISSN Online: 2231-5039