Optical Activity and Conductivity of L-(+)-Tartaric Acid in Aqueous Solutions at Varying Concentrations
 and Bogdan Bogdanov2
1Faculty of Technological Sciences, Mother Teresa University in Skopje, Republic of North Macedonia.
2Institute of Chemistry, Faculty of Natural Sciences and Mathematics, Sts. Cyril and Methodius University, Skopje, Republic of North Macedonia.
Corresponding Author E-mail:olga.popovska@unt.edu.mk
Download this article as:
ABSTRACT:Tartaric acid is a naturally occurring organic acid found in grapes and other fruits and is widely used in food applications. It has two stereogenic centres and occurs as the L-(+)- and D-(−)-enantiomers and the optically inactive meso form. This study examined the optical rotation and electrical conductivity of aqueous L-(+)-tartaric acid solutions at 25 °C over the investigated concentration range of 1–130 g per 100 mL of water (with the volume-expansion correction described below). Optical rotation was measured at 365, 405, 436, 546, 579, 589, 633, and 880 nm. At 589 nm, the observed rotation ranged from 0.147° to 5.166° across the reported concentration series. The observed rotation generally increased with concentration, whereas the calculated specific and normalized rotation showed wavelength- and concentration-dependent trends. Conductivity increased at lower concentrations and then decreased at higher concentrations. These results demonstrate that both optical and electrical measurements vary with solution composition; interpretation of the high-concentration behaviour should take account of the applied volume correction and the measurement uncertainties.
KEYWORDS:Conductivity; L-(+)-tartaric acid; Optical rotation; Specific optical rotation
Introduction
Tartaric acid (2,3-dihydroxybutanedioic acid; IUPAC name) is an organic acid found in grapes and other fruits, either in free form or associated with mineral ions such as potassium, calcium, and magnesium. Potassium hydrogen tartrate can crystallize during winemaking and is commonly known as tartar or “wine diamonds.” Industrial production has also used tartrate-containing by-products from winemaking as starting materials. In one established route, potassium hydrogen tartrate is converted through a calcium tartrate intermediate, which is then processed to obtain tartaric acid. Crude grape-derived material may contain pigments, while purification yields a white crystalline product.1-5,10
Tartaric acid has two stereogenic centres and three stereoisomeric forms: L-(+)-tartaric acid and D-(−)-tartaric acid, which are enantiomers, and meso-tartaric acid, which is optically inactive because of its internal symmetry (Fig. 1). The enantiomers rotate plane-polarized light in opposite directions under equivalent conditions. Optical rotation depends not only on stereochemistry but also on wavelength, temperature, solvent, and concentration. Earlier studies of tartaric acid reported anomalous optical rotatory dispersion and showed that simple linear relationships may describe the behaviour only over limited concentration ranges. The present work examines observed optical rotation at eight wavelengths and electrical conductivity across a broad concentration range, with attention to the distinction between observed, specific, and normalized rotation.
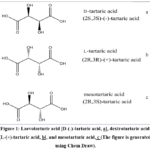 |
Figure 1: Laevotartaric acid [D-(-)-tartaric acid, a], dextrotartaric acid [L-(+)-tartaric acid, b], and mesotartaric acid, c (The figure is generated using Chem Draw). Click here to View Figure |
The stereochemical descriptors and optical signs should be distinguished: L/D notation is not, by itself, a universal indication of the sign of optical rotation. In the present study, the material is identified as L-(+)-tartaric acid, the dextrorotatory form. The D-(−)-enantiomer is its mirror-image counterpart, while meso-tartaric acid is optically inactive. Previous work on tartaric acid solutions has discussed anomalous rotatory dispersion, sometimes referred to in this context as a Cotton-effect-like change in optical response. Such behaviour should be interpreted from the measured wavelength-dependent data rather than inferred from concentration alone. Biot-type relationships can provide approximations over restricted ranges, whereas dispersion models such as the Drude equation may be useful when their assumptions and fitted parameters are appropriate. The high solubility of tartaric acid in water permits investigation over a wide range of solution compositions, but concentration-related volume expansion must be accounted for when expressing the results.
Tartaric acid is used in food and beverage formulations as an acidulant and acidity regulator and has applications in confectionery, bakery products, and other food products. Tartrate salts are also used in several industrial and laboratory contexts, while tartaric acid has been reported in photographic, textile, ceramic, and pharmaceutical applications. These uses provide a practical context for understanding its solution properties. The aim of this study was to measure the optical rotation of aqueous L-(+)-tartaric acid at eight wavelengths and to examine its relationship with concentration, including the reported wavelength-dependent dispersion, while also measuring electrical conductivity across the same concentration series.
Experimental
L-(+)-Tartaric acid (Carlo Erba, Italy) was used without further purification. Aqueous samples were prepared over the nominal range of 1–130 g of tartaric acid per 100 mL of water. Because dissolving the solid increases the final solution volume, the authors applied a volume-expansion correction rather than treating the initial solvent volume as the final solution volume. The volume correction was estimated using 50 mL and 25 mL burettes and a 25 mL volumetric flask; the difference in the burette reading was used to estimate the volume contribution associated with dissolution. The reported burette-reading uncertainty was 0.05–0.1 mL. The correction factor, f, and corrected concentration values are listed in Table 1. The original description does not fully specify the mass-weighing procedure, the exact preparation sequence for each concentration, or how the correction was scaled from the measured aliquot to the 100 mL basis; these details should be confirmed by the authors before final publication.
Samples were stored at 298.15 K (25 °C) for one month. No visible crystallization or solidification was reported during storage. Optical rotation was measured using an Anton Paar MCP 5100 polarimeter equipped with Peltier temperature control and a 100 mm cell (cell volume 6 mL). The instrument accuracy was reported as 0.001°, with repeatability/reproducibility reported as 0.001–0.002°; the number of replicate readings and whether these values represent instrument specifications or variation among repeated measurements were not stated. Measurements were made at 365, 405, 436, 546, 579, 589, 633, and 880 nm. Conductivity values are presented in Table 5, but the original manuscript does not identify the conductivity meter, cell constant, calibration procedure, measurement temperature, equilibration protocol, or number of replicate measurements. These details must be supplied from the laboratory records; they have not been inferred or invented in this revision.
Results and Discussion
The high solubility of L-(+)-tartaric acid enabled measurements over a broad range of concentrations. Since dissolution changes the solution volume, the concentration values used in the optical-rotation analysis depend on the volume-correction procedure. Table 1 summarizes the reported correction factors and corrected concentrations. Before publication, the arithmetic in Table 1 should be checked against the original laboratory records, including the total volume and corrected concentration at every point.
Table 1: The recalculation of volume values for L-(+)-Tartaric Acid.
|
g (100 mL)-1 Solvent |
Concentration
(mol) |
Δ mL (100 mL)-1 Solvent | Total mL | f* | g (100 mL)-1
Solution |
Conc. mol g (100 mL)-1 Solution |
|
1 |
0.067 | 0.4 | 100.4 | 0.996 | 0.996 | 0.066 |
| 2 | 0.133 | 0.8 | 100.8 | 0.992 | 1.984 |
0.132 |
|
3 |
0.200 | 1.6 | 101.6 | 0.984 | 2.953 | 0.197 |
| 4 | 0.267 | 2.4 | 102.4 | 0.977 | 3.906 |
0.260 |
|
5 |
0.333 | 2.8 | 102.8 | 0.973 | 4.864 | 0.324 |
| 10 | 0.667 | 6.0 | 106.0 | 0.943 | 9.434 |
0.629 |
|
15 |
1.000 | 8.4 | 108.4 | 0.923 | 13.838 | 0.923 |
| 20 | 1.333 | 10.8 | 110.8 | 0.903 | 18.051 |
1.203 |
|
30 |
2.000 | 16.8 | 116.8 | 0.856 | 25.685 | 1.712 |
| 40 | 2.667 | 22.4 | 122.4 | 0.817 | 32.680 |
2.179 |
|
50 |
3.333 | 28.0 | 128.0 | 0.781 | 39.063 | 2.604 |
| 60 | 4.000 | 33.6 | 133.6 | 0.749 | 44.910 |
2.994 |
|
70 |
4.667 | 39.2 | 139.2 | 0.718 | 50.287 | 3.352 |
| 80 | 5.333 | 44.8 | – | 0.691 | 55.249 |
3.683 |
|
90 |
6.000 | 54.8 | 154.8 | 0.646 | – | 3.876 |
| 100 | 6.667 | 56.4 | 156.4 | 0.639 | 63.939 |
4.263 |
|
110 |
7.333 | 62.8 | 162.8 | 0.614 | 67.568 | 4.505 |
| 120 | 8.000 | 68.4 | 168.4 | 0.594 | 71.259 |
4.751 |
|
130 |
8.667 | 74.0 | 174.0 | 0.575 | 74.713 |
4.981 |
*f = the factor to compensate for the concentration expansion of the solvent
The reported volume increase rises with the amount of tartaric acid added. At the highest nominal concentration, the table reports a volume increase of 74.0 mL per 100 mL of initial water. This is a substantial correction and therefore has a direct effect on the concentration basis used in subsequent calculations. The values and units in Table 1 and Fig. 2 should be checked together to ensure that the same concentration basis is used throughout.
The manuscript fits the volume-increase data with a straight line constrained to pass through the origin. This model is an empirical description of the reported data, not proof that the volume increase is exactly proportional to concentration at all compositions. The fitted slope, its uncertainty, and the correlation coefficient should be recalculated from the final corrected dataset and reported with consistent units.
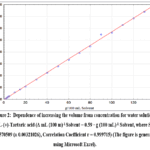 |
Figure 2: Dependence of increasing the volume from concentration for water solutions for L-(+)-Tartaric acid (Δ mL (100 m)-1 Solvent = 0.59 · g (100 mL)-1 Solvent, where Slope = 0.570509 (± 0.00321026), Correlation Coefficient r = 0.999715) (The figure is generated using Microsoft Excel). |
Observed optical rotation, α, is the angle (in degrees) measured directly by the polarimeter for the specified cell length and wavelength. Specific rotation, [α], is calculated by normalizing the observed angle by optical path length and concentration, using the concentration convention stated explicitly (for example, [α] = 100α/(l·c) when l is in dm and c is in g per 100 mL). Normalized optical rotation is the study-specific quantity obtained after applying the volume-expansion correction; it should not be treated as synonymous with observed rotation or standard specific rotation. The equation and concentration units used for every calculated column must be stated consistently. The numerical values in Tables 2–4 require a full recalculation check against the original α measurements and the corrected concentrations.
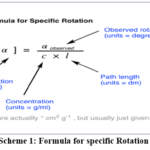 |
Scheme 1: Formula for specific Rotation |
(McMurry, J. E. Organic Chemistry, 6th ed.; Brooks/Cole: Pacific Grove, CA, 2003).22
Table 2: Observed α and specific optical rotation [α] for L-(+)-tartaric acid at different concentrations.
|
g (100 mL)-1 Solvent |
Wavelengths λ, nm | |||||||
| 365 | 405 | 436 | 546 | 579 | 589 | 633 |
880 |
|
|
1 |
0.107 [10.700] | 0.193 [19.300] | 0.204 [20.400] | 0.169 [16.900] | 0.154 [15.400] | 0.147 [14.700] | 0.134 [13.400] | 0.068
6.800] |
| 2 | 0.182 [9.100] | 0.364 [18.200] | 0.394 [19.700] | 0.331 [16.550] | 0.304 [15.200] | 0.292 [14.600] | 0.264 [13.200] |
0.138 [6.900] |
|
3 |
0.243 [8.100] | 0.525 [17.500] | 0.575 [19.167] | 0.491 [16.367] | 0.451 [15.033] | 0.434 [14.467] | 0.392 [13.067] | 0.207 [6.900] |
| 4 | 0.293 [7.325] | 0.67 [16.750] | 0.741 [18.525] | 0.638 [15.950] | 0.587 [14.675] | 0.567 [14.175] | 0.512 [12.800] |
0.272 [6.800] |
|
5 |
0.333 [6.660] | 0.81 [16.200] | 0.904 [18.080] | 0.784 [15.680] | 0.722 [14.440] | 0.698 [13.960] | 0.629 [12.580] | 0.335 [6.700] |
| 10 | 0.43 [4.300] | 1.422 [14.220] | 1.64 [16.400] | 1.461 [14.610] | 1.351 [13.510] | 1.316 [13.160] | 1.174 [11.740] |
0.63 [6.300] |
|
15 |
0.377 [2.513] | 1.899 [12.660] | 2.254 [15.027] | 2.254 [15.027] | 1.902 [12.680] | 1.855 [12.367] | 1.66 [11.067] | 0.896 [5.973] |
| 20 | 0.19 [0.950] | 2.216 [11.080] | 2.71 [13.550] | 2.537 [12.685] | 2.347 [11.735] | 2.288 [11.440] | 2.064 [10.320] |
1.12 [5.600] |
|
30 |
-0.489 [-1.630] | 2.621 [8.737] | 3.438 [11.460] | 3.386 [11.287] | 3.157 [10.523] | 3.084 [10.280] | 2.776 [9.253] | 1.517 [5.057] |
| 40 | -1.483 [-3.708] | 2.722 [6.805] | 3.886 [9.715] | 4.04 [10.100] | 3.78 [9.450] | 3.698 [9.245] | 3.34 [8.350] |
1.839 [4.598] |
|
50 |
-2.214 [-4.428] | 2.574 [5.148] | 4.1 [8.200] | 4.528 [9.056] | 4.261 [8.522] | 4.173 [8.346] | 3.782 [7.564] | 2.097 [4.194] |
| 60 | -4.43 [-7.383] | 2.15 [3.583] | 4.123 [6.872] | 4.947 [8.245] | 4.684 [7.807] | 4.589 [7.648] | 4.184
6.973 |
2.341 [3.902] |
|
70 |
-5.406 [-7.723] | 1.842 [2.631] | 4.051 [5.787] | 5.1 [7.286] | 4.848 [6.926] | 4.755 [6.793] | 4.34 [6.200] | 2.439 [3.484] |
| 80 | -6.822 [-8.528] | 1.336 [1.670] | 3.871 [4.839] | 5.255 [6.569] | 5.016 [6.270] | 4.923 [6.154] | 4.524 [5.655] |
2.56 [3.200] |
|
90 |
-8.293 [-9.214] | 0.75 [0.833] | 3.615 [4.017] | 5.35 [5.944] | 5.136 [5.707] | 5.05 [5.611] | 4.65 [5.167] | 2.648 [2.942] |
| 100 | -9.635 [-9.635] | 0.176 [0.176] | 3.332 [3.332] | 5.389 [5.389] | 5.198 [5.198] | 5.121 [5.121] | 4.73 [4.730] |
2.71 [2.710] |
|
110 |
-11.244 [-10.222] | -0.546 [-0.496] | 2.948 [2.680] | 5.394 [4.904] | 5.235 [4.759] | 5.165 [4.695] | 4.788 [4.353] | 2.765 [2.514] |
| 120 | -12.661 [-10.551] | -1.237 [-1.031] | 2.577 [2.148] | 5.359 [4.466] | 5.225 [4.354] | 5.39 [4.492] | 4.802 [4.002] |
2.784 [2.320] |
|
130 |
-13.964 [-10.742] | -1.85 [-1.423] | 2.202 [1.694] | 5.329 [4.099] | 5.231 [4.024] | 5.166 [3.974] | 4.819 [3.707] |
2.82 [2.169] |
Comparison with the literature is meaningful only when wavelength, temperature, solvent, concentration convention, path length, and the definition of optical rotation are comparable. Table 3 should identify the precise quantity and units in each column and cite the corresponding literature conditions. The apparent agreement or difference should be discussed only after the tabulated values and symbols have been verified.
Table 3: Comparing obtained optical [a] bb rotation values and normalized {a}bb optical rotation values for tartaric acid with literature.
|
% |
[a] Lowry* | [a] bb |
{a}bb |
|
5 |
14.07 | 13.96 | 14.351 |
| 10 | 13.304 | 13.160 |
13.95 |
|
15 |
12.642 | 12.68 | 13.405 |
| 20 | 11.949 | 11.40 |
12.676 |
|
25 |
11.207 | – | – |
| 30 | 10.5 | 10.28 |
12.007 |
|
35 |
9.799 | – | – |
| 40 | 9.01 | 9.245 |
11.316 |
|
45 |
8.219 | – | – |
| 50 | 7.366 | 8.346 |
10.218 |
|
55 |
6.5 | – |
|
*16
The normalized optical-rotation values in Table 4 incorporate the volume-expansion correction described in the Methods section. Because normalization changes the concentration basis, the table heading, symbols, units, and calculation formula should be explicit. The reported values should be recalculated from the observed rotations and the final corrected concentrations before any quantitative interpretation is made.
Table 4: Normalized optical rotation, {α}* for L-(+)-tartaric acid at different concentrations.
|
g (100 mL)-1 Solution |
Wavelengths λ, nm | |||||||
| 365 | 405 | 436 | 546 | 579 | 589 | 633 |
880 |
|
|
0.996 |
{10.743} | {19.377} | {20.482} | {16.968} | {15.462} | {14.759} | {13.454} | {6.827} |
|
1.984 |
{9.173} | {18.346} | {19.858} | {16.682} | {15.322} | {14.717} | {13.306} | {6.955} |
| 2.953 | {8.230} | {17.780} | {19.473} | {16.629} | {15.274} | {14.698} | {13.276} |
{7.010} |
|
3.906 |
{7.501} | {17.152} | {18.970} | {16.333} | {15.027} | {14.515} | {13.107} | {6.963} |
| 4.864 | {6.846} | {16.654} | {18.586} | {16.119} | {14.844} | {14.351} | {12.932} |
{6.888} |
|
9.434 |
{4.558} | {15.073} | {17.384} | {15.487} | {14.321} | {13.950} | {12.444} | {6.678} |
| 13.838 | {2.724} | {13.723} | {16.289} | {16.289} | {13.745} | {13.405} | {11.996} |
{6.475} |
|
18.051 |
{1.053} | {12.277} | {15.013} | {14.055} | {13.002} | {12.676} | {11.435} | {6.205} |
| 25.685 | {-1.904} | {10.204} | {13.385} | {13.183} | {12.291} | {12.007} | {10.808} |
{5.906} |
|
32.680 |
{-4.538} | {8.329} | {11.891} | {12.362} | {11.567} | {11.316} | {10.220} | {5.627} |
| 39.063 | {-5.668} | {6.589} | {10.496} | {11.592} | {10.908} | {10.683} | {9.682} |
{5.368} |
|
44.910 |
{-9.864} | {4.787} | {9.181} | {11.015} | {10.430} | {10.218} | {9.316} | {5.213} |
| 50.287 | {-10.750} | {3.663} | {8.056} | {10.142} | {9.641} | {9.456} | {8.630} |
{4.850} |
|
55.249 |
{-12.348} | {2.418} | {7.007} | {9.512} | {9.079} | {8.911} | {8.188} | {4.634} |
| 58.140 | {-14.264} | {1.290} | {6.218} | {9.202} | {8.834} | {8.686} | {7.998} |
{4.555} |
|
63.939 |
{-15.069} | {0.275} | {5.211} | {8.428} | {8.130} | {8.009} | {7.398} | {4.238} |
| 67.568 | {-16.641} | {-0.808} | {4.363} | {7.983} | {7.748} | {7.644} | {7.086} |
{4.092} |
|
71.259 |
{-17.768} | {-1.736} | {3.616} | {7.520} | {7.332} | {7.564} | {6.739} | {3.907} |
| 74.713 | {-18.690} | {-2.476} | {2.947} | {7.133} | {7.001} | {6.914} | {6.450} |
{3.774} |
*Including compensation for the concentration expansion of the solvent
The conductivity values reported for the L-(+)-tartaric acid solutions are summarized in Table 5. The table labels the measured quantity as conductivity in mS; however, mS is a conductance unit, whereas conductivity is normally expressed with a length-normalized unit such as mS cm⁻¹ or S m⁻¹. The authors should verify whether the instrument output was conductance or conductivity and correct the heading, units, and molar-conductivity calculations accordingly.
Table 5: Results for conductivity for L-(+)-tartaric Acid
|
g (100 mL)-1 |
Conductivity (mS) |
Molar Conductivity |
|
1 |
2.4 | 36.000 |
| 2 | 3.63 |
27.225 |
|
3 |
4.46 | 22.300 |
| 4 | 5.04 |
18.900 |
|
5 |
5.63 | 16.890 |
| 10 | 8.0 |
12.000 |
|
15 |
9.2 | 9.200 |
| 20 | 10.2 |
7.650 |
|
30 |
10.9 | 5.450 |
| 40 | 10.2 |
3.825 |
|
50 |
9.6 | 2.880 |
| 60 | 8.7 |
2.175 |
|
70 |
7.4 | 1.586 |
| 80 | 7.3 |
1.369 |
|
90 |
6.6 | 1.100 |
| 100 | 5.8 |
0.870 |
|
110 |
5.0 | 0.682 |
| 120 | 4.5 |
0.563 |
|
130 |
3.6 |
0.415 |
The reported conductivity rises from the lowest concentrations to a maximum and then declines at higher concentrations (Table 5). This non-monotonic trend is consistent with competing effects: increasing the amount of ionizable solute can increase the number of charge carriers, while higher concentration can reduce ionic mobility through changes in viscosity, ion association, and the solution environment. The present data alone do not establish that a decrease in dielectric constant is the primary cause, and the cited source concerns a different electrolyte/solvent system. The explanation should therefore remain tentative unless supported by measurements or directly relevant literature. The concentration threshold should be expressed on the same basis as the prepared samples, rather than as “vol.%” unless volume fraction was actually measured.
The dependence of optical rotation (OR) or normalized optical rotation and concentration (Conc.) of tartaric acid is shown in Fig. 3.
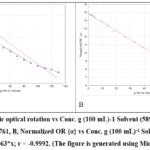 |
Figure 3: A: Specific optical rotation vs Conc. g (100 mL)-1 Solvent (589 nm): y = 13.8303 – 0.0868*x; r = -0.9761, B, Normalized OR {α} vs Conc. g (100 mL)-1 Solution (589nm): y = 14.8668 – 0.1063*x; r = -0.9992. |
The value of coefficient correlation for different equations at different wavelengths is shown in Table 6.
|
λ (nm) |
a | b |
Correlation Coefficient, r |
|
365 |
23.2344 | -2.58315 | -0.995862 |
| 405 | 63.5154 | -3.48195 |
-0.997059 |
|
436 |
85.4474 | -4.30767 | -0.998077 |
| 546 | 126.246 | -7.43413 |
-0.995613 |
|
579 |
95.8374 | -6.34431 | -0.995775 |
| 589 | 139.658 | -9.39012 |
-0.999162 |
|
633 |
142.574 | -10.6414 | -0.998993 |
| 880 | 160.962 | -22.7827 |
-0.998476 |
Concentration g / 100 mL solution = a + b · Normalized OR, {α}
Among the linear fits reported in Table 6, the largest absolute correlation coefficient is reported at 589 nm (r = −0.999162). This indicates a strong linear association within the analysed dataset, but does not by itself establish predictive accuracy or causation. The regression direction, variable definitions, units, and use of normalized rotation should be checked against Fig. 3 and the underlying data.
The effect of Cotton’s effect of water solution for L-(+)-tartaric acid at different concentrations was shown in Fig. 4.
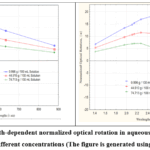 |
Figure 4: Wavelength-dependent normalized optical rotation in aqueous solutions for L-(+)-Tartaric Acid at different concentrations (The figure is generated using Microsoft Excel). |
Figure 4 presents the wavelength-dependent normalized optical-rotation curves for the investigated solutions. The manuscript reports that the sign of normalized rotation changes across the wavelength range for some of the higher-concentration samples, whereas no such sign change is reported for the lower-concentration samples. This pattern should be described as a feature of the measured dispersion curves; the term “Cotton effect” should be used only if the spectral behaviour and its definition are adequately supported. Please verify the curve labels, concentration values, signs, and wavelength ordering in Fig. 4 against Table 4.
Conclusion
The measurements show that the observed optical rotation depends on both concentration and wavelength. The reported conductivity increases at low concentrations, reaches a maximum, and decreases at higher concentrations. These trends are empirical findings for the investigated samples; the present data do not independently establish a molecular rotational-motion mechanism or prove that changes in dielectric constant alone cause the conductivity decrease. The conclusions should therefore be limited to the measured trends and the corrected quantities.
The distinction between observed rotation, specific rotation, and volume-corrected normalized rotation is essential for interpreting the concentration dependence. The numerical values, units, equations, and uncertainty statements should be finalized after the tables and figures have been recalculated and checked against the original measurement records.
Funding Sources
The author(s) received no financial support for the research, authorship, and/or publication of this article.
Conflict of Interest
The author(s) do not have any conflict of interest.
Data Availability Statement
This statement does not apply to this article.
Ethics Statement
This research did not involve human participants, animal subjects, or any material that requires ethical approval.
References
- Alonso, E. R., León, I., Kolesniková, L., Mata, S., Alonso, J. L. Unveiling five naked structures of tartaric acid, Angewandte Chemie International Edition, 2021; 60, 17410–17414.
CrossRef - Anis, M., Shkir, M., Baig, M. I., Ramteke, S. P., Muley, G. G., AlFaify, S., Gramh, H. A. Experimental and computational studies of L-tartaric acid single crystal grown at optimized pH, Journal of Molecular Structure, 2018; 1170, 151–159.
CrossRef - Astbury, W. T. The crystalline structure and properties of tartaric acid, Proceedings of the Royal Society of London. Series A, Mathematical and Physical Sciences, 1923; 102, 506–528.
CrossRef - Austin, P. C. The rotatory dispersion of tartaric acid and its derivatives, Transactions of the Faraday Society, 1930; 26, 411–417.
CrossRef - Beckman, C. O., Cohen, K. Solvent action on optical rotatory power, The Journal of Chemical Physics, 1936; 4, 784–804.
CrossRef - Bešter-Rogač, M., Neueder, R., Barthel, J., Apelblat, A. Conductivity studies of aqueous solutions of stereoisomers of tartaric acids and tartrates. Part II: D-, L-, and meso-tartaric acids, Journal of Solution Chemistry, 1997; 26, 537–550.
CrossRef - Brown, D. H., McLellan, A. W. The effect of ion association on the optical rotatory dispersion of tartaric and mandelic acid complexes with molybdenum (VI), Journal of the Chemical Society A: Inorganic, Physical, Theoretical, 1968; 346–348.
CrossRef - Bruhat, G. The absorption and rotatory dispersion of solutions of tartaric acid, Transactions of the Faraday Society, 1930; 26, 400–411.
CrossRef - Choulis, N. H. Conductimetric studies of interactions of optically active ions I: Interactions of amphetamine with mandelic and tartaric acids, Journal of Pharmaceutical Sciences, 1972; 61, 293–294.
CrossRef - Derewenda, Z. S. On wine, chirality and crystallography, Acta Crystallographica Section A: Foundations of Crystallography, 2008; 64, 246–258.
CrossRef - Hargreaves, M. K., Richardson, P. J. The rotary power of D-(+)-tartaric acid and tartrates, 1957; 2260–2271.
CrossRef - Kharat, S. J. Density, viscosity, and refraction index studies of aqueous solutions of citric acid at different temperatures, International Journal of Applied Chemistry, 2008; 4, 23–235.
- Kuppusami, J., Lakshmanan, S., Suryanarayana, C. V. Anomalous solvent effect on the optical rotation of tartaric acid, Bulletin of the Chemical Society of Japan, 1967; 40, 2444–2446.
CrossRef - Lei, Y., Jia, H., Xu, H., Jiang, S. An optimized Drude’s equation for polarization measurement in the visible region and concentrations estimations, IEEE Photonics Society Publications, 2028; 10, 6100209.
- Lowry, M. The optical rotation of liquids: its variation with wavelength, temperature, solvent and concentration, Miscellaneous Publications, 1932; 1–106.
CrossRef - Lowry, T. M., Austin, P. C. VIII Bakerian Lecture. Optical rotatory dispersion. Part II: Tartaric acid and tartrates, Philosophical Transactions of the Royal Society A, 1922; 222, 249–308.
CrossRef - Lowry, T. M., Vernon, M. A. An improved method of ultra-violet polarimetry. Anomalous rotary dispersion of solvent tartrate, Proceedings of the Royal Society, 1928; 706–709.
CrossRef - Obowu, J. N., Ibezim-Ezeani, M. U., Abia, A. A. Jones-Dole coefficients and conductivity studies on electrolyte solutions of magnesium borohydride in mixtures of 1,2-dimethoxyethane–propylene carbonate and 2-methoxyethyl ether–propylene carbonate, International Journal of Applied Science and Technology, 2018; 8, 87–94.
CrossRef - Raghavan, V., Polavarapu, P. L. Specific optical rotation is a versatile tool for the identification of critical micelle concentration and micellar growth of tartaric acid–based diastereomeric amphiphiles, Chirality, 2017; 1–11.
CrossRef - Sing, M. D., Singh, K. B. On the origin of the optical inactivity of meso-tartaric acid, Journal of Chemical and Pharmaceutical Research, 2012; 4, 1123–1129.
- Xuan, J., Feng, Y. Enantiometric tartaric acid production using cis-epoxysuccinate hydrolase: history and perspectives, Molecules, 2019; 24, 903.
CrossRef - McMurry, J. E. Organic Chemistry, 6th ed.; Brooks/Cole: Pacific Grove, CA, 2003.
Accepted on: 14 Oct 2026
Second Review by: Dr. Shreya Shanyal
Final Approval by: Dr. Abdelwahab Omri


ISSN Online: 2231-5039