Advances in Bioanalytical Methods for Modern Drug Development
 , Vinay Ranjan Singh2, Phool Singh Yaduwanshi3, Surabhi Jain4and Aditya Narayan5,6*
1Department of Pharmacy, Sri Aurobindo Institute of Pharmacy, RGTU, Indore, India.
2Department of Pharmacy, Hitkarini College of Pharmacy, RGTU, Jabalpur, India.
3Department of Pharmacy, IITM, IES University, Bhopal, India.
4Department of Pharmacy, Monark Goswami college of Pharmacy, Ahmedabad, Gujarat, India.
5Department of Pharmaceutical Sciences and Natural Products, Central University of Punjab, Bathinda, India.
6Centre for Pharmaceutical Engineering Science, School of Pharmacy and Medical Sciences, University of Bradford, Richmond Road, Bradford BD7 1DP, United Kingdom.
Corresponding Author E-mail:aj.chinu@gmail.com
Download this article as:
ABSTRACT:New bioanalytical technology is playing a significant role in enhancing the speed, accuracy and cost-effectiveness of drug development and diagnostics. The basics of bioanalysis and the description of classical methods of analysis, such as spectroscopy, chromatography, mass spectrometry, electrochemical analysis of liquids, biosensors, ligand-binding assays, and immunoassays, are presented in this review. It reminds their foundational principles, the primary applications, their benefits, and shortcomings and provides a comparative evaluation that explains the merits of each strategy. Advanced innovations like AI-enabled mass spectrometry, ion-mobility spectrometry, lab-on-a-chip platforms and AI/ML-driven analytical solutions are also discussed in the review. Collectively, these technologies provide a high potential of improving biomarker discovery, pharmacokinetic analysis, and general performance of the bioanalytical process.
KEYWORDS:Ambient Ionization MS; Artificial Intelligence; Bioanalysis; Imaging Mass Spectrometry; Microfluidics; Pharmaceutical Analysis
Introduction
Importance of Bioanalysis
Bioanalysis is used to measure biological molecules and xenobiotics in the living system. It assists in outlining the absorption, distribution, metabolism, and excretion of drugs. Proteins, peptides, nucleic acids, sugars, amino acids, hormones, lipids, vitamins, and other natural compounds are all biological molecules. Most of them are biomarkers and assist in comprehending disease and drug action. Xenobiotics are the substances that enter the organism in particular in the form of drugs, metabolites, impurities, and toxins, which are not inherently present there. Their measurement is used to measure drug safety and pharmacokinetics. Bioanalysis gives PK profiles, PD correlations, bioequivalence data and biomarker levels whereas pharmaceutical analysis verifies the identity, purity, potency, and stability of drug substances and products (Figure 1). This is a critical process in every phase of drug discovery up to post-marketing1.
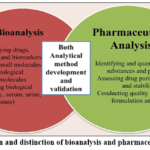 |
Figure 1: Union and distinction of bioanalysis and pharmaceutical analysis Click here to View Figure |
Early techniques involved colorimetric and spectrophotometric techniques (Figure 2). Separation was enhanced using HPLC and GC. Sensitivity was enhanced in GC-MS and LC-MS. Recent methods now involve ligand-binding assays, immunoaffinity LC-MS, and omics-based methods2. Modern bioanalysis is used to support small molecules, biosimilars, biomarkers, gene and cell therapies, point-of-care testing and biosensor-based detection. It is also useful in toxicology, diagnosis, and real- time monitoring3. There are strict guidelines followed in bioanalytical methods in FDA, EMA, and ICH (M10). The guidelines of FDA are concerned with accuracy, precision, selectivity, sensitivity, and stability. EMA guidelines consider cross-validation, method transfer and matrix effects. The ICH M10 guideline balances the two approaches4-6.
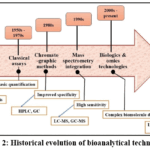 |
Figure 2: Historical evolution of bioanalytical techniques Click here to View table |
Classical Analytical Techniques: A Foundation
Bioanalytical analysis relies on traditional methods like UV-visible spectroscopy, infrared spectroscopy, fluorescence spectroscopy, and fundamental chromatographic techniques like TLC and column chromatography for everyday analysis and method development. Traditional analytical methods (as summarized in Table 1) in bioanalytical analysis are still prevalent, particularly in small labs.
Table 1: Comparison of spectroscopic techniques in bioanalytical applications
|
Spectroscopy Type/ Principle
|
Bioanalytical Applications | Benefits | Limitations | Ref. |
| UV-Visible Spectroscopy/ Absorption of UV and visible light by molecules | § Quantitative drug assessment.
§ Drug release studies § Kinetic analysis. |
§ Rapid.
§ Non-destructive. § Cost-effective. |
§ Low specificity.
§ Interference from solvents/excipients. |
7 |
|
Infrared Spectroscopy/ Molecular vibration and absorption of IR radiation |
§ Functional group identification.
§ Fingerprint analysis. |
§ Clear identification of functional groups.
§ Non-destructive. |
§ Interference from water.
§ Complex spectrum interpretation. |
8
|
| Fluorescence Spectroscopy/
Light emission after excitation by EMR |
§ Fluorescent drug quantification.
§ Drug-binding studies. § Degradation monitoring. § Residue analysis. |
§ Selective to nanomolar concentration. | § Limited to
fluorescent compounds. § Susceptible to quenching. |
9 |
Chromatographic Techniques
Chromatography helps in the identification, separation, and quantification of the bioanalysis since it forms a very important part of the bioanalysis process. It is necessary in regulatory filings, pharmacokinetic studies, and impurity profiling (Table 2). Bioanalytical analysis requires use of contemporary chromatographic methods such as HPLC and UHPLC. They are better in resolution, speed and eco-compatibility.
Table 2: Chromatographic techniques in bioanalysis
| Chromatographic Technique/ Principle | Bioanalytical Applications
|
Benefits | Limitations | Ref. |
| TLC
/ Separates based on differential adsorption and solubility on a stationary phase (e.g., silica gel) |
§ Drug/metabolite screening (e.g. steroids, Amino acids.).
§ Metabolic disorder diagnosis from urine (e.g. Phenylketonuria, cystinuria) |
§ Low cost.
§ Simple equipment. § Fast and easy to use. |
§ Limited resolution.
§ Mostly qualitative/semi-quantitative. § Manual interpretation |
10 |
| Classical Column Chromatography/ Separation based on size or polarity as compounds move through a packed column | § To isolate plasma protein, hormone, and antibodies from protein | § Scalable and adaptable.
§ Suitable for large sample volumes. |
§ Labor-intensive
§ Time- consuming § Requires skill for consistency |
11
|
| HPLC
/ Separation based on interactions with silica-based stationary phase under high pressure using binary mobile phases. |
§ Drug concentration-time profiles, AUC, Cmax determination for Bioavailability/bioequivalence studies in Blood or plasma.
§ Monoclonal antibodies, recombinant proteins, lysozyme, β2-microglobulin |
§ Broad applicability
§ Multiple detectors § Scalable and robust |
No |
12
|
|
GC / Separation of volatile, thermally stable compounds using inert gas and capillary columns. |
§ Pharmacokinetic (ADME) studies for Blood/ plasma/ urine/ tissues.
§ Therapeutic drug monitoring. § Screening of Drug of abuse in Urine/blood. |
§ Highly sensitive.
§ Excellent for volatiles. |
§ Limited to volatiles.
§ May require derivatization. |
13
|
| UHPLC
/ Uses tiny particles and high pressure for faster, sharper separations. |
§ High-throughput clinical/preclinical testing.
§ Peptide & oligonucleotide analysis. § UHPLC-MS/MS in biomarker studies.
|
§ Fast analysis.
§ High resolution. § Lower solvent use. |
§ Expensive equipment
§ System maintenance § Column backpressure sensitivity. |
14
|
|
SFC / Separates chemicals using a supercritical fluid that behaves like both a liquid and gas, allowing fast and efficient separation. |
§ Chiral separation.
§ Lipophilic drug profiling. § Steroid & vitamin analysis.
|
§ Fast & efficient.
§ Low toxicity. § Good for labile compounds. |
§ Limited stationary phases.
§ Needs CO₂-compatible systems |
15-16 |
Mass Spectrometry and Coupled Techniques
Mass spectrometry (MS) is a crucial tool in bioanalytical research. It enables identification, characterization, and quantification of metabolites, and biomolecules. Its combination with chromatographic systems, tandem MS, and high-resolution MS has transformed bioanalysis (Table 3). Mass spectrometry has revolutionized the pharmaceutical industry by enabling high-throughput, ultrasensitive analysis of medicines, metabolites, and biomolecules. Its applications in systems biology, metabolomics, and proteomics have enabled precision medicine and customized treatments. Proficiency in ionization methods is crucial17.
Table 3: Mass spectrometry and coupled techniques in pharmaceutical bioanalysis
| Technique/Principle | Bioanalytical Applications | Benefits | Limitations | Ref. |
| LC-MS/MS (Tandem MS)/ separates compounds by liquid chromatography, then identifies them by fragmenting their ions for highly specific detection | § PK/TK.
§ Bioequivalence. § TDM. |
§ Ultra-low detection limits.
§ High specificity. |
§ Complex instrumentation. |
2
|
| GC-MS/ Ionizes volatile compounds via EI; separates and detects based on m/z | § Residual solvents | § High resolution
§ established libraries |
§ Limited to volatile/semi-volatile compounds. | 18
|
| SFC-MS/ Combines supercritical fluid chromatography with MS detection | § Chiral analysis.
§ Lipophilic drugs. |
§ Fast
§ Low solvent use |
§ Limited availability.
§ Less common. |
19 |
| HRMS (Orbitrap, TOF, QTOF)/ Measures ions with high resolving power and mass accuracy | § Metabolomic, proteomics, impurity profiling. | § Accurate mass.
§ untargeted profiling. |
§ Expensive
§ Data complexity |
20-21
|
| CE-ICP-MS/ CE separates species (often ionic species of elements) by electrophoretic mobility. ICP-MS detects elemental ions with high sensitivity, enabling species/speciation analysis of metals/inorganic impurities. | § Speciation of trace metals/inorganic impurities in pharmaceuticals and medicinal raw materials.
§ speciation (e.g. forms of arsenic, selenium etc.) relevant to safety/toxicity assessments. |
§ Ability to resolve different chemical species (valence states, complexes) of metals—important since toxicity depends on species.
§ Very low detection limits owing to ICP-MS sensitivity. § Small sample volume; separation with CE can be fast and with high efficiency. |
§ Instrumental complexity.
§ Lower robustness /reproducibility compared to more mature LC-ICP-MS or LC-MS systems. § Limited reference data / standards for many species. § Sensitivity can be compromised by signal suppression or interferences in ICP-MS depending on matrix. |
22-24 |
| CE-MS/ CE separates analytes (peptides, small molecules, charged compounds etc.) by electrophoretic mobility. MS detects and usually identifies/quantifies by mass-to-charge ratio. Often electrospray ionization is used at the interface. | § Proteomics/ Peptidomics: biomarker discovery, disease diagnosis and monitoring.
§ Analysis of charged pharmaceutical compounds (peptides, small polar drugs etc.). § Profiling of metabolites or endogenous small molecules in biological fluids relevant to drug effects / toxicity. § Quality control for variants (e.g. post-translational modifications, isoforms). |
§ High separation efficiency for charged/polar analytes
§ Good peak resolution. § Very low sample volume required. § Ability to analyze small/complex mixtures with minimal sample preparation. § Faster separations in many cases; complementary separation mechanisms (different from LC). § Good sensitivity, especially when optimized interfaces and coatings are used. |
§ Sensitivity often lower than LC-MS for noncharged / less polar compounds.
§ Reproducibility issues: migration times, capillary coating, ionization variability. § Interface challenges: coupling CE to MS has issues with flow rate, spray stability, etc. § Lower sample loading capacity (limits amount of analyte which can be injected), which can limit detection of very low abundance analytes. |
25-26 |
Electrochemical and Biosensor-Based Techniques
Potentiometry, amperometry, and voltammetry are important electrochemical methods in bioanalysis (Table 4). Potentiometry measures ion activity using ion-selective electrodes. It is used for electrolyte testing, heparin/protamine detection, and immunoassay biosensors. Amperometry measures current at a fixed potential. It is common in glucose biosensors, flow-injection drug analysis, and vesicle release studies. Voltammetry detects analytes using varying potentials. It is useful for trace metals and drug quantification in biological samples. These methods are sensitive, selective, low-cost, and easy to miniaturize. They are suitable for point-of-care and rapid testing. Bioanalysis is moving toward electrochemical and biosensor-based platforms. Electrophoretic techniques also help to analyze complex biological samples.
Capillary electrophoresis (CE) is a fast and efficient separation technique used in bioanalysis. It needs very small sample volumes and separates analytes based on their electrophoretic mobility in a narrow capillary under an electric field37. CE can achieve very high separation efficiency, up to 600,000 theoretical plates per meter. It is used for DNA sequencing, genotyping, protein and peptide analysis, and measuring small drugs and metabolites in biological samples. When combined with MS or fluorescence detection, it gives higher sensitivity for biomarkers, forensic testing, and drug monitoring. CE uses little solvent and works well with complex samples, making it useful for high-throughput testing and metabolomics38-40.
Some methods of luminescence, which are employed in trace analysis, sensitivity, impurity detection, and monitoring of low concentrations, consist of fluorimetry and phosphorimetry. Fluorimetry is a process whereby molecules absorb light and re-emit it instantly or slowly. These methods are very sensitive particularly in cases where the background absorption is very low. They are applicable in drug testing, impurity testing, monitoring of drug release, drug-protein and drug-ligand interactions, and stability testing. Fluorimetry is particularly useful for identifying low-level contaminants and determining impurities in pharmaceutical formulations. On the other hand, phosphorimetry is employed when extended emission durations are useful, such as in low temperature or solid phases, or to distinguish between background fluorescence and scatter. It has low detection limits and straightforward sample handling. However, these techniques have drawbacks, such as internal filter effects, overlap in excitation/emission spectra, photobleaching, quenching, and limited applicability. Reproducibility may be compromised in some situations due to background light interference or stray fluorescence41-43.
Titration or volumetric analysis, is a well-established method of quantitation in pharmaceutical analysis. It entails the reaction of the definite quantity of the chemical reagent to analyte sample in such a way so that the reactants attain a certain point of equivalency. They include acid-base neutralization, redox titrations, precipitation titrations, complexometric titrations as well as non-aqueous titrations. These techniques are also usually employed in pharmacopeias to control the quality of raw materials, dosage forms, and bulk medications. Nevertheless, titrimetric methods have some shortcomings, including the use of pure analyte, clarity of endpoints and stochiometric reactions. Visual endpoints can be obscured due to impurities, interfering species or colored matrices. The medication that has buffering strength or weak acids/bases might need non-aqueous titration. Titrimetry might not be a good method on trace contaminants or low concentration analysis because of their low level of sensitivity. These limitations are reducing with new methods of titration, including potentiometric endpoints, non-aqueous titrations, and micro-titrations44-45.
Table 4: Electrochemical and biosensor techniques in bioanalysis
| Technique/ Principle | Bioanalytical Applications | Benefits | Limitations | Ref. | |
| Potentiometry/ Measures EMF without significant current; relates to analyte concentration via Nernst equation. | § Electrolyte monitoring (like Na⁺, K⁺ in blood).
§ Heparin or protamine detection in plasma. |
§ Non-destructive
§ Real-time analysis. § Simple. |
§ Limited to ionic analytes
§ Low sensitivity. |
28 | |
| Amperometry/ Measures current from oxidation/reduction at constant potential; current ∝ analyte concentration. | § Glucose sensors.
§ Vesicles release their contents from cells in real time using electrical signals. |
§ High sensitivity
§ Fast response. |
§ Requires stable
electrodes § Frequent calibration. |
29 | |
| Voltammetry/ Measures current while varying potential; includes CV, DPV, SWV | § Redox behavior.
§ Antioxidant analysis. § Drug–DNA interaction. |
§ Good for
kinetic studies. § Multiple analyte detection. |
§ Electrode fouling;
§ Complex interpretation. |
28 | |
| Polarography/ Electroanalytical method measuring current–voltage curves at a dropping mercury electrode; diffusion current proportional to analyte concentration.
|
§ Trace metal/inorganic impurity analysis (Pb, Cu, etc.)
§ Impurity profiling in formulations. § Drug/metabolite monitoring in biological fluids. |
§ § High sensitivity (µM–nM) for electroactive species. § Low-cost, simple instrumentation. § Minimal sample preparation. § Can work in turbid/colored solutions. § Distinguishes analytes by half-wave potential. |
§ Mercury toxicity and disposal issues.
§ Non-electroactive drugs require derivatization. § Interference from overlapping waves.
|
30-32 | |
| Enzyme-Based Biosensors/ Enzyme reacts with target generates electroactive species measured by transducer. | § Glucose monitoring.
§ Urea detection. § Alcohol testing. |
§ High selectivity.
§ Rapid and sensitive. |
§ Enzyme stability issues.
§ Limited shelf-life. |
33 | |
| Immunosensors/ Uses antibody-antigen interactions transduced to electrical/optical signals. | § Cytokine detection
§ Pathogen monitoring. |
§ High specificity.
§ Multiplexing possible. |
§ Antibody cost and
stability
|
34 | |
| Aptamer-Based Sensors/ Aptamers bind target molecules; signal transduced electrochemically or optically. | § Monitoring drugs.
§ Detecting antibiotics. § Biomarker detection. |
§ High stability
§ Synthetic and modifiable. |
§ Lower affinity vs. antibodies in some cases. | 35 | |
| Lab-on-a-Chip (LOC)/ Miniaturized system integrating analysis steps on microfluidic platform. | § POC diagnostics,
§ On-chip screening, § PK profiling. |
§ Low sample volume.
§ Rapid. § portable. |
§ Fabrication complexity.
§ Integration challenges. |
36
|
Spectroscopic Techniques Beyond Basics
Surface-enhanced Raman spectroscopy (SERS) is a highly sensitive bioanalytical technique. It uses gold or silver nanoparticles to greatly amplify Raman signals. This enhancement can reach 10*10–10*11, allowing the detection of single molecules in biological samples. SERS gives fast and nondestructive molecular information. It works well in aqueous samples and needs very little sample preparation.
SERS is widely used in bioanalysis (Table 5). It helps detect pathogens at the single-cell level, including antibiotic-resistant bacteria such as S. aureus and P. aeruginosa directly from patient samples. It supports early cancer diagnosis and can achieve high prediction accuracy. SERS is also useful for DNA and nucleic acid sensing in disease detection. It is applied in therapeutic drug monitoring, live-cell imaging, metabolic profiling, and trace biomarker detection in serum and plasma.
Table 5: Comparative summary of advanced spectroscopic techniques in bioanalysis
| Technique/
Principle |
Bioanalytical Applications | Benefits | Limitations | Ref. |
| NMR
/ Magnetic nuclei absorb RF radiation in a magnetic field; chemical shifts reveal molecular structure. |
§ Characterizing conformational changes and molecular dynamics of biomolecules in solution.
§ Studying drug–protein, protein–protein, and ligand–receptor interactions at atomic resolution. § Characterizing conformational changes and molecular dynamics of biomolecules in solution. § Monitoring drug–metabolite formation and metabolic pathways in PK studies. |
§ Non-destructive.
§ Highly reproducible. § No chromatography needed. |
§ Requires expensive instrumentation.
§ Limited sensitivity for low-abundance nuclei. |
46
|
|
Raman Spectroscopy/ Inelastic scattering of laser light reveals molecular vibrational modes (fingerprint). |
§ Polymorph identification.
§ Process Analytical Technology (PAT). § Counterfeit detection. § Excipient identification. |
§ Minimal sample preparation
§ Works through containers. § No water interference. |
§ Fluorescence interference.
§ Low sensitivity for weak scatterers. |
47
|
| CD/
Differential absorption of circularly polarized light by chiral molecules; reveals secondary and tertiary structure. |
§ Protein therapeutic characterization.
§ Protein folding studies. § Batch consistency of biologics. |
§ Sensitive to biomolecular structure.
§ Useful for chiral compounds. |
§ Requires optically active samples.
§ Limited to certain spectral regions. |
48 |
| SERS/
Raman signal enhanced by metal nanoparticles (LSPR + charge transfer); enables ultra-trace analysis. |
§ Trace detection of contaminants.
§ In-field diagnostics. § Biosensing applications. |
§ Extremely high sensitivity
§ Minimal sample preparation. § Label-free detection. |
§ Reproducibility issues.
§ Substrate preparation challenges. |
49
|
| LC–NMR /
Combines chromatographic separation (LC) with structural elucidation by NMR spectroscopy, allowing direct characterization of compounds after separation. |
§ Structural identification of drug metabolites directly after chromatographic separation.
§ Real-time characterization of unstable or short-lived metabolites without isolation. § Comprehensive profiling of metabolites in pharmacokinetic and metabolomic studies. |
§ Provides detailed structural information without the need for complete isolation.
§ Non-destructive technique. § Useful for complex mixtures. |
§ Limited sensitivity compared to LC–MS.
§ Requires high sample amounts. § High cost and complex instrumentation. |
50-51 |
Ligand Binding Assays and Immunoassays
LBAs (Ligand binding assays) and immunoassays are crucial bioanalytical tools for measuring big biomolecules like proteins, peptides, antibodies, and hormones. They offer excellent specificity and sensitivity, crucial for clinical diagnostics, medication monitoring, biomarker identification, and biologics development (Table 6). Ligand binding assays and Immunoassays are crucial for biotherapeutics and biomarkers detection and quantification. They have evolved from ELISA and RIA to multiplexed platforms like Luminex and MSD, becoming essential for clinical trials and regulatory compliance.
Table 6: Summary of ligand binding assays and immunoassay platforms
| Technique or Platform/ Principle | Bioanalytical Applications | Benefits | Limitations | Ref. |
| ELISA/ Enzyme-linked antibody binds to antigen; substrate addition leads to detectable signal proportional to analyte | § Cytokine quantification (IL-6, TNF-α)
§ Pharmacokinetics of mAbs. § Immunogenicity testing. § Hormone and peptide quantification. |
§ High throughput
§ High sensitivity (pg/mL). § Automation-ready. |
§ Multiple washing steps.
§ Potential cross-reactivity. |
52 |
|
RIA/ Radio-labeled and unlabeled antigen compete for antibody; radioactivity inversely proportional to analyte |
§ Hormone measurement (thyroxine, cortisol).
§ Drug quantification (Digoxin, Morphine). § Early-stage pharmacokinetics. |
§ Extremely high sensitivity (fg/mL).
§ Suitable for small molecules. |
§ Radioactive waste.
§ Regulatory and safety concerns. |
53 |
| Homogeneous / no separation step vs. Heterogeneous Immunoassays/requires separation (e.g., washing) | § High-throughput screening.
§ Regulated bioanalytical assays. § Diagnostic testing. |
Homogeneous | 54 | |
| § Fast, simple. | § Lower sensitivity. | |||
| Heterogeneous | ||||
| § High specificity/
sensitivity. |
§ Time-consuming. | |||
|
PCR / Amplifies specific DNA sequences using cycles of denaturation, annealing, and extension by DNA polymerase. |
§ Detection of pathogens.
§ Genotyping. § Pharmacogenomics. § Quality control in biopharmaceuticals. § Genetic stability testing. |
§ High sensitivity and specificity.
§ Rapid detection. |
§ Susceptible to contamination leading to false positives.
§ Requires prior sequence knowledge. § Limited for quantification (unless qPCR is used). |
55-56 |
|
Immuno-PCR/ Combines antibody-based antigen recognition with PCR amplification using DNA-labeled antibodies as reporters. |
§ Ultra-sensitive detection of proteins, biomarkers, toxins, and pathogens in pharmaceutical and clinical samples. | § Combines specificity of immunoassays with high sensitivity of PCR.
§ Detects very low-abundance targets. |
§ Method complexity.
§ Requires careful optimization. Prone to nonspecific binding. |
57 |
| Luminex xMAP Technology/ Multiplex bead-based immunoassay with laser detection using fluorescent-labeled microspheres | § Multiplexed cytokine profiling.
§ Biomarker discovery. § Clinical pharmacodynamic studies.
|
§ Multiplexing up to 500 analytes.
§ Low sample volume. |
§ Cross-reactivity validation.
§ Requires Luminex reader.
|
58
|
|
Emerging Platforms (MSD)/ Electrochemiluminescence, Gyrolab/ Microfluidic immunoassay, Quanterix/ Digital ELISA with femtogram detection)
|
§ Biologics PK/PD studies.
§ Ultra-sensitive biomarker detection. § Clinical and research diagnostics. |
§ Ultra-sensitive (fg/mL).
§ Automation-compatible. |
§ High cost Specialized instrumentation. |
54,59 |
Emerging and Hybrid Techniques in Bioanalysis
Advanced bioanalytical methods that need minimal sample preparation and offer real-time, high-resolution measurements are gradually replacing traditional LC-MS/MS and immunoassays. Imaging mass spectrometry maps the spatial distribution of drugs and metabolites directly from tissue surfaces through processes such as MALDI desorption–ionization. Ambient ionization MS techniques, like DESI and DART, allow direct ionization of samples without extraction or chromatography. Microfluidics-based lab-on-a-chip platforms perform separation, reaction, and detection in miniaturized channels using very small sample volumes. AI and ML algorithms process large spectral datasets, remove noise, detect patterns, and predict pharmacokinetic or toxicity outcomes. These mechanisms enable rapid, sensitive, and spatially resolved characterization of analytes. Together, these innovations strengthen bioanalytical workflows, improve understanding of drug behavior, and support personalized medicine.
Ambient ionization mass spectrometry (AI-MS) One technique which enables the analysis of a sample in real-time and in the natural state at atmospheric pressure is ambient ionization mass spectrometry (AI-MS). Its major characteristics are speed of analysis, little sample preparation, compatibility with complicated matrices and high-resolution MS systems.
Desorption Electrospray Ionization (DESI) The technique is called Desorption Electrospray Ionization (DESI), and it is a technique that integrates electrospray ionization and desorption, enabling the analysis of a sample with a high level of spatial resolution, operates in the ambient and sensitive drug profiling. They are used in forensic pharmacological analysis, localization of drugs and deterioration products on packaging surfaces.
In the Direct Analysis in Real Time (DART) technique, the ionizing analytes is treated with hot gas stream. It is fast, needs little preparation, and can be used in the metabolite screening, drug counterfeiting detection, and in API quality monitoring.
Imaging mass spectrometry (IMS): Imaging mass spectrometry (IMS) is a combination of imaging and analytical techniques that visualizes the spatial distribution of molecules, such as proteins, metabolites or drugs, directly at the surface of a sample, e.g., a tissue section, without requiring separation or purification steps.
Matrix-Assisted Laser Desorption/Ionization (MALDI): Matrix-Assisted Laser Desorption/Ionization (MALDI) Imaging is an extensive method that works well with proteins, peptides and lipids. It provides high-resolution imaging, often with time-of-flight analyzers, and finds use in lipidomics, proteomics, tissue distribution analysis and tumor mapping.
Elemental and small molecule analysis, such as metabolite monitoring, pharmacodynamics studies, and preclinical toxicity screening is done using secondary ion mass spectrometry (SIMS) and DESI imaging. DESI imaging is a particular combination of the ambient ionization and spatial mapping.
Lab-on-a-Chip (LOC) systems are analytical tools that incorporate detection, separation, reaction and sample preparation on a microchip. Such systems are characterized by high throughput, low use of reagents and automation compatibility.
Droplet-Based microfluidics systems In Droplet-Based microfluidics systems, sample processing and analysis are performed by small droplets of immiscible carriers (e.g., oil). This technology assists in different assays such as PCR, ELISA, MS, Fluorescence, and digital bioassays, which allow the resolution of single-cell or single-molecule. The method allows the label-free quantification of analytes and the real-time reaction monitoring by combining with fluorescence, Raman, and electrochemical detection systems. It is designed to be used in high throughput applications such as pharmacogenetic profiling, therapeutic drug monitoring, and portable diagnostics during clinical trials.
Artificial Intelligence/Machine Learning (AI/ML) to preprocess data, extract features, remove baselines and normalize, smooth, reduce dimensions, and pick peaks. CNNs and decision trees are better than traditional algorithms, whereas random forest models are utilized to recognize the peaks in noisy MS datasets. Quality control, predictive modeling, pattern identification, outlier detection, and concentration prediction also are control tasks carried out with AI. The AI-based health application has proven to be effective in tumor margin identification, metabolic flux analysis, space pharmacokinetic model, and real-time forensic pharmaceutical analysis. Some of the central issues include standardization and validation of AI models, sample variability, cost and fabrication barriers, and data overload in imaging mass spectrometry. The future directions include the integration of multi-omics, AI-driven automation of the laboratory, and sensors as a part of bioanalytical systems60-64.
Comparison of conventional and modern Methods65-66
| Aspects | conventional Methods | Modern Methods |
| Sensitivity | Limited sensitivity. | Ultra-sensitive (nanogram–picogram). |
| Selectivity | Poor selectivity. | High selectivity with MS/MS, biosensors, and Raman-based methods. |
| Sample Preparation | Time-consuming extraction and cleanup. | Minimal or no preparation (direct ionization, microfluidics). |
| Throughput | Low throughput. | High-throughput screening possible. |
| Accuracy and Precision | Higher variability and operator-dependent. | High accuracy and reproducibility. |
| Matrix Effect | Significant interference from plasma, urine, etc. | Reduced by advanced separation/detection. |
| Quantification | Limited quantitative power. | Robust quantification with internal standards. |
| Cost | Cheaper, widely accessible. | High capital and maintenance cost. |
| Expertise Required | Moderate training needed. | Requires high-level expertise. |
| Portability | Lab-bound, bulky. | Portable biosensors emerging. |
| Data Handling | Simple datasets, manual interpretation. | Complex data, requiring bioinformatics. |
| Regulatory Acceptance | Long-established and accepted. | Emerging, evolving regulatory frameworks. |
Case Studies Highlighting Advances in Bioanalysis
Case study 1: According to the single cell proteomics analysis of drug response, Straubhaar et. al. has demonstrated that it can be used as a drug discovery platform.
Rationale
Single-cell analysis in biology and biomedicine has been an important method of cell association, which entails cell type, states, transitions and localization. Such methods as the use of fluorescence tags, nanoscale super-resolution imaging, single-cell RNA sequencing, and proteomics shed more light on biological processes that cannot be depicted by bulk analysis. The discipline makes possible studying variability in drug response and advancing the understanding of complex systems, including cancer, inflammation and aging. The current developments in the field of single cell proteomics enable the measurement of thousands of proteins in individual cells. The article presents a new mass spectrometry-based single-cell proteome analysis, SCREEN, that is expected to be much more efficient and quicker than the old ones. The article examines the proteome profiling in varying drug conditions to examine the heterogeneity of cancer cells and deals with issues and current trends in single-cell proteomics67.
Case study 2: Blas-Munoz et. al. reveals a variety of keto reductases important in pharmaceutical production in case study 2 through the use of a microfluidics-based ultra-high-throughput screening.
Rationale
Keto reductases (KREDs) are valuable biocatalysts to the synthesis of enantioselectively chiral alcohols. Here, Thai et al. optimized the low-throughput assay to a ultrahigh-throughput screening platform, that relies on droplet microfluidics, fluorescence-activated cell sorting (FACS) and fluorescence-based detection. This new technique has been effective to screen 1.5 million clones and has been successful in identifying KREDs that are less homologous to known enzymes and have novel substrate specificities. It also made the initial screening of KRED in microdroplets by metagenomic screening a reality, and opened up the prospects of large-scale enzyme discovery and evolution screenings68.
Case study 3: Optimizing drug discovery: Surface plasmon resonance techniques and their multifunctional uses by Acharya et. al.
Rationale
Surface Plasmon Resonance (SPR) sensors have been developed, the advantages include real-time tracking of biomolecular interactions, label-free detection, high sensitivity, and ability to analyze multiple layers at the same time. These properties make SPR biosensors very important in the pharmaceutical industry to ascertain the efficacy and safety of therapeutic effects. The review identifies the current developments in SPR biosensors, their use in drug development, challenges and prospects in the pharmaceutical sector69.
Bioanalytical Sample Analysis Workflow
A bioanalytical workflow in sample-analysis is described by the Figure 3. It begins with the definition of the goal of the analysis and the choice of the most appropriate method to the target molecule. It is then followed by sample collection and preparation to represent clean and uniform samples. The method conditions, instrument setups are optimized and calibration standards and quality controls are run. The samples are then subjected to analysis and quantitative and interpretative data generated are processed. Validation tests are used to ensure that the method is accurate, precise, and reliable. The final stage of the work is the preparation of a finished report, which records the findings, chromatograms, spectra, and conclusions70-72.
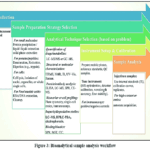 |
Figure 3: Bioanalytical sample analysis workflow Click here to View Figure |
Conclusion
To summarize, new bioanalytical technologies are greatly improving pharmaceutical research. Classical methods such as spectroscopy, chromatography, mass spectrometry, electrochemistry, biosensors, ligand-binding assays, and immunoassays still provide reliable results, but they often need more sample preparation and take longer to analyze. Modern tools such as ambient ionization MS, imaging MS, microfluidic lab-on-a-chip systems, and AI/ML analytics offer faster testing, less sample handling, higher sensitivity, and spatial or real-time information. Their main limitations include high instrument cost, complex data processing, and limited regulatory acceptance.
Future work should focus on making these methods easier to use, more standardized, and more compatible with routine laboratory workflows. Stronger automation and clear regulatory guidelines will support wider implementation. As these technologies grow, they will speed up drug discovery, improve pharmacokinetic and biomarker studies, and advance personalized medicine.
Acknowledgment
The authors sincerely acknowledge their respective universities for their continuous support throughout this work.
Funding Sources
The author(s) received no financial support for the research, authorship, and/or publication of this article.
Conflict of Interest
The author(s) do not have any conflict of interest.
Data Availability Statement
This statement does not apply to this article.
Ethics Statement
This research did not involve human participants, animal subjects, or any material that requires ethical approval.
References
- Viswanathan CT.; Bansal S.; Booth B.; DeStefano AJ.; Rose MJ.; Sailstad J.; Shah VP.; Skelly JP.; Swann PG.; Weiner R. Quantitative bioanalytical methods validation and implementation: Best practices for chromatographic and ligand binding assays., AAPS J., 2007, 9(1), E30–E42. doi: https://doi.org/10.1208/aapsj0901004.
CrossRef - Jemal M. High-throughput quantitative bioanalysis by LC/MS/MS., Biomed. Chromatogr., 2000, 14(6), 422–429. doi: https://doi.org/10.1002/1099-0801(200010)14:6.
CrossRef - Smolec J.; DeSilva B.; Smith W.; Weiner R.; Kelly M.; Lee B.; Khan M.; Tacey R.; Hill H.; Celniker A.; Shah V.; Bowsher R.; Mire-Sluis A.; Findlay JWA.; Saltarelli M.; Quarmby V.; Lansky D.; Dillard R.; Ullmann M.; Keller S.; Karnes HT. Bioanalytical method validation for macromolecules in support of pharmacokinetic studies., Pharm Res., 2005, 22(9), 1425–1431. doi: https://doi.org/10.1007/s11095-005-5917-9.
CrossRef - U.S. Food and Drug Administration. Bioanalytical Method Validation: Guidance for Industry. Silver Spring, MD: U.S. FDA; 2018.
- European Medicines Agency. Guideline on Bioanalytical Method Validation. EMA/CHMP/EWP/192217/2009; London, UK: EMA; 2011.
- International Council for Harmonisation of Technical Requirements for Pharmaceuticals for Human Use. ICH Harmonised Guideline: Bioanalytical Method Validation and Study Sample Analysis (M10). ICH; 2022.
- Beckett AH, Stenlake JB. Practical Pharmaceutical Chemistry. Vol. 1, 4th ed.; New Delhi: CBS Publishers & Distributors; 2006:275–300. ISBN: 978-9387964495.
- Silverstein RM, Webster FX, Kiemle DJ, Bryce DL. Spectrometric Identification of Organic Compounds. 8th ed.; Hoboken, NJ: Wiley; 2014:71-125. ISBN: 978-0-470-61637-6.
- Lakowicz JR. Principles of Fluorescence Spectroscopy. 3rd ed.; New York: Springer; 2006:1-26. Doi: https://doi.org/10.1007/978-0-387-46312-4
CrossRef - Stahl E. Thin Layer Chromatography: A Laboratory Handbook. 2nd ed.; Berlin: Springer; 1969;1-400. Doi: https://doi.org/10.1007/978-3-642-88488-7
CrossRef - Poole CF. The Essence of Chromatography. 2nd ed.; Amsterdam: Elsevier; 2013:1-78. ISBN: 0444501983.
- Dong, M. W. Modern HPLC for Practicing Scientists; John Wiley & Sons: 2006:1-100. ISBN 978-0-471-72789-7.
- Grob RL, Barry EF. Modern Practice of Gas Chromatography. 4th ed.; Hoboken, NJ: Wiley; 2004:1-100, 739-768. Doi: https://doi.org/10.1002/0471651141.
CrossRef - Swartz M. Ultra performance liquid chromatography (UPLC): an introduction and review., J Liq Chromatogr Relat Technol., 2005, 28(7–8), 1253–1263. doi: https://doi.org/10.1081/JLC-200053046.
CrossRef - Webster GK. Supercritical Fluid Chromatography: Advances and Applications in Pharmaceutical Analysis. Singapore: Pan Stanford Publishing; 2014:1-50. Doi: https://doi.org/10.4032/9789814463010
- Berger TA. Instrumentation for analytical scale supercritical fluid chromatography., J Chromatogr A., 2015, 1421, 171–183. doi: https://doi.org/10.1016/j.chroma.2015.07.062.
CrossRef - Gross JH. Mass Spectrometry: A Textbook. 3rd ed.; Cham, Switzerland: Springer; 2017:1-50. Doi: https://doi.org/10.1007/978-3-319-54398-7.
CrossRef - Sparkman OD, Penton Z, Kitson FG. Gas Chromatography and Mass Spectrometry: A Practical Guide. 2nd ed.; Oxford, UK: Academic Press; 2011:1-78. Doi: https://doi.org/10.1016/C2009-0-17039-3.
CrossRef - Jajoo VS.; Sawale AV. Recent advances in supercritical fluid chromatography., Res J Sci Technol., 2024, 16(1), 87–96. doi: https://doi.org/10.52711/2349-2988.2024.00014.
CrossRef - Allen DR.; McWhinney BC. Quadrupole time-of-flight mass spectrometry: A paradigm shift in toxicology screening applications.. Clin Biochem Rev., 2019, 40(3), 135–146. doi: https://doi.org/10.33176/AACB-19-00023.
CrossRef - Lin C.; Tian Q.; Guo S.; Xie D.; Cai Y.; Wang Z.; Chu H.; Qiu S.; Tang S.; Zhang A. Metabolomics for clinical biomarker discovery and therapeutic target identification., Molecules., 2024, 29, 2198. doi: https://doi.org/10.3390/molecules29102198.
CrossRef - Timerbaev AR.; Pawlak K.; Aleksenko SS.; Foteeva LS.; Matczuk M.; Jarosz M. Advances of CE-ICP-MS in speciation analysis related to metalloproteomics of anticancer drugs., Talanta., 2012, 102, 164–170. doi: https://doi.org/10.1016/j.talanta.2012.07.031.
CrossRef - Matczuk M.; Ruzik L.; Timerbaev AR. Recent development of CE-ICP-MS in biospeciation research and analysis: From anticancer drugs to nanoparticles and beyond., TrAC Trends Anal Chem., 2024, 180, 117967. doi: https://doi.org/10.1016/j.trac.2024.117967.
CrossRef - Rao RN.; Talluri MVNK. An overview of recent applications of inductively coupled plasma–mass spectrometry (ICP-MS) in determination of inorganic impurities in drugs and pharmaceuticals., J Pharm Biomed Anal., 2007, 43(1), 1–13. doi: https://doi.org/10.1016/j.jpba.2006.07.004.
CrossRef - Mischak H.; Schanstra JP. CE-MS in biomarker discovery, validation, and clinical application., Proteomics Clin Appl., 2011, 5(1–2), 9–23. doi: https://doi.org/10.1002/prca.201000058.
CrossRef - Pontillo C.; Filip S.; Borràs DM.; Mullen W.; Vlahou A.; Mischak H. CE-MS-based proteomics in biomarker discovery and clinical application., Proteomics Clin Appl., 2015, 9(3–4), 322–334. doi: https://doi.org/10.1002/prca.201400115.
CrossRef - Bhavyasri K.; Mounika G. Applications of CE-MS in pharmaceutical field., Int J Pharm Sci Res., 2020, 11(2), 563–572. doi: https://doi.org/10.13040/IJPSR.0975-8232.11(2).563-72.
CrossRef - Skoog DA.; Holler FJ Crouch SR. Principles of Instrumental Analysis. 7th ed.; Boston, MA: Cengage Learning; 2017:490-560. ISBN: 9781337670074.
- Wang J. Analytical Electrochemistry. 3rd ed.; Hoboken, NJ: Wiley; 2006:1-50. ISBN: 978-0-471-79030-3.
- Nesměrák K.; Chalupa R. Polarography and pharmacy: A centenary of mutual interaction., Monatsh Chem., 2023, 154, 941–948. doi: https://doi.org/10.1007/s00706-023-03097-w.
CrossRef - Page JE. Applications of polarography in pharmaceutical analysis., J Pharm Pharmacol., 1952, 4(1), 1–20. doi: https://doi.org/10.1111/j.2042-7158.1952.tb13105.x.
CrossRef - Silver IA. Polarography and its biological applications., Phys Med Biol., 1967, 12(3), 285–299. doi: https://doi.org/10.1088/0031-9155/12/3/201.
CrossRef - Turner APF. Biosensors: Sense and sensibility., Chem Soc Rev., 2013, 42(8), 3184–3196. doi: https://doi.org/10.1039/c3cs35528d.
CrossRef - Patil AV.; Chuang YS.; Li C.; Wu CC. Recent advances in electrochemical immunosensors with nanomaterial assistance for signal amplification., Biosensors., 2023, 13, 125. doi: https://doi.org/10.3390/bios13010125.
CrossRef - Song S.; Wang L.; Li J.; Fan C.; Zhao J. Aptamer-based biosensors., TrAC Trends Anal Chem., 2008, 27(2), 108–117. doi: https://doi.org/10.1016/j.trac.2007.12.004.
CrossRef - Yetisen AK.; Akram MS.; Lowe CR. Paper-based microfluidic point-of-care diagnostic devices., Lab Chip., 2013, 13, 2210–2251. doi: https://doi.org/10.1039/C3LC50169H.
CrossRef - Breadmore MC.; Grochocki W.; Kalsoom U.; Alves MN.; Phung SC.; Rokh MT.; Cabot JM.; Ghiasvand A.; Li F.; Shallan AI.; Keyon AS.; Alhusban AA.; See HH.; Wuethrich A.; Dawod M.; Quirino JP. Recent advances in enhancing the sensitivity of electrophoresis and electrochromatography in capillaries and microchips (2016–2018)., Electrophoresis., 2019, 40(1), 17–39. doi: https://doi.org/10.1002/elps.201800384.
CrossRef - Shah M.; Patel N.; Tripathi N.; Vyas VK. Capillary electrophoresis methods for impurity profiling of drugs: A review of the past decade., J Pharm Anal., 2022, 12(1), 15–28. doi: https://doi.org/10.1016/j.jpha.2021.06.009.
CrossRef - Voeten RLC.; Ventouri IK.; Haselberg R.; Somsen GW. Capillary electrophoresis: Trends and recent advances., Anal Chem., 2018, 90, 1464–1481. doi: https://doi.org/10.1021/acs.analchem.8b00015.
CrossRef - Dawod M.; Arvin NE.; Kennedy RT. Recent advances in protein analysis by capillary and microchip electrophoresis., Analyst., 2017, 142(11), 1847–1866. doi: https://doi.org/10.1039/C7AN00198C.
CrossRef - Darwish IA.; Amer SM.; Abdine HH.; Al-Rayes LI. New spectrophotometric and fluorimetric methods for determination of fluoxetine in pharmaceutical formulations., Int J Anal Chem., 2009, 257306, 1–9. doi: https://doi.org/10.1155/2009/257306.
CrossRef - Gegechkori VI.; Shatilina AA.; Shulga NA.; Kuzina VN.; Vas’kova LB., Zenin VA., Levko AA. Application of fluorimetry for the determination of impurities in pancreatin in developing a reference standard., Pharm Chem J., 2023, 56, 1502–1505. doi: https://doi.org/10.1007/s11094-023-02821-4.
CrossRef - Li W.; Cao LX.; Li GR.; Jin WJ. Applications of phosphorimetry in pharmaceutical analysis., Guang Pu Xue Yu Guang Pu Fen Xi., 2002, 22(3), 518–522.
- Qarah N, El-Maaiden E. Spectrophotometric/titrimetric drug analysis. In: Shukla R, Kuznetsov A, Ali A, editors. Drug Formulation Design. 2023:3-12. Doi: https://doi.org/10.5772/intechopen.109364.
CrossRef - Siddiqui MR.; Alothman ZA.; Rahman N. Analytical techniques in pharmaceutical analysis: a review., Arab J Chem., 2017, 10(Suppl. 1), S1409–S1421. doi: https://doi.org/10.1016/j.arabjc.2013.04.016.
CrossRef - Claridge TDW. High-Resolution NMR Techniques in Organic Chemistry. 3rd ed. Elsevier; 2016:1-80. ISBN: 978-0-08-099986-9.
- Smith E, Dent G. Modern Raman Spectroscopy: A Practical Approach. 2nd ed. Wiley; 2019:1-50. ISBN: 0-471-49794-0.
- Fasman GD. Circular Dichroism and the Conformational Analysis of Biomolecules. Springer; 1996:1-30. ISBN: 978-0-306-45142-3.
- Schlücker S. Surface-enhanced Raman spectroscopy: concepts and chemical applications., Angew Chem Int Ed., 2014, 53(19), 4756–4795. doi: https://doi.org/10.1002/anie.201205748.
CrossRef - Nara SN.; Ojha RR.; Hamrapurkar PD. A review on the liquid chromatography–nuclear magnetic resonance (LC–NMR) and its application in pharmacy., World J Pharm Res., 2020, 9(12), 647–662. doi: https://doi.org/10.20959/wjpr202012-18839.
- Walker GS.; O’Connell TN. Comparison of LC–NMR and conventional NMR for structure elucidation in drug metabolism studies., Expert Opin Drug Metab Toxicol., 2008, 4(10), 1295–1305. doi: https://doi.org/10.1517/17425255.4.10.1295.
CrossRef - Lequin RM. Enzyme immunoassay (EIA)/enzyme-linked immunosorbent assay (ELISA)., Clin Chem., 2005, 51(12), 2415–2418. doi: https://doi.org/10.1373/clinchem.2005.051532.
CrossRef - Yalow RS.; Berson SA. Immunoassay of endogenous plasma insulin., J Clin Invest., 1960, 39(7), 1157–1175. doi: https://doi.org/10.1172/JCI104363.
CrossRef - Wild D. The Immunoassay Handbook. 4th ed. Elsevier; 2013:1-40. Doi: https://doi.org/10.1016/C2010-0-66244-4.
CrossRef - Valones MAA.; Guimarães RL.; Brandão LAC.; de Souza PRE.; Carvalho AAT.; Crovela S. Principles and applications of polymerase chain reaction in medical diagnostic fields: a review., Braz J Microbiol., 2009, 40, 1–11. doi: https://doi.org/10.1590/S1517-83822009000100001.
CrossRef - Maheaswari R.; Kshirsagar JT.; Lavanya N. Polymerase chain reaction: a molecular diagnostic tool in periodontology., J Indian Soc Periodontol., 2016, 20(2), 128–135. doi: https://doi.org/10.4103/0972-124X.176391.
CrossRef - Niemeyer CM.; Adler M.; Wacker R. Immuno-PCR: high sensitivity detection of proteins by nucleic acid amplification., Trends Biotechnol., 2005, 23(4), 208–216. doi: https://doi.org/10.1016/j.tibtech.2005.02.006.
CrossRef - Keustermans GCE.; Hoeks SBE.; Meerding JM.; Prakken BJ.; de Jager W. Cytokine assays: an assessment of the preparation and treatment of blood and tissue samples., Methods., 2013, 61(1), 10–17. doi: https://doi.org/10.1016/j.ymeth.2013.04.005.
CrossRef - Rissin DM.; Kan CW.; Campbell TG.; Howes SC.; Fournier DR.; Song L.; Piech T.; Patel PP.; Chang L.; Rivnak AJ.; Ferrell EP.; Randall JD.; Provuncher GK.; Walt DR.; Duffy DC. Single-molecule enzyme-linked immunosorbent assay detects serum proteins at subfemtomolar concentrations., Nat Biotechnol., 2010, 28(6), 595–599. doi: https://doi.org/10.1038/nbt.1641.
CrossRef - Takáts Z.; Wiseman JM.; Gologan B.; Cooks RG. Mass spectrometry sampling under ambient conditions with desorption electrospray ionization., Science., 2004, 306(5695), 471–473. doi: https://doi.org/10.1126/science.1104404.
CrossRef - Park HM.; Kim HJ.; Jang YP.; Kim SY. Direct analysis in real time mass spectrometry (DART-MS) analysis of skin metabolome changes in the ultraviolet B-induced mice., Biomol Ther., 2013, 21(6), 470–475. doi: http://dx.doi.org/10.4062/biomolther.2013.071.
CrossRef - Harkewicz R.; Dennis EA. Applications of mass spectrometry to lipids and membranes., Annu Rev Biochem., 2011, 80, 301–325. doi: https://doi.org/10.1146/annurev-biochem-060409-092612.
CrossRef - Whitesides G. The origins and the future of microfluidics., Nature., 2006, 442, 368–373. doi: https://doi.org/10.1038/nature05058.
CrossRef - Ekins S.; Puhl AC.; Zorn KM.; Lane TR.; Russo DP.; Klein JJ, Hickey AJ.; Clark AM. Exploiting machine learning for end-to-end drug discovery and development., Nat Mater., 2019; 18(5), 435–441. doi: https://doi.org/10.1038/s41563-019-0338-z.
CrossRef - Nováková L. Challenges in the development of bioanalytical liquid chromatography–mass spectrometry., J Chromatogr A., 2013, 1292, 25–37. doi: https://doi.org/10.1016/j.chroma.2012.08.087.
CrossRef - Pandey S.; Pandey P.; Tiwari G.; Tiwari R. Bioanalysis in drug discovery and development., Pharm Methods., 2010, 1(1), 14–24. doi: https://doi.org/10.4103/2229-4708.72223.
CrossRef - Straubhaar J.; D’Souza A.; Niziolek Z.; Budnik B. Single cell proteomics analysis of drug response shows its potential as a drug discovery platform., Mol Omics., 2024, 20(1), 6–18. doi: https://doi.org/10.1039/D3MO00124E.
CrossRef - Blas-Muñoz L.; Orrego AH.; Hofmeister M.; Martínez-Salvador J.; Ortega C.; Berrio VR, Díaz-Rullo J.; Finnigan J.; Charnock S.; Fessner W.-D.; González-Pastor JE.; Hidalgo A. A microfluidics-based ultrahigh-throughput screening unveils diverse ketoreductases relevant to pharmaceutical synthesis., Anal Chem., 2025, 97, 20698–20706. doi: https://doi.org/10.1021/acs.analchem.5c01029
CrossRef - Acharya B.; Behera A.; Behera S. Optimizing drug discovery: surface plasmon resonance techniques and their multifaceted applications., Chem Phys Impact., 2024, 8, 100414. doi: https://doi.org/10.1016/j.chphi.2023.100414.
CrossRef - Clark KD.; Zhang C.; Anderson JL. Sample preparation for bioanalytical and pharmaceutical analysis., Anal Chem., 2016, 88(23), 11262–11270. doi: https://doi.org/10.1021/acs.analchem.6b02935.
CrossRef - Moein MM.; El Beqqali A.; Abdel-Rehim M. Bioanalytical method development and validation: Critical concepts and strategies., J Chromatogr B., 2017, 1043, 3–11. doi: https://doi.org/10.1016/j.jchromb.2016.09.028.
CrossRef
Abbreviations
| GC-MS | Gas Chromatography–Mass Spectrometry |
| LC-MS | Liquid Chromatography–Mass Spectrometry |
| TLC | Thin-Layer Chromatography |
| HPLC | High-Performance Liquid Chromatography |
| GC | Gas Chromatography |
| UHPLC / UPLC | Ultra-High-Performance Liquid Chromatography |
| SFC | Supercritical Fluid Chromatography |
| LC-MS/MS | Liquid Chromatography–Tandem Mass Spectrometry |
| HRMS | High-Resolution Mass Spectrometry |
| TOF | Time-of-Flight (Mass Analyzer) |
| QTOF | Quadrupole Time-of-Flight |
| CE | Capillary Electrophoresis |
| CE-ICP-MS | Capillary Electrophoresis–Inductively Coupled Plasma Mass Spectrometry |
| LC-ICP-MS | Liquid Chromatography–Inductively Coupled Plasma Mass Spectrometry |
| CE-MS | Capillary Electrophoresis–Mass Spectrometry |
| CV | Cyclic Voltammetry |
| DPV | Differential Pulse Voltammetry |
| SWV | Square Wave Voltammetry |
| PK | Pharmacokinetics |
| PD | Pharmacodynamics |
| AUC | Area Under Curve |
| Cmax | Maximum (Peak) Concentration |
| TK | Toxicokinetic |
| TDM | Therapeutic Drug Monitoring |
| POC | Point-of-Care Diagnostics |
| NMR | Nuclear Magnetic Resonance |
| CD | Circular Dichroism |
| SERS | Surface-Enhanced Raman Spectroscopy |
| LC-NMR | Liquid Chromatography–Nuclear Magnetic Resonance |
| ELISA | Enzyme-Linked Immunosorbent Assay |
| RIA | Radioimmunoassay |
| PCR | Polymerase Chain Reaction |
| MSDS | Meso Scale Discovery (electrochemiluminescence immunoassay platform) |
| EMR | Electromagnetic radiation |
Accepted on: 10 Apr 2026


ISSN Online: 2231-5039